This is an author-deposited version published in: http://oatao.univ-toulouse.fr/ Eprints ID: 5006
To link to this article: DOI:10.1016/j.jenvman.2011.02.016 URL : http://dx.doi.org/10.1016/j.jenvman.2011.02.016
To cite this version:Boix, Marianne and Montastruc, Ludovic and Pibouleau, Luc and Azzaro-Pantel, Catherine and Domenech, Serge A multiobjective optimization framework for multicontaminant industrial water network design. (2011) Journal of Environmental Management, vol. 92 (n° 7). pp. 1802-1808. ISSN 0301-4797㩷
O
pen
A
rchive
T
oulouse
A
rchive
O
uverte (
OATAO
)
OATAO is an open access repository that collects the work of Toulouse researchers and makes it freely available over the web where possible.
Any correspondence concerning this service should be sent to the repository administrator: [email protected]㩷
A multiobjective optimization framework for multicontaminant
industrial water network design
Marianne Boix
*, Ludovic Montastruc, Luc Pibouleau, Catherine Azzaro-Pantel, Serge Domenech
Laboratoire de Génie Chimique (LGC), Université de Toulouse, 4, Allée Emile Monso, BP 84234, 31432 Toulouse, France
Keywords: Water network Multicontanimant Multiobjective optimization MINLP MCDM TOPSIS
a b s t r a c t
The optimal design of multicontaminant industrial water networks according to several objectives is carried out in this paper. The general formulation of the water allocation problem (WAP) is given as a set of nonlinear equations with binary variables representing the presence of interconnections in the network. For optimization purposes, three antagonist objectives are considered: F1, the freshwater flow-rate at the network entrance, F2, the water flow-flow-rate at inlet of regeneration units, and F3, the number of interconnections in the network. The multiobjective problem is solved via a lexicographic strategy, where a mixed-integer nonlinear programming (MINLP) procedure is used at each step. The approach is illustrated by a numerical example taken from the literature involving five processes, one regeneration unit and three contaminants. The set of potential network solutions is provided in the form of a Pareto front. Finally, the strategy for choosing the best network solution among those given by Pareto fronts is presented. This Multiple Criteria Decision Making (MCDM) problem is tackled by means of two approaches: a classical TOPSIS analysis is first implemented and then an innovative strategy based on the global equivalent cost (GEC) in freshwater that turns out to be more efficient for choosing a good network according to a practical point of view.
1. Introduction
The interactions between industry and environment were practically nonexistent, or regarded as a secondary concern a few years ago. Nowadays, the environmental preservation became yet an imperative for all human activities, involving namely industries. Consequently, there is a real industrial challenge for insuring good production levels while polluting and consuming natural resources as less as possible. In particular, industrial development is always linked to the use of high volumes of freshwater. The terrestrial freshwater reserves have been known to be finite and widely affected by human activities for several decades. According to a recent environmental outlook (OECD, 2008), the number of people living in areas of severe water stress will increase from 1 billion to over 3.9 billion by 2030.
The total freshwater consumption has been recently estimated at 4000 km3a year and the part of industries accounts for 20 per cent of this consumption (UNESCO, 2009). However, in a lot of industrialized countries, this industrial water consumption widely
exceeds fifty percent. Hence, it becomes urgent to propose feasible solutions which can be easily implemented in the industrial world, while respecting reasonable costs that do not weaken productivity. By developing cleaner and more economic water networks, the freshwater consumption as well as waste water can be reduced by far. Furthermore, most of the industries involve a lot of contami-nants in the processing chain that have also to be minimized in the waste flows. The resulting problem is typically multiobjective with several conflicting objectives to be simultaneously optimized.
In previous works, water allocation problems (WAP) have been tackled by three main approaches including graphical methodology (Linnhoff and Vredeveld, 1984; Dunn and El-Halwagi, 2003; Jacob et al., 2002; Manan et al., 2006), mathematical programming (Bagajewicz and Savelski, 2001; Feng et al., 2008; Huang et al., 1999; Savelski and Bagajewicz, 2003) and synthesis of mass exchange networks (El-Halwagi, 1997; Hallale and Fraser, 2000; Shafiei et al., 2004).
On the one hand, although easy to understand, the main drawback of graphical technologies is the difficulty of dealing with multicontaminant and complex water network. It is mainly for this purpose that design methods have been recently more developed with multiobjective evolutionary algorithms (Deb, 2001; Coello Coello et al., 2002). They are of several types including genetic * Corresponding author. Tel.: þ335 34 32 36 58; fax: þ335 34 32 37 00.
programming, evolutionary strategies (Maier et al., 2003) or genetic algorithms (GA). The latter is the most used in water network problems (Prakotpol and Srinophakun, 2004; Lavric et al., 2005; Keedwell and Khu, 2005; Cao et al., 2007). In these studies, the use of a GA is often based on pinch technology needing preliminary simplifications. Furthermore, most of GA encounters difficulties when dealing with problems involving Mixed Integer Programming’s (MIP’s) equality constraints, as it is the case in this study (the balance equations must be satisfied with a tolerance less than 10"15). Another main drawback of these methods is that they consume a large computation time (Keedwell and Khu, 2005).
On the other hand, due to the recent development of efficient numerical toolboxes, the graphical methods pinch-based tech-niques have been competed by mixed-integer programming approaches either linear (MILP) or nonlinear (MINLP). The linear case is generally restricted to simple water networks involving only one contaminant, while the nonlinear one can theoretically be applied to more complex networks.
Huang et al. (1999) defined a superstructure of a complex network involving processes using both water and regenerating units for water with a given output concentration of contaminants. The first linear formulations implemented for maximizing the water regeneration and reuse into industrial processes are due to
Bagajewicz and Savelski (2001), El-Halwagi et al. (2003)andWang and Smith (1994).Quesada and Grossmann (1995)and, later,Galan and Grossmann (1998)developed a MINLP strategy based on the relaxation of the bilinear terms involved in the balance equations. Indeed, the maximization of the water recovery implies the mini-mization of freshwater consumption as well as of the effluent emissions. Recently, Feng et al. (2008) and Ahmetovic and Grossmann (2010) have studied multicontaminant water networks with a sequential multiobjective optimization. Very few
studies take into account several objectives simultaneously. It is more common to choose a cost objective function to minimize. However, it does not guarantee a simple topology for the network and it proposes only one network instead of several suitable solu-tions. Various techniques can tackle with more than one objective such as genetic algorithms (Tamaki et al., 1996), or weighted-sum (Zadeh, 1963; Kim and de Weck, 2005) and epsilon-constraint methods (Marglin, 1967). The former is not used because of the previous comments on the use of GA and the second presents two main drawbacks. The first one is the distribution of the weight upon objectives that cannot be representative of real cases and the second is that this method is not able to find solutions to non-convex problems which is the case here (Kim and de Weck, 2005). In a lot of published works, it is generally admitted that the study of a multicontaminant water network may be simplified by using the commonly called “key parameter” (Bagajewicz et al., 2000; Savelski and Bagajewicz, 2003; Wang et al., 2005; Walczyk and Jezowski, 2008). According to Bagajewicz et al. (2000), the key component can be defined following these rules: « if a solution is optimal, then at every process, the outlet concentration of a key component is not lower than the concentration of the combined wastewater stream coming from all the precursors. The key component of a process is obtained as follows: the minimum freshwater flow-rate needed to pick up the load of each component in the process is calculated. The key component is the one corre-sponding to the largest of these flow-rates.” This approach allows solving a multicontaminant WAP with only one objective function that can be either the freshwater consumption or a cost objective function. However, the multiobjective aspect will be kept in this paper to preserve the problem generality. In what follows, we show that the key contaminant may change in function of the freshwater flow-rate used in the network. So a study based on the key Nomenclature
Cdi Discharged concentration of contaminant i (ppm) Cmaxi
i;j Maximum inlet concentration of contaminant i for process j (ppm)
Cmaxo
i;j Maximum outlet concentration of contaminant i for process j (ppm)
Crmaxo
i;l User-fixed outlet concentration of contaminant i for regeneration unit l (ppm)
Cpi
i;j Inlet concentration of contaminant i for process j (ppm)
Cpo
i;j Outlet concentration of contaminant i for process j (ppm)
Cri
i;l Inlet concentration of contaminant i for regeneration unit l (ppm)
Cro
i;l Outlet concentration of contaminant i for regeneration unit l (ppm)
Ei;l Efficiency of regeneration unit l regarding contaminant i
F1 Freshwater flow-rate at the network entrance (T h"1) F2 Water flow-rate at inlet of regeneration units (T h"1) F3 Number of interconnections into the network GA Genetic Algorithm
GEC Global Equivalent Cost (T h"1) MCDM Multiple Criteria Decision Making
Mi,j Mass load of contaminant i generated by process j (g h"1)
MINLP Mixed Integer NonLinear Programming NLP NonLinear Programming
TOPSIS Technique for Order Preference by Similarity to Ideal Solution
WAP Water Allocation Problem
wdj Discharged water flow-rate from process j (T h"1) Wpj/k Water flow-rate between two processes j and k (T h"1) Wprj/l Water flow-rate going from process j to regeneration
unit l (T h"1)
Wrl/m Water flow-rate between two regeneration units l and m (T.h"1)
Wrdl Discharged water flow-rate from regeneration unit l (T h"1)
Wrpl/j Water flow-rate going from regeneration unit l to process j (T h"1)
W1j Freshwater flow-rate used by a process (T h"1); index 1 represents freshwater y Binary variable Subscripts i Contaminant j,k Processes l,m Regeneration units Superscripts i Inlet o Outlet
contaminant is valid in the aim of finding the minimum freshwater target but cannot be implemented for designing an optimal water network regarding several objectives.
This paper deals with the optimal design of multicontaminant water networks according to several objectives. The general formulation of the WAP is given as a set of nonlinear equations in the first part of this paper. In order to properly design a clean and economically viable network, three antagonist objectives are considered: F1, the freshwater flow-rate at the network entrance, F2, the water flow-rate at inlet of regeneration units, and F3, the number of interconnections into the network. The first criterion is the most commonly used for environmental purposes. The objec-tive F2is related to economical insight because if a high amount of regenerated water will be associated with an increased cost for the user. The third one represents the network complexity through the number of interconnections. Then, the numerical tool, namely a multiobjective mixed-integer nonlinear programming (MINLP) procedure implemented in a lexicographic strategy based on epsilon-constraint method is briefly described.
A numerical example from the literature illustrates the approach. The selection of a particular network after the multi-objective optimization study is yet still lacking in the majority of all the previous works dealing with multiobjective optimization. Hence, after providing a lot of solutions displayed in the form of a Pareto front, a multicriteria decision making procedure has to be implemented in order to guide the practitioner for choosing a particular network within the solution set. For this purpose, two methods are implemented for tackling the Multiple Criteria Deci-sion Making (MCDM) problem: first, a classical TOPSIS analysis and, second, an innovative strategy based on the global equivalent cost (GEC) in freshwater that turns out to be more efficient for choosing a good network according to a practical point of view.
2. Problem definition 2.1. Superstructure formulation
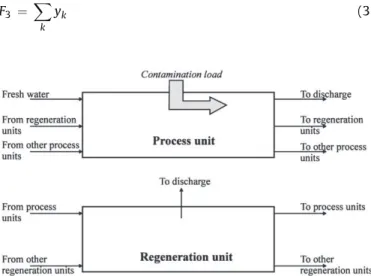
The formulation of the WAP is similar to the one of the majority of previous works (see for exampleChew et al., 2008): from a given number of regeneration units and processes, all the possible connections between them may exist, except regeneration recy-cling to the same regeneration unit or from a process to the same one. The latter restriction on superstructure forbids self-recycles on process and regeneration units, although this operation is often relevant in chemical industries. Each process admits fixed maximal input and output concentrations, and in the same way, regenera-tion units have a given processing capacity. For each water-flow-rate using process, input water may be freshwater, used water coming from other processes and/or recycled water; the output water for such a process may be directly discharged, distributed to other processes and/or to regeneration units. Similarly, for a regeneration unit, input water may come from processes or other regeneration units. Regenerated water may be reused in the processes or directed to other regeneration units. By concern of generalization, the problem is built as a set of black boxes, in order to adapt the formulation to a great variety of practical cases. In this black-box approach, the role (physical or chemical transformation) of each process within the network is not taken into account. For each process input or output contaminant mass fractions (ppm) are imposed by the user, and constitute bounds for the optimization problem.
Each task performed by a given process contaminates its input water up to a given mass fraction. The amount of pollutant i generated by a process j is noted, Mi,jand is expressed in mass flow-rate (g h"1) in order to have to consistent units with the water flow-rate (T h"1) and
the contaminant mass fraction (ppm). For each practical example, the values of Mi,jhave to be user-provided. A regeneration unit can be defined by two ways: either it has a given efficiency depending on the pollutant under treatment (in that case, Ei,lrepresents the efficiency of the regeneration unit l for component i, 0 < Ei,l<1), or it processes input water so as to obtain a given mass fraction of pollutant at the unit output. The two generic elements of the general superstructure (process and regeneration unit) are displayed inFig. 1.
2.2. Objective functions
In order to properly design a clean and economically viable network, three objectives to be simultaneously minimized are considered:
- F1:freshwater flow-rate at the network entrance (T h"1), - F2: water flow-rate at inlet of regeneration units (T h"1), - F3: number of interconnections into the network
The first criterion is most commonly used for environmental purposes. F1 represents the sum of freshwater flow-rates at the entrance of each water-using process j:
F1 ¼
X
j
W1j (1)
Multiobjective optimization is relevant to antagonist objective functions. Hence, in a water network, if the freshwater is mini-mized, the amount of regenerated water will logically increase. Consequently, the regenerated water flow-rate expressed as the sum of the water flow-rates going from a process to a regeneration unit and from a regeneration unit to another is the second criterion chosen (F2). This criterion is related to economical insight because if the amount of regenerated water is high, the cost will increase for the user. F2 ¼ " X l " X m Wrm/lþX j Wprj/l## (2)
Lastly the complexity, represented by the number of intercon-nections of the network, has to be taken into account. Furthermore, it is shown (Chew et al., 2008) that pipes and associated infra-structure significantly contribute to the network investment cost.
F3 ¼
X
k
yk (3)
2.3. Modelling equations
As in previous studies, a multicontaminant WAP can be gener-ally stated in terms of concentrations and total mass flows, following the standard relations.
-Water balances on processes:
W1jþX k Wpk/jþX l Wrpl/j ¼ Wdj 1þ X k Wpj/k þX l Wprj/l (4)
-Contaminant balances on inlet processes:
X k $ Wpk/j$Cpok;i%þX l $ Wrpl/j$Crol;i% ¼ " W1j þX k Wpk/jþX l Wrpl/j#$Cpi j;i (5)
-Mass balances of contaminant on processes:
" W1j þX k Wpk/jþX l Wrpl/j # $Cpij;iþMji>1 ¼ " W1j þX k Wpk/jþX l Wrpl/j # $Cpoj;i (6)
-Water balances on regeneration units:
X j Wprj/lþX m Wrm/l¼X j Wrpl/jþX m Wrl/mþWrdl (7)
-Mass balances of contaminant on regeneration units:
X j $ Wprj/l$Cpo j;i % þX m $ Wrm/l$Cro m;i % ¼ " X j Wprj/lþX m Wrpm/l # $Cril;i (8)
-Overall mass balances of contaminants on discharge:
X j $ Wdj$Cpo j;i % þX l $ Wrdl$Cro l;i % ¼ " X j WdjþX l Wrdl#$Cd i (9)
Moreover, constraints on inlet and outlet concentrations of each process are defined, similarly to the constraint on post-regenera-tion concentrapost-regenera-tion:
Cpi
j;i%Cmaxij;i (10)
Cpo
j;i%Cmaxoj;i (11)
Cro
l;i ¼ Crmaxol;i (12)
Eqs. (4)e(12) are nonlinear continuous relations, but for designing the water network, additional binary variables y are introduced, transforming the initial NLP problem into a MINLP one. They are related to the existence of water flow-rates in the net-work:if yk¼0, then the associated flow-rate k does not exist,
if yk¼1, then the associated flow-rate k exists.
These binary variables are added in the mathematical problem by using the classical “big-M” formulation. Consequently, the decision variables for the WAP related to water connections in the network
are: the total water flow-rate expressed in T h"1, the total contami-nant flow-rate in g h"1, and the associated binary variables y. 2.4. Numerical resolution
In order to solve the multiobjective MINLP problem: Min (F1, F2, F3), the same strategy as in our previous work (Boix et al., 2010) was adopted. Biobjective optimization problems Min (F1, F2) are solved for fixed values (between the minimum and maximum number of possible interconnections) of F3, which is introduced as an equality constraint. The biobjective optimization is carried out by a lexico-graphic optimization (Mavrotas, 2009). In the solution method, one of the objective functions is minimized by means of a MINLP or an NLP procedure, while all the other objective functions are consid-ered as additional constraints.
The MINLP procedure uses the GAMS library and the continuous sub-problems are solved with an NLP code. Generally speaking, a lot of solvers can fail to reach NLP solutions due to non-convex bilinear terms in the constraints. For this reason we have chosen the global and robust optimizer COIN-BONMIN 0.9 (COmputational Infrastructure e Basic Open-source Nonlinear Mixed Integer Programming, with Bonmin library 0.99, using MUMPS library 4.7.3) of the GAMS package (Bonami et al., 2006).
To solve this MINLP problem, a Branch-and-Bound algorithm of the GAMS package is used. This strategy has been adopted after preliminary tests on a literature example. For this purpose a case study related to a petrochemical site involving 10 processes and 3 contaminants has been studied to validate our approach.Savelski et al. (1999) used necessary conditions of optimality to reduce the MINLP in a decomposition of linear problems andIancu (2007)
applied a GA in order to optimize this network. The first approach lead to a minimum freshwater target of 392.85 T h"1 and the second found a better solution of 389.87 T h"1. Our methodology improved these results by finding a solution of 388.59 T h"1. Furthermore, the network obtained included no streams with a flow-rate lower than 1 T h"1as in the two other studies. These results prove the ability of our approach to give good solutions compared to other methods found in literature.
3. Results 3.1. Problem data
The example studied is taken from the paper of Feng et al. (2008). It contains five processes, three contaminants, one Table 1
Network parameters.
Process Contaminant Cmaxi
j Cmaxcj Mi,j j i ppm ppm g h"1 1 1 0 50 1000 2 0 100 2500 3 0 50 1500 2 1 10 100 5000 2 30 300 20000 3 40 600 5000 3 1 20 200 5000 2 50 400 15000 3 50 100 10000 4 1 50 600 20000 2 110 450 15000 3 200 400 10000 5 1 500 1100 30000 2 300 3500 15000 3 600 2500 25000
regeneration unit and a freshwater source which is free of contaminants. Each process has maximum inlet and outlet concentrations for each contaminant which are summarized in
Table 1, which involves also the contaminant mass load Mi,j generated by each process. The regeneration units clear wastewater up to a fixed post-regeneration concentration for each contami-nant; these values are fixed at 10, 30 and 40 ppm, respectively for contaminant 1, 2 and 3. All these values constitute the input data set for the MINLP which involves 145 continuous variables (flow-rates) declared as positive, 41 binary variables (i.e. the network involves at most 41 interconnections) and 172 equations.
3.2. Problem bounds
First, three monobjective optimizations of the three component network are carried out in order to fix the bounds of the multi-objective optimization; the results are displayed inTable 2. The bold numbers represent the results for the minimized criterion while the two others are kept free. It should be noted that for this particular network, the minimum freshwater target of 30 T h"1was found as reported in the literature (Feng et al., 2008). Then, the minimum interconnection number is 11, i.e. there is no feasible solution that contains less than 11 interconnections. Obviously, 0 T h"1is the minimum of regenerated water flow-rate but this case is without any interest because it does not take into account the regeneration unit. These results also show that the three criteria are antagonist with respect to their respective variations.
3.3. NLP solution
By using the abovementioned bounds, the biobjective optimi-zation of the multicomponent water network is performed for the maximum number (41) of interconnections. So, binary variables disappear from the MINLP problem which is now reduced to an NLP one.Fig. 2displays the results of biobjective optimization for the three-component water network compared to the networks where
the three contaminants are considered separately. The first obser-vation is that Pareto fronts are straight lines for each network. Then, the three monocontaminant networks involve flow-rates lower than the multicontaminant one, which is relevant because the problem is more constrained with more components (let’s also note that the lower bounds on freshwater for the monocontaminant networks are lower than the one of the multicomponent network, equal to 30 T h"1). Furthermore, it can be easily highlighted that the three fronts are not parallel: the 2nd cuts the 3rd, showing that the key contaminant may change in function of the freshwater flow-rate used in the network. This point induces a change in the Pareto front slope for the multicontaminant network at a freshwater consumption of about 84 T h"1. In this example, the first contam-inant key is the third one because its curve is above the two others. Consequently, this contaminant sets the global minimum fresh-water target of the multicontaminant network at 30 T h"1. After 84 T h"1, the key contaminant becomes the second one.
A study based on the key contaminant is valid in the aim of finding the minimum freshwater target but cannot be imple-mented for designing an optimal water network regarding several objectives. Indeed the key component method cannot be used for determining the regenerated water flow-rate and also the inter-connection number. These preliminary results reinforce the interest of implementation of a multiobjective MINLP procedure.
3.4. Multiobjective MINLP solution
A biobjective optimization parameterized by the interconnec-tion number is carried out in the range [11, 41]. Starting from F3¼11, all the possible values for F3were tested.Fig. 3shows all the non-dominated feasible solutions for F3¼11 (triangles), 12 (circles), 13 (crosses), 15 (squares), 41 (diamonds) which consequently constitute Pareto fronts. These solutions can also be qualified as efficient for each interconnection number value. Only one simple network including 11 connections has been found and it is very efficient in terms of freshwater consumption (30 T h"1, the minimum). By contrast, in this network, water is regenerated far too much at a rate of 300 T h"1. Note that when the interconnection number increases, flow-rates in regenerated water decrease, while flow-rates in freshwater increase.
Thus, for a minimal freshwater flow-rate fixed (30 T h"1), 12 and 13 interconnections networks regenerate water at 270 T h"1and 260 T h"1, respectively, and the regenerated water flow-rate falls to 223 T h"1for the network with 15 interconnections.
According toFig. 3, with an increasing interconnection number, the number of available solutions also increases whereas the Table 2
Results of monobjective optimizations. Minimized objective Interconnection
number Freshwater flow-rate Regenerated water flow-rate Interconnection number 11 122 322 Freshwater flow-rate 41 30 223 Regenerated water flow-rate 41 189 0
Fig. 2. NLP results for the multicontaminant water network (squares) and three monocontaminant water networks (diamonds-comp. 1, circles-comp. 2 and triangles-comp. 3).
regenerated water flow-rate decreases. This result was expected because when the interconnection number decreases, the problem becomes more constrained inducing an increase in at least one objective. Another important result is that curves for 15 and 41 interconnections are almost identical, the only difference is that there are more solutions for 41 than for 15 interconnections. 4. Choosing the best network
The question of how to choose the best solution among those of the Pareto fronts still remains. In this MCDMproblem, all the three criteria F1, F2and F3have to be considered and the decision cannot be taken without regarding one of these objectives. In order to tackle the MCDM problem two tools are studied and compared: TOPSIS analysis and a new economic indicator, the so-called GEC. 4.1. TOPSIS analysis
M-TOPSIS is a synthetic evaluation method based on the concept of original TOPSIS (Ren et al., 2007) where the distance between available solutions and the ‘optimized ideal reference point’ is calculated. The optimized ideal reference point is a theoretical point where both objectives are at their minimal values; here it may be the origin (0, 0). This program calculates the distance between the origin and each point and ranks them by increasing order of distance. It is implemented in the MATLAB toolbox and assigns a rank to each solution regarding several balanced criteria. Here the three objectives are assumed to have the same weight and the thirty first results are given inTable 3.
The results clearly show that the optimal networks regarding the three criteria are those involving 15 interconnections because they use lesser water than the others. However, it appears that this analysis does not consider enough the network complexity, the simpler network with 11 interconnections being ranked 30. So a new ranking tool is proposed below.
4.2. Global equivalent cost (GEC)
To evaluate the cost of the network, we propose a new economic indicator: the global equivalent cost (GEC) measured in equivalent of water flow-rate. This new ranking tool allows expressing the overall cost of the network in amount of fresh water. It is a powerful tool as it does not need to introduce costs on each criterion; therefore, it can be used in several regions of the world. In its calculation, we take into account the fresh water flow-rate and amounts of regenerated and discharged flow-rates pondered with their contribution relative to the fresh water one (equal to 1). Consequently, three criteria are merged into only one according to the following relation:
GEC ¼ F1þR þ W (13)
where R and W are the contributions of regenerated and waste waters, with:
R ¼
a
$F2 and W ¼b
$Fw (14)where Fwis the waste water flow-rate.
In the previous relation,
a
andb
are cost elements respectively related to the regenerated water cost and post-treatment cost for water sent to the discharge;a
depends on the type of regeneration unit (seeTable 4) andb
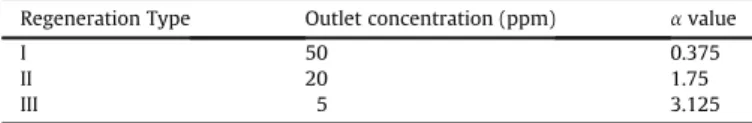
is equal to 5.625 according toBagajewicz and Faria (2009).In the studied case, post-regeneration concentrations are 10, 30 and 40 ppm for components 1, 2 and 3 respectively, so a regenera-tion of type II is the best trade-off, which leads to the following statement for GEC:
GEC ¼ 6:625 $ F1þ1:75 $ F2 (15)
For each network ofFig. 4, the corresponding GEC is calculated and plotted as a function of the interconnections number (seeFig. 4). For each value of the interconnection number, only the solution of the Pareto front with the minimal GEC is plotted inFig. 4.
If both the GEC and interconnections number are considered, the most preferred network is the network including 15 connections and using 30 T h"1and 223 T h"1of freshwater and regenerated Table 3
Results of the M-TOPSIS analysis. Freshwater flow-rate Regenerated water flow-rate Interconnection number M-TOPSIS rank 98.9 114.5 15 1 95.4 120 15 2 108.2 100 15 3 82.7 140 15 4 122.5 80 15 5 57.3 180 15 6 138.6 59.9 15 7 44.8 199.9 15 8 110.1 118 13 9 100 134.8 13 10 32.1 220 15 11 30 223.4 15 12 154.7 40 15 13 119.6 109.8 13 14 1627 30 15 15 85 167.6 13 16 178.9 10 15 17 60.1 206.8 13 18 186.9 0 15 19 115 137.3 12 20 30.1 257.8 13 21 196 0 15 22 40.1 247.9 13 23 30 273.1 12 24 80.1 201.5 12 26 70.1 219.0 13 27 150.1 99.4 13 28 179.9 63.2 13 29 30 304 11 30 Table 4
Values ofaaccording to types of regeneration units.
Regeneration Type Outlet concentration (ppm) avalue
I 50 0.375
II 20 1.75
III 5 3.125
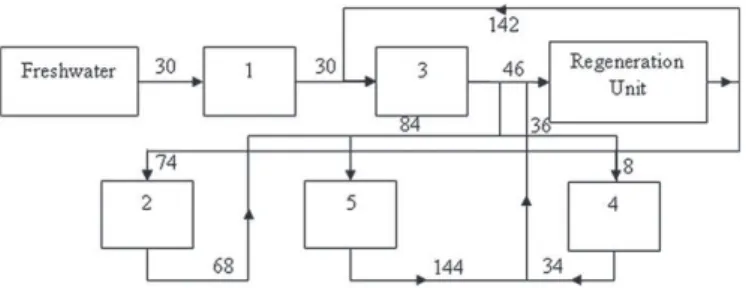
water, respectively. According to the TOPSIS analysis, this network is ranked 12th. In terms of water consumption and topology, it is the most efficient network; its flowsheet (seeFig. 5) is attractive on a practical point of view because it does not involve very low water flow-rates. The GEC of this network solution is about 589 T h"1, whereas for the three other networks consuming 30 T h"1 of freshwater it is equal to 650, 680 and 730 T h"1for 13, 12 and 11 connections respectively. These networks arrive in positions 21, 24 and 30 in the TOPSIS ranking.
5. Conclusion
A mixed-integer nonlinear programming solution for multi-contaminant water network under three antagonist objectives is presented. A generic formulation is proposed that can be adapted to a wide variety of WAP problems. The only data required are the number of processes, their associated maximum inlet and outlet concentrations, the mass load generated for each contaminant and the number of regeneration units with the corresponding efficiency related to each contaminant. The three considered objectives are: F1, the freshwater flow-rate at the network entrance linked to environmental purposes, F2, the water flow-rate at the inlet of regeneration units related to economical insight, and F3, the number of interconnections in the network associated to the network complexity.
The MINLP procedure implemented within a lexicographic strategy provides the set of efficient solutions in the form of Pareto fronts. The last part of the paper deals with the choice of a good particular solution from a practitioner point of view. This solution must involve low freshwater consumption, reduced cost and a non complex network with significant flow-rates in the pipes. This MCDM problem is treated by a classical TOPSIS ranking procedure and by means of a new indicator, the global equivalent cost (GEC) in freshwater combined with the number of network interconnec-tions. From the presented example, it appears that the GEC procedure is more efficient for identifying a good practical network among the set of solutions constituting the Pareto fronts.
References
Ahmetovic, E., Grossmann, I.E., 2010. Strategies for the global optimization of integrated process water networks. Comput. Aided Chem. Eng. 28, 901e906. Bagajewicz, M.J., Faria, D.C., 2009. On the appropriate architecture of the water/wastewater
allocation problem in process plants. Comput. Aided Chem. Eng. 26, 1e20. Bagajewicz, M.J., Savelski, M., 2001. On the use of linear models for the design of
water utilization systems in process plants with a single contaminant. Chem. Eng. Res. Des 79, 600e610.
Bagajewicz, M.J., Rivas, M., Savelski, M.J., 2000. A robust method to obtain optimal and sub-optimal design and retrofits solutions of water utilization systems with multiple contaminants in process plants. Comp. Chem. Eng. 24, 1461e1466. Boix, M., Montastruc, L., Pibouleau, L., Azzaro-Pantel, C., Domenech, S., 2010.
Mul-tiobjective optimization of industrial water networks with contaminants. Comput. Aided Chem. Eng. 28, 859e864.
Bonami, P., Forrest, J.J., Ladanyi, L., Lee, J., Margot, F., Wächter, A., 2006. Bonmin: basic open-source mixed integer solver.http://www.coin-or.org/BonminUser’s Manual.
Cao, K., Feng, X., Ma, H., 2007. Pinch multi-agent algorithm for optimizing water-using networks. Comp. Chem. Eng. 31, 1565e1575.
Chew, I.M.L., Tan, R.R., Ng, D.K.S., Foo, D.C.Y., Majozi, T., Gouws, J., 2008. Synthesis of direct and indirect interplant water network. Ind. Eng. Chem. Res. 47, 9485e9496. Coello Coello, C.A., Van Veldhuizen, D.A., Lamont, G.B., 2002. Evolutionary
Algo-rithms for Solving Multi-objective Problems. Kluwer Academic Publishers, New York, 576 pp.
Deb, K., 2001. Multi-objective Optimization Using Evolutionary Algorithms. Wiley, Chichester.
Dunn, R.F., El-Halwagi, M.M., 2003. Process integration technology review: back-ground and applications in the chemical process industry. J. Chem. Technol. Biotechnol. 78, 1011e1021.
El-Halwagi, M.M., 1997. Pollution Prevention through Process Integra-tiondSystematic Design Tools. Academic Press, CA, USA.
El-Halwagi, M.M., Gabriel, F., Harell, D., 2003. Rigorous graphical targeting for resource conservation via material recycle/reuse networks. Ind. Eng. Chem. Res. 42, 4319e4328.
Feng, X., Bai, J., Wang, H.M., Zheng, X.S., 2008. Grass-roots design of regeneration recycling water networks. Comp. Chem. Eng. 32, 1892e1907.
Galan, B., Grossmann, I.E., 1998. Optimal design of distributed wastewater treat-ment networks. Ind. Eng. Chem. Res. 37, 4036e4048.
Hallale, N., Fraser, D.M., 2000. Super-targeting for mass exchange networks. Part 1: targeting and design techniques. Trans. Inst. Chem. Eng. 78, 202e216. Huang, C.H., Chang, C.T., Ling, H.C., Chang, C.C., 1999. A mathematical programming model
for water usage and treatment network design. Ind. Eng. Chem. Res. 38, 2666e2679. Iancu, P., 2007. Process integration for water minimisation in oil processing and
petrochemistry. PhD Thesis Report, Bucarest.
Jacob, J., Viviant, C., Houle, H.F., Paris, J., 2002. Analyse et optimisation des réseaux d’eau dans les procédés de fabrication des pâtes et papiers: La technique du pincement à l’œuvre. Pulp Pap. Can. 103, 24e27.
Keedwell, E., Khu, S.T., 2005. A hybrid genetic algorithm for the design of water distribution networks. Eng. Appl. Artific. Intell. 18, 461e472.
Kim, I.Y., de Weck, O.L., 2005. Adaptive weighted-sum method for bi-objective optimization: Pareto front generation. Struct. Multidisc. Optim 29, 149e158. Lavric, V., Iancu, P., Plesu, V., 2005. Genetic algorithm optimisation of water
consumption and wastewater network topology. J. Clean. Prod. 13, 1405e1415. Linnhoff, B., Vredeveld, R., 1984. Pinch technology has come of age. Chem. Eng.
Prog., 33e40.
Maier, H.R., Simpson, A.R., Zecchin, A.C., Foong, W.K., Phang, K.Y., Seah, H.Y., Tan, C.L., 2003. Ant colony optimization for design of water distribution systems. J. Water Res. Plann. Manag. 129, 200e209.
Manan, Z.A., Wan Alwi, S.R., Ujang, Z., 2006. Water pinch analysis for an urban system: a case study on the Sultan Ismail Mosque at the Universiti Teknologi Malaysia (UTM). Desalination 194, 52e68.
Marglin, S., 1967. Public Investment Criteria. MIT Press, Cambridge, M.A. Mavrotas, G., 2009. Effective implementation of thee-constraint method in multi-objective
mathematical programming problems. Ap. Math. Comp. 213, 455e465.
Oecd, Organisation for economic co-operation and development, 2008. OECD Environmental Outlook to 2030 (Paris).
Prakotpol, D., Srinophakun, T., 2004. GAPinch: genetic algorithm toolbox for wáter pinch technology. Chem. Eng. Proc. 43, 203e217.
Quesada, I., Grossmann, I.E., 1995. Global optimization algorithm of process networks with multicomponent flows. Comp. Chem. Eng. 19, 12e19. Ren, L., Zhang, Y., Wang, Y., Sun, Z., 2007. Comparative analysis of a novel M-TOPSIS
method and TOPSIS. Ap. Math. Res. Express 1.
Savelski, M., Bagajewicz, M., 2003. On the necessary conditions of optimality of water utilizations systems in process plants with multiple contaminants. Chem. Eng. Sci. 58, 5349e5362.
Savelski M.J., Rivas, M., Bagajewicz, M.J., 1999. Efficient use and reuse of water in refineries and process plants. ENPROMER’99 e II Congresso de Engenharia de Processos do MERCOSUL, Florianópolis -Santa Catarina e Brasil.
Shafiei, S., Domenech, S., Koteles, R., Paris, J., 2004. System closure in pulp and paper mills: network analysis by genetic algorithm. J. Clean. Prod. 12, 131e135. Tamaki, H., Kita, H., Kobayashi, S., 1996. Multiobjective optimization by genetic
algorithms: a review. IEEE International Conference on Evolutionary Compu-tation, ICEC 1996, Nagoya, Japan.
UNESCO, ParisEarthscan, London, 2009. World Water Assessment Programme. The United Nations World Water Development Report 3: Water in a Changing World.
Walczyk, K., Jezowski, J., 2008. A single stage approach for designing water networks with multiple contaminants. Comput. Aided Process Eng. 18, 719e724.
Wang, Y.P., Smith, R., 1994. Wastewater minimization. Chem. Eng. Sci. 49 (981), 1006.
Wang, D., Yang, F., Zhang, X., 2005. Algorithmic procedure to design water utili-zation systems featuring multiple contaminants in process plants. Chin. J. Chem. Eng. 13, 396e402.
Zadeh, L., 1963. Optimality and non-scalar-valued performance criteria. IEEE Trans. Autom. Control 8, 59e60.
Fig. 5. Flowsheet of the network solution with 15 connections (connections to the discharge are not represented).