Influence of damping and force hypotheses for evaluating
ductility demand of structures subjected to time history wind
loading
Taleb Sabbek
a, Sébastien Langlois
a, Frédéric Légeron
ba
Departement of Civil Engineering, Université de Sherbrooke, 2500 boul. De l’Université, Sherbrooke, QC, Canada
b
PMC – Bridge & Tunnel UAE District Manager, Parsons, Abu Dhabi PO5498, UAE
ABSTRACT: Current wind design procedures require that structural behavior remains elastic under wind loading corresponding to a specific return period unlike seismic codes that set some specifications to account for the ductile behavior of structures. Based on both linear and nonline-ar dynamic time history analyses of simplified shenonline-ar frame structures, this study examines the sensitivity of the ductility demand to different analysis hypotheses, and gives recommendations for their adequate values to be used in extended parametric studies. In particular, the current re-sults show that the use of admittance functions strongly influence the ductility demand of struc-tures. It was also shown that the ductility demand of the structure varies significantly with the damping ratio. More specifically, it was found that a 1% damping ratio (including the aerody-namic damping) is a coherent and conservative value to be used for parametric studies on medi-um-to-high-rise structures in order to establish a relation between the ductility demand and the strength reduction factor for structures subjected to extreme wind loadings.
KEYWORDS: Time domain analysis, nonlinear analysis, extreme wind loading, damping, ductility.
1 INTRODUCTION
Unlike modern seismic codes that account for the ductile behavior of structures, current wind de-sign procedures require that structural behavior remains elastic under wind loading correspond-ing to a specific return period. This assumption would naturally lead to an increase in the struc-tural costs especially where the structures are exposed to extreme wind events (low probability of occurrence events) such as severe storms and hurricanes and/or where wind loadings are prevail-ing the overall structural response. In some situations, the structures are already designed with a specific value of ductility, and therefore they have more safety margin against failure compared to their brittle counterparts. Therefore, it is of both economic and safety interests to evaluate the ductility demand of structures under extreme wind events.
In the literature, several endeavors were attempted to understand the inelastic behavior of structures under wind loading. For example, Chen and Davenport [4] studied the vulnerability of tall buildings in hurricanes based on a simplified analytical approach developed earlier by Vick-ery [23] to estimate the nonlinear response of lightly damped structure under wind loading. Non-linear time history analyses were conducted by Tschanz [21] and Gani and Légeron [8] to evalu-ate the effects of different analysis parameters on the ductility demand of structures under wind loading. They conducted parametric studies on the effect of both structural parameters (e.g.,
sin-gle degree of freedom(SDOF) or multi degree of freedom (MDOF), aerodynamic and structural damping) and wind force calculation hypotheses (e.g., real wind speed measurement, numerical-ly generated wind speed and wind turbulence intensity) on the ductile behavior of structures. It is to be noted that most of these efforts have been performed on specified structures subjected to specific loading conditions so their results cannot be generalized to other cases. Although Gani and Légeron [8] have established a relation between the ductility demand of the structures and the force reduction factor based on a comprehensive parametric study, their work was limited to the nonlinear performance of SDOF structures. Yet, little work has been devoted to investigate the inelastic response of MDOF structures under extreme wind events. It is also of importance to pay a special attention to the analysis hypotheses to be used before being involved in extended parametric studies.
To this end, both linear and nonlinear dynamic time history analyses of simplified shear frame structures with one, two, and three degrees of freedom have been carried out. A computer pro-gram was developed in this study adopting Newmark method combined with Newton-Raphson error reduction algorithm to solve the equation of motion. The influence of using an admittance function for evaluating wind forces was studied for both real (hurricanes wind speed measure-ment) and numerically generated wind samples. The prime objectives of this study are: (1) to ex-amine the sensitivity of structure response in term of its ductility demand to different analysis hypotheses (time-step analysis and wind samples durations) and (2) to propose some recommen-dations with respect to the appropriate values to be used in extended parametric studies.
After the description of the model and hypotheses used in this study, a brief presentation into the wind force calculation is given. This paper then presents the main part of the study with re-spect to the impact of both damping and force hypotheses in evaluating ductility demand of structures subjected to wind loading..
2 MODEL DESCRIPTION AND METHODOLOGY
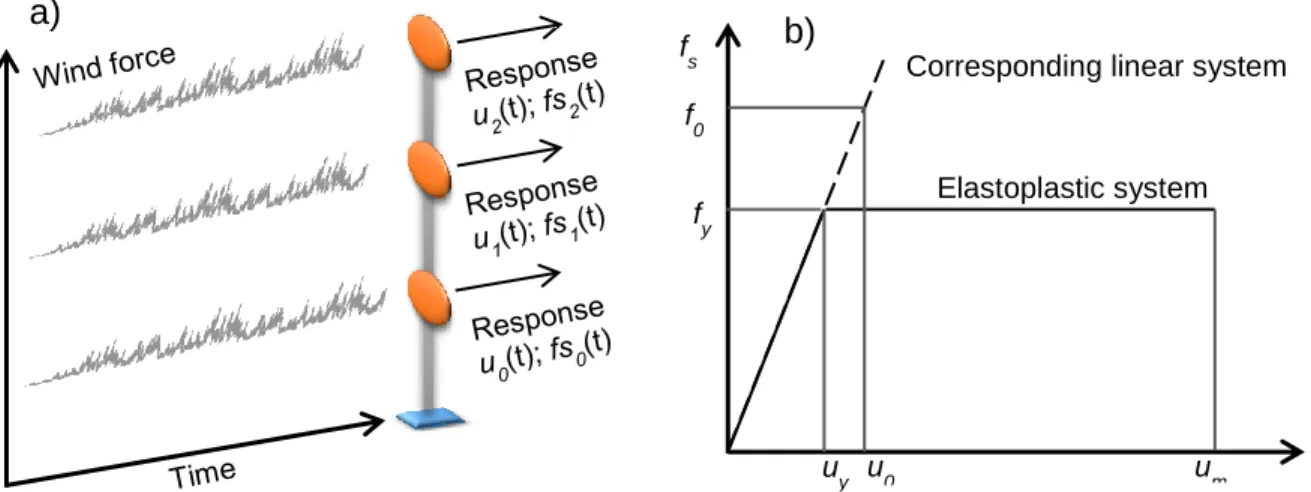
This study investigates the performance of both single (SDOF) and multi (MDOF) (Figure 1a) degree of freedom structures under the action of wind loading applied at the corresponding struc-tural masses. The dimensions (width depth height) of each story are selected, respectively at 25 25 4 m3, while variable stiffness, ki and invariable concentrated mass, m0 of 500 tons are assumed for each story. The structural ductility is defined as shown in Figure 1b by the ratio
µ= um/uy and the strength reduction factor by β= fy/f0; with um being the maximum displacement,
uy being the yield displacement, f0 being the maximum elastic force and fy being the yield strength. When β=1 the system remains elastic; otherwise (0 < β < 1), excursions in the plastic range can be occurred. The nonlinear behaviour of the structure is defined in this study by biline-ar constitutive law with strain hbiline-ardening of 5% and damping of Rayleigh type. Equation of mo-tion was solved using Newmark (average acceleramo-tion) method in conjuncmo-tion with the modified Newton-Raphson iterations.
An iterative design procedure was implemented to control the structural fundamental frequen-cy, f1. First, initial stiffness is assigned for all levels. Then a linear analysis is conducted; using the obtained maximum shear force at each level Vi, a reduction factor is applied to each stiffness level ki as ki’= ki(Vi/ V1). The structure with modified stiffness is then analyzed following the same steps until no significant change in stiffness has been achieved. The use of such procedure is required to insure a rational design for the structure with the same story drift at each level for the specified wind loading sample. The designed structure is then linearly (β=1) and non-linearly (β<1) analyzed according to specified reduction factors where Vy= β V0.
Figure 1. a) The MDOF system under investigation and b) linear and nonlinear constitutive force-deformation rela-tionship (Chopra, 2011).
Table 1. Parameters studied in the analyses.
Parameter Values
Analysis time-step, Δt(s) 0.1, 0.01, 0.001 Wind sample duration (min) 10, 20, 30, 60
Wind force calculation approach quasi-static, admittance Damping, ξ (%) 0, 0.1, 0.2, 0.5, 0.7, 1, 2, 3, 5
In this study, a total of more than 2000 have been analyzed using two different wind force calculation (quasi-static, admittance) approaches considering different values of analysis time-step, wind sample duration, and damping ratios. Table 1shows the different parameters to be evaluated in the context of this study.
3 GENERAL ANALYSIS HYPOTHESES
Although several studies have been documented in the literature pertaining to the nonlinear time history analysis of structures under extreme wind events, there are some important issues that were not explicitly discussed and therefore no conclusive recommendations have been reached. The selection of appropriate time step and wind loading duration are two of these issues that have a direct impact not only on the total analysis executing time but also on the precision of the obtained results. For example, it is customarily adopted that the use of a one hour wind sample in linear or nonlinear analyses of structures would be satisfactory [8,12,22,23,24]. However, there is no a clear justification for this assumption. In fact, it is of importance to pursue the previous assumptions with respect to the selection of the analysis time step and the used wind loading du-ration before starting an extended parametric study.
3.1 Time-step analysis
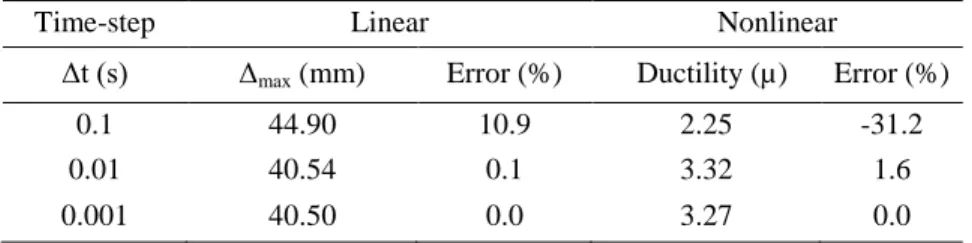
A sensitivity analysis of the appropriate time-step was carried out for both linear and nonlinear structural behavior. Table 2 shows the values of the maximum displacement obtained from linear
Elastoplastic system Corresponding linear system
fs f0
fy
uy u0 um
analyses and ductility demand from nonlinear analyses of 2 DOF structure having f1 =1Hz under the Katrina-2005 wind loading assuming damping ratio, ξ of 1%. Table 2 shows that the error in estimating the maximum displacement between a time-step loading, Δt of 0.1s and of 0.01s in the linear analysis is about 11%. This percentage reaches 30% in nonlinear analysis. The error in predicting the structural deformation if Δt is changed from 0.01s to 0.001s is within 2% for both linear and the nonlinear analyses. Therefore it can be concluded that Δt=0.01s is the optimal time-step to be used for linear and nonlinear analysis.
It should be noted that, because of nonlinear analysis is related to linear analysis (design pro-cedure described above) the same time step must be used for both analysis cases otherwise error on ductility demand reaches 80%.
Table 2. Maximum displacement and ductility demand obtained from linear and nonlinear analyses.
Time-step Linear Nonlinear
Δt (s) Δmax (mm) Error (%) Ductility (µ) Error (%)
0.1 44.90 10.9 2.25 -31.2
0.01 40.54 0.1 3.32 1.6
0.001 40.50 0.0 3.27 0.0
3.2 Wind sample duration
Wind loading duration for numerically generated wind simulating winter storms may not have considerable effect because of the constant mean wind speed in opposition to hurricanes wind speed measurement where intervals covering maximum wind speed may be much longer because of mean wind speed variation (e.g. wind loading duration considered in the case of hurricane Is-abel-2003 is 4 hours). A sensitivity study was carried out for generated wind speed comparing the maximum ductility demand for different wind loading durations (10, 20, 30, 60, 180 min). The obtained results showed that for almost all the cases analyzed (for wind loading with con-stant mean wind speed), no more yielding occurs when approaching 60 min; structures already reached its maximal displacement and behave linearly for the remainder analysis duration. Therefore maximal ductility demand can be obtained form 60 min wind loading sample for gen-erated wind loading. Table 3 shows the error (with respect to the customarily used one-hour wind sample) in predicting the ductility demand obtained from nonlinear analyses of 3 DOF structure having f1 =1Hz assuming damping ratio, ξ of 1% is around 15-25%.
Table 3. Maximum displacement and ductility demand obtained from linear and nonlinear analyses. Duration (min) Ductility (µ) Error (%)
10 5.39 -15.1
20 4.76 -25.1
30 5.72 -9.9
60 6.35 0.0
However, due to stochastic nature of wind loading, structures subjected to generated wind loading will be analyzed under different wind loading samples with the same characteristics to obtain mean response. So the same sensitivity study was established for 10 wind loading samples and it was found that the maximal difference of ductility demand was reduced to 10% which can
be considered satisfactory for this preliminary study. Therefore 10 min samples will be used for different parameter evaluation in this study; but for the extended parametric study 60 min wind loading samples will be used.
4 WIND FORCE CALCULATION
4.1 Wind speed data
In the context of this study, structures will be subjected to both real (hurricanes wind speed measurement) and numerically generated wind samples. Five hurricane wind data sets were pro-vided by Florida Coastal Monitoring Program (FCMP) [2]: Isabel-2003; Ivan-2004; Katrina-2005; Rita-Katrina-2005; and Wilma-2005. Details of these hurricane measurement projects are given in Masters [13]. Wind speed were measured at z = 5 m and z = 10 m simultaneously which permits analyzing single and 2 DOF structures. Numerically generated wind samples were obtained for different turbulence intensity Iu, using WindGen program developed by Hang et al. [10] based on Power Spectral Density (PSD) proposed by Simiu [17] for along wind component. It is to be noted that WindGen generates only turbulent part of wind speed u(t) which must be combined with mean wind speed 𝑈̅ that is set constant at 40 m.s-1 throughout this study.
4.2 Wind force calculation in the literature
4.2.1 Quasi-static wind force
Different wind forces loading on building where used on previous studies. Vickery [23] used a one-hour-sample record obtained from wind tunnel measurements. The other studies [4,8,21,24] used a wind sample numerically generated according to Monte Carlo process. In their calcula-tions, wind forces were calculated adopting the quasi-static approach in which the quasi-static to-tal drag wind force at a given height z and a time t is given by Simiu and Scanlan [18]:
𝐹(𝑧, 𝑡) =12𝜌𝑎𝐶𝑑𝐴[𝑈̅(𝑧) + 𝑢(𝑧, 𝑡)]2 (1)
where ρa is the air density, Cd is the drag coefficient and A is the exposed area to the wind load-ing. For prismatic structures Cd is between 1 to 3 depending on many parameters such as the shape of the structure, the inclination of the wind direction with respect to the surface of the structure, wind turbulence, and the structure dimensions [11]. The drag coefficient Cd is selected at 1 in this study.
4.2.2 Aerodynamic admittance function
Sears [16] theoretically derived the aerodynamic admittance function for lift on thin symmetrical airfoil [3]. Large structure response will be overestimated due to ‘lack of correlation’ [20] which leads to the introduction of the aerodynamic admittance concept by Vickery [22] and Davenport [6] who proposed an empirical aerodynamic admittance function based on experimental data for drag force on square plate. Aerodynamic admittance is used on the frequency domain with spec-tral stochastic approach for structural response estimation through gust factor method which was introduced in design codes [1,7]. The drag wind force on a plate by Vickery [22] can be given as :
𝜒2(𝑓) = ( 1 1+[2𝑓√𝐴 𝑈 ] 4 3) 2 (2)
where f is the frequency, 𝑈 is the mean wind speed and A is the area of the plate. 4.2.3 Indicial function
Indicial admittance function is used in civil engineering applications to evaluate aeroelastic phe-nomena in the time domain for wind sensitive structures. A procedure presented in Chang et al. [3] based on the work of Scanlan [15] to determine indicial functions for slender support struc-tures is used in the current study to evaluate the wind drag force corresponding to the specified aerodynamic admittance function to be used in time history analyses. The derivative of the indi-cial function is given as :
𝜙′(𝑠) = 𝐴
1𝑒−𝐴2𝑠+ 𝐴3𝑒−𝐴4𝑠 (3)
where s is non dimensional time, s=𝑈t/c and Ai are constants. The admittance function is related to the indicial function through: Φ(𝐾) = ∫ 𝜙∞ ′(𝑠)𝑒−𝑖𝐾𝜎𝑑𝜎
0 (4)
Wind force calculation using the admittance function was given in Tamura and Kareem [20] as: 𝐹(𝑧, 𝑡) = 𝐹̅(𝑧) + 𝑓(𝑡) (5) 𝑓(𝑡) = 𝜌𝑎𝐴𝐶𝑑𝑈 ∫ [𝑢(𝑠) − 𝜙0𝑠 ′(𝑠 − 𝜎)]𝑑𝜎 (6) 𝐹(𝑧) =12𝜌𝑎𝐶𝑑𝐴𝑈 2 (𝑧) (7) where s=𝑈𝑡/√𝐴.
4.3 Wind force calculation through indicial function
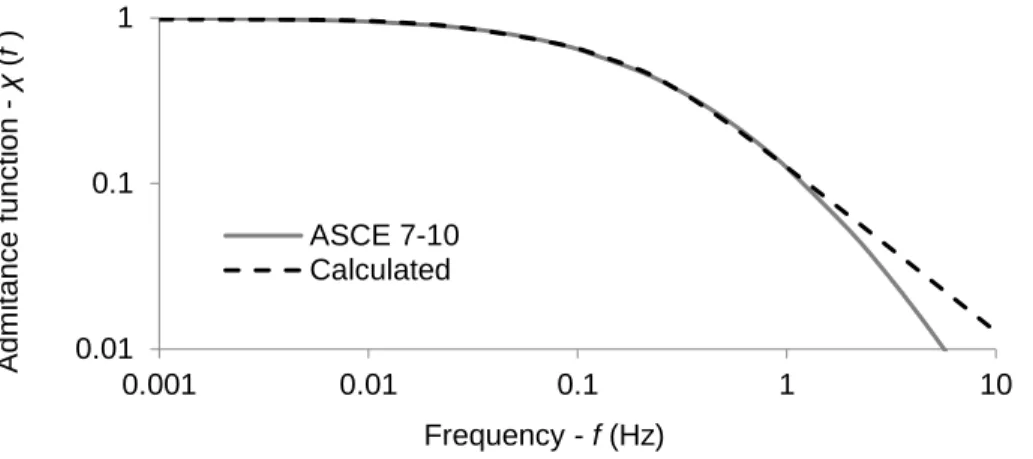
First, the aerodynamic admittance functions given in ASCE7-10 [1] for different structural char-acteristics were calculated. Then using Matlab fitting tools, indicial function constants Ai were identified for each case. The obtained results are summarized in Table 4. Figure 2 shows an ex-ample of the calibration of the indicial function to fit aerodynamic admittance given in ASCE 7-10 [1]. It appears from Figure 2 that there is a certain divergence between the two curves after frequency of 1.0 Hz and admittance less than 0.1 where the wind effects on the structural re-sponse could be neglected.
Figure 2. Admittance function from ASCE 7-10 compared to that calculated using the indicial function.
Table 4. Coefficients of indicial function corresponding to each structure geometry.
N° DOF Height (m) A1 A2 A3 A4
1 4 0.008261 0.0262 0.09176 0.138
2 8 0.008585 0.03096 0.1121 0.1594
3 12 0.00768 0.03161 0.1223 0.1665
4.4 Structural response comparison
Linear and nonlinear responses of structures subjected to wind forces calculated according to quasi-static and admittance approaches were compared in this section. Due to the limitation in space, only the results pertaining to the analyses of a structure (3 DOF; f1=1 Hz; ξ=1%; β=0.8;
Iu=30%) will be presented.
Figure 3 shows that the use of the indicial admittance function significantly reduced (by about 50%) the calculated wind force compared to the one estimated from the quasi-static approach. This reduction in the wind force, therefore, reduces the structural response. In linear analysis, Figure 4 shows that the displacement of the 1st level calculated adopting the indicial admittance function is 60% less the one computed with the quasi-static approach. Nonlinear response, on the other hand, is also noticeably affected by the wind force calculation methods as shown in Figure 5a, b even though the same reduction factor β=0.8 (20% reduction) was applied for both cases with reference to their linear counterparts. The hysteresis loop is larger in the case of aerodynam-ic admittance whaerodynam-ich leads to a higher ductility demand: µ(Quasi-static)=1.35 and µ(Admittance)=5.33
which is equivalent to a 75% underestimation of the ductility demand (Figure 5c). These results imply that, when performing time history analysis of structures under wind loading, ignoring aerodynamic admittance effect could lead to underestimation of the ductility demand. In this study it was decided to use the aerodynamic admittance approach to evaluate wind forces on structures. 0.01 0.1 1 0.001 0.01 0.1 1 10 Adm itanc e func ti on - χ (f ) Frequency - f (Hz) ASCE 7-10 Calculated
Figure 3. Wind force time history from quasi-static and admittance approach.
Figure 4. Linear response (displacement of 1st level) time history for quasi-static and admittance analysis case.
Figure 5. Force-displacement relationships for linear and nonlinear analyses from: a) quasi-static, b) admittance wind force calculation approach, and c) nonlinear analysis only.
-50 0 50 100 150 200 250 0 100 200 300 400 500 600 W ind F orc e (k N) Time (s) Quasi-Static Admittance -0.05 0 0.05 0.1 0.15 0 100 200 300 400 500 600 Inter -s tor y dr if t Δ0 ( m ) Time (s) Quasi-static Admittance -500 0 500 1000 1500 -0.1 0.1 S he ar forc e - V ( k N) a) Quasi-static Linear Non-linear -500 0 500 1000 1500 -0.1 0.1 Inter-story drift - Δ (m) b) Admittance Linear Non-linear -500 0 500 1000 1500 -0.1 0.1 c) Nonlinear Quasi-static Admittance
5 DAMPING EVALUATION
5.1 Recommended damping from literature
Evaluation of damping is very important for vibrating systems. It allows the dissipation of ener-gy and may have an important influence on the response of the structure. There is two main types of damping to be considered for buildings: aerodynamic and structural. They usually act in paral-lel to reduce structural response and total damping is given by:
𝜉 = 𝜉𝑎+ 𝜉𝑠 (8)
where ξ, ξa and ξs are respectively the total, aerodynamic, and structural damping.
5.1.1 Aerodynamic damping
Aerodynamic damping is proportional to the relative speed between building and wind. Its effect appears mainly in flexible structures. Some empirical models are presented in literature to evalu-ate the aerodynamic damping according to several parameters (e.g., shape, dimensions, wind tur-bulence intensity). The aerodynamic damping is usually small for tall buildings (<1%) [21]. This was confirmed in Tamura and Kareem [20] who prescribed that ξa for typical tall building is
about 0.5%.
5.1.2 Structural damping
Structural damping estimation for tall building under wind loading was investigated mainly by Tamura et al. [11,19]. An empirical equation giving the structural damping for steel tall building was established. For large displacement (ultimate limit states), Holmes [11] noted that much higher values may be used for the structural damping but without giving recommended values due to the lack of data measurement. This was confirmed by Tamura and Kareem [20] but they noted that “damping ratio does not necessarily increase at higher amplitude level”. Recom-mended damping ratio to be used was proposed for different structures type and height based on Tamura et al. [19]: 1% for tall steel structure in the elastic range (higher 80 m) and 2% for struc-ture less than 30 m.
5.1.3 Rayleigh damping matrix
Rayleigh damping matrix is commonly used for dynamic analyses [5,14]. Because of its simple mathematical formulation, Rayleigh damping is still the first choice to be used despite it has not a clear physical meaning. However it requires special attention for nonlinear seismic analysis as discussed in Hall [9] which explained through practical examples that damping force can be overestimated when stiffness decreases suddenly which leads to increase the structure velocity and the damping force may reaches high percentage compared to restoring force and even can be greater than it which is not realistic. Consequently it is important to evaluate real amount of damping introduced when performing nonlinear dynamic analysis.
5.2 Sensitivity analysis on damping
Since there is no explicit equations giving total damping for tall buildings under wind loading in the elastic and plastic range, it was pertinent to use a safe amount of damping. In the current analyses, a constant Rayleigh damping was adopted and the effect of aerodynamic damping will be evaluated later in this paper.
5.2.1 Evaluation of the use of Rayleigh damping for nonlinear analysis
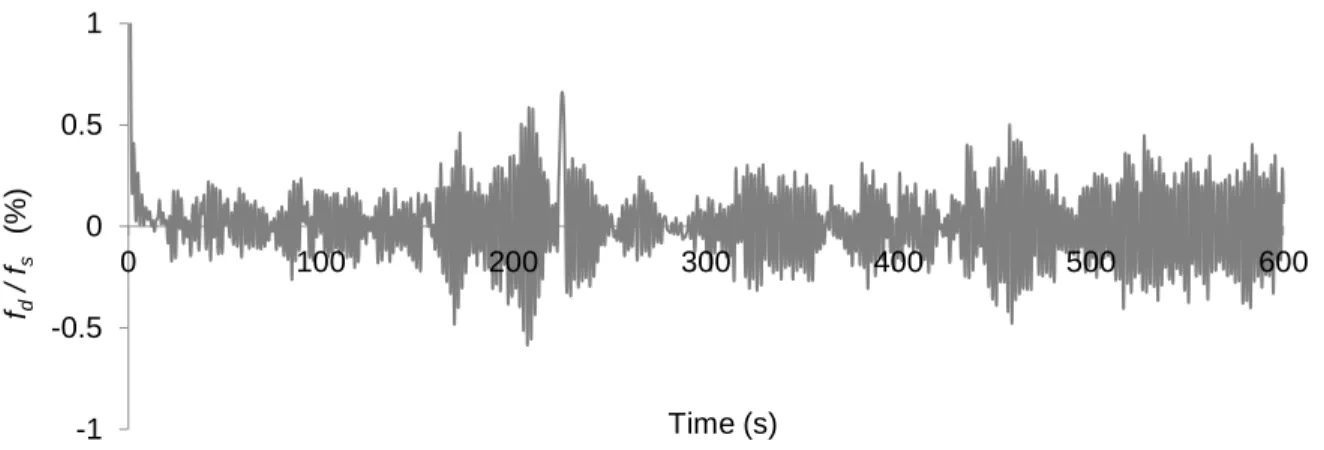
In order to validate the use of Rayleigh damping for nonlinear analysis, the ratio of damping force fd to restoring force fs during nonlinear analysis was examined. For example, as shown in Figure 6 for a SDOF structure (f1=0.5 Hz; ξ=1%; β=0.8) subjected to hurricane wind force from Isabel-2003, it was found that the ratio of damping force to restoring force was less than 0.6% for all the analysis duration. Figure 6 indicates also that the problem of the damping force over-estimation due to stiffness loss is not problematic in the considered cases, and Rayleigh damping can be used without problems even for nonlinear time-history analysis. This can be explained by the presence of mean wind speed which gives a considerable value for restoring force compared to damping force.
5.2.2 Influence of damping on ductility demand
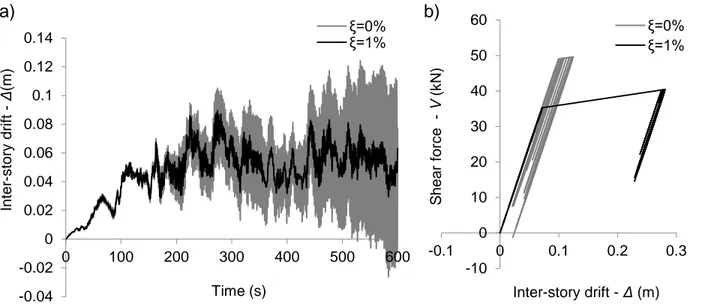
Figure 7a shows the time histories of the inter-story drift from the linear analysis of a SDOF structure (f1=0.5 Hz) subjected to Isabel-2003 wind loading with and without Rayleigh damping (ξ=1%). The displacement was significantly reduced by 40% when 1% of damping was intro-duced. For the nonlinear analysis, the results shown in Figure 7b indicate that the ductility de-mand is increased when 1% of damping was used. In fact, the reduction of maximal shear force in the linear analysis leads also to the reduction of yielding shear forces by the same amount which explain the higher ductility demand when damping amount is greater; due to design pro-cedure, two structures with different yielding shear forces are analyzed. However when specify-ing the same yieldspecify-ing shear force and analyzspecify-ing the same structure with different dampspecify-ing amount, ductility demand becomes greater for lower damping value. Therefore, it can be con-cluded that for nonlinear analysis conducted in this study, the introduction of higher damping amount leads to a higher plastic displacement which means higher ductility demand.
Figure 8a, b shows two different examples of the influence of damping amount on ductility demand for 2 analysis cases; a) 2 DOF structure (f1=1 Hz) subjected to Katrina-2005 wind forc-es; and b) SDOF structure (f1=0.5 Hz) subjected to Isabel-2003. Focusing on the cases where the aerodynamic damping is not accounted for, the damping has a different influence on the ductility demand. Unlike the former case where the damping has a significant effect on the ductility de-mand (Figure 8a), it appears from (Figure 8b), that the damping in the latter has no practical in-fluence on the ductility demand. In Figure 8a, the ductility demand was reduced by 30% when
ξ=0.5% is used and increased by 32% for ξ=2% with respect to the ductility demand at ξ=1%.
All of these results show the importance of the consideration of the right amount of damping when conducting nonlinear time history analysis; under estimating damping amount can lead to underestimation of nonlinear response and damage accumulation.
Figure 6. Ratio of damping force fd to restoring force fs time history
-1 -0.5 0 0.5 1 0 100 200 300 400 500 600 fd / fs (%) Time (s)
Figure 7. a) Linear time history response and b) nonlinear force displacement diagram for ξ = 0 % and 1%
Figure 8. Ductility demand function of damping amount with consideration or not of aerodynamic damping.
5.2.3 Aerodynamic damping evaluation
Because of the sensitivity of nonlinear response of structures under wind events to the used amount of damping as previously demonstrated, the aerodynamic damping was evaluated. To do so, the wind forces acting on the building were calculated based on the relative speed between wind and structure. But due to the excessive calculation time, it was also pertinent to evaluate the amount of aerodynamic damping to be introduced as additional constant Rayleigh damping in addition to structural damping.
As it was shown in Figure 8a, b, for both situations where damping was highly influencing ductility demand or not, the aerodynamic damping effect is insignificant. This permits to neglect
-0.04 -0.02 0 0.02 0.04 0.06 0.08 0.1 0.12 0.14 0 100 200 300 400 500 600 Inter -s tory drif t - Δ (m ) Time (s) a) ξ=0% ξ=1% -10 0 10 20 30 40 50 60 -0.1 0 0.1 0.2 0.3 S he ar forc e - V ( k N) Inter-story drift - Δ (m) b) ξ=0% ξ=1% β=0.9 β=0.8 0 1 2 3 4 5 6 7 0.01 0.1 1 10 Duc ti lity de m an d - µ Damping - ξ (%) a) w/o aero-damp w aero-damp β=0.9 β=0.8 1 2 3 4 5 6 7 0.01 0.1 1 10 Duc ti lity de m an d - µ Damping - ξ (%) b) w/o aero-damp w aero-damp
it and to only consider the recommended structural damping amount ξ=1% in the analyses of high rise buildings. However, it is important to note that the influence of aerodynamic damping may need to be re-evaluated for each analysis of high rise buildings.
6 CONCLUSION
The present study evaluated the influence of different hypotheses on ductility demand for structures subjected to time history wind loading and gives recommendations about adequate values to be used in extended parametric studies. The results presented in this paper lead to the following conclusions :
- Analysis time-step to be used on linear and nonlinear analysis must be the same otherwise error on ductility demand can reach 80%. The optimal recommended time-step to be used is Δt=0.01s which yields an error of less than 2%.
- Wind loading duration influences considerably the ductility demand of structures. In the context of this type of study one hour wind loading samples are sufficient for generated wind loading samples whereas 3 or 4 hours wind loading samples is needed when using hurricane real wind measurement. Ten minute wind loading sample can be used when evaluating influence of different parameters with an error around 15% for only one wind loading sample and 10% for 10 wind loading sample.
- The application of indicial function related to the aerodynamic admittance when calculat-ing wind forces on structures influences significantly the ductility demand compared to the quasi-static approach; the ductility demand may be underestimated by 75%. Therefore, it is recommended to use the aerodynamic admittance approach through indicial function when analyzing nonlinearly structures subjected to wind loading in the time domain.
- Constant Rayleigh damping can be used for nonlinear time history analysis of structures subjected to wind loading without producing excessive damping amount when yielding of structures occurs.
- Damping amount introduced in the analysis may influences significantly the ductility de-mand of structures whereas aerodynamic damping can be neglected in the context of this study; damping amount ξ=1% is the recommended value to be used.
7 ACKNOWLEDGEMENTS
The authors gratefully acknowledge the National Sciences and Engineering Research Council of Canada (NSERC) for this financial support of this research project and also the Fonds de recher-che du Québec sur la nature et les technologies (FRQNT) for the financial support of the Centre d’études interuniversitaire des structures sous charges extrêmes (CEISCE). The authors would like to acknowledge the contribution of the Florida Costal Monitoring Program (FCMP) for providing hurricane wind data sets used in the present study.
8 REFERENCES
2 J. Balderrama, F. Masters, K. Gurley,D. Prevatt, L. Aponte-Bermúdez, T. Reinhold, J.P. Pinelli, C. Subramanian, S. Schiff, A. Chowdhury, The Florida Coastal Monitoring Program (FCMP): a review, Journal of Wind Engi-neering and Industrial Aerodynamics, 99 (2011) 979–995.
3 B. Chang, P. Sarkar, B. Phares, Time-domain model for predicting aerodynamic loads on a slender support struc-ture for fatigue design, Journal of Engineering Mechanics, 136 (6), 2010, 736-746.
4 D. Chen, A. Davenport, Vulnerability of tall buildings in typhoons, In: Advances in Structural Dynamics, 2000, vol. II, pp. 1455–1462.
5 A.K. Chopra, Dynamics of Structures: Theory and Applications to Earthquake Engineering, fourth edition Pren-tice Hall, 2011.
6 A.G. Davenport, Gust loading factors, ASCE J Struct Div 93 (1967) 11–34.
7 NF EN 1991-1-4/A1, Actions sur les structures : Actions générales-Actions du vent, AFNOR, France, 2010. 8 F. Gani, F. Légeron, Relationship between specified ductility and strength demand reduction for single
degree-of-freedom systems under extreme wind events, Journal of Wind Engineering and Industrial Aerodynamics 109 (2012), 31-45.
9 J.F. Hall, Problems encountered from the use (or misuse) of Rayleigh damping, Earthquake Engineering and structural dynamics, 35 (2006) 525-545.
10 S. Hang, F. Gani, F. Légeron, Générateur de vent appliqué au génie civil, Manuel de logiciel, Université de Sherbrooke, 2005.
11 J.D. Holmes, Wind Loading of Structures, third edition CRC Press, 2015.
12 H. Hong, Accumulation of wind induced damage on bilinear SDOF systems, Wind and Structures, 7 (2004) 145–158.
13 F.J. Masters, Measurement, Modeling and Simulation of Ground-level Tropical Cyclone Winds, Ph.D, Thesis, University of Florida, 2004.
14 Paultre, P., 2005. Dynamique des structures, application aux ouvrages de génie civil, Hermes Science/Lavoisier. 15 R.H. Scanlan, Problematic on formulation of wind-force models for bridge decks, Journal of Engineering
Me-chanics, 119 (7), 1993, 1353-1375.
16 W.R. Sears, Some aspects of nonstationary airfoil theory and its practical applications, J Aeronaut. Sci., 8 (1941) 104-108.
17 E. Simiu, Wind spectra and dynamic alongwind response, ASCE Journal of the Structural Division, 100 (1974) 1897–1910.
18 E. Simiu, R. Scanlan, Wind Effects on Structures, third edition John Wiley & Sons Inc, 1996.
19 Y. Tamura, K. Suda, A. Sasaki, Damping in buildings for wind resistant design, In: Proceedings of the interna-tional symposium on wind and structures for the 21st century, 26–28 January 2000, Cheju, 2000, pp 115–130. 20 Y. Tamura, A. Kareem, Advanced Structural Wind Engineering, Springer Japan, 2013.
21 T. Tschanz, The Base Balance Measurement Technique and Application to Dynamic Wind Loading of Structure, Ph.D, Thesis, University of Western Ontario, London, Ontario, 1982.
22 B.J. Vickery, On the flow behind a coarse grid and its use as a model of atmospheric turbulence in studies related to wind loads on buildings, National Physical Laboratory Aero Rep. No. 1143, 1965.
23 B.J. Vickery, Wind action on simple yielding structures, Journal of Engineering Mechanics Division 96 (1970) 107–120.
24 T. Wyatt, H. May, The ultimate load behaviour of structures under wind loading, In: Proceedings of the Third In-ternational Conference on Wind Effects on Buildings and Structures, Tokyo, Japan, 1971, pp. 501–510.