O
pen
A
rchive
T
OULOUSE
A
rchive
O
uverte (
OATAO
)
OATAO is an open access repository that collects the work of Toulouse researchers and
makes it freely available over the web where possible.
This is an author-deposited version published in :
http://oatao.univ-toulouse.fr/
Eprints ID : 10209
To link to this article : doi:10.1016/j.jenvman.2013.04.007
URL : http://dx.doi.org/10.1016/j.jenvman.2013.04.007
To cite this version : Vignati, Davide A.L. and Secrieru, Dan and
Bogatova, Yuliya I. and Dominik, Janusz and Céréghino, Régis and
Berlinsky, Nikolai A. and Oaie, Gheorghe and Szobotka, Stefan and
Stanica, Adrian Trace element contamination in the arms of the Danube
Delta (Romania/Ukraine): Current state of knowledge and future needs.
(2013) Journal of Environmental Management, 125 . pp. 169-178.
ISSN 0301-4797
Any correspondance concerning this service should be sent to the repository
administrator: [email protected]
Trace element contamination in the arms of the Danube Delta (Romania/Ukraine):
Current state of knowledge and future needs
Davide A.L. Vignati
a,b,*, Dan Secrieru
c, Yuliya I. Bogatova
d, Janusz Dominik
a,e, Régis Céréghino
f,
Nikolai A. Berlinsky
d, Gheorghe Oaie
c, Stefan Szobotka
c, Adrian Stanica
caInstitut F.-A. Forel, Université de Genève, CP 416, 1290 Versoix, Switzerland
bLIEC, CNRS UMR 7360, Université de Lorraine, Campus Bridoux e Bât. IBISE e 8, rue du Général Delestraint, 57070 Metz, France cNational Institute of Marine Geology and Geoecology e GeoEcoMar, 23-25 Dimitrie Onciul Street, 024053 Bucharest, Romania dResearch Center (RC) Noosphera, Primorskaya St. 31/1, Odessa 65026, Ukraine
eISMAR-CNR, Arsenale Tesa 104, Castello 2737 F, I-30122 Venice, Italy
fEcolab, Laboratoire Ecologie Fonctionnelle et Environnement, UMR 5245 UPS-CNRS-INPT, Université de Toulouse, 118 route de Narbonne, 31062 Toulouse cedex 4, France
Keywords: Danube Delta Trace elements Sediments Contamination Baseline metals Self-Organizing Maps
This paper provides the first critical synopsis of contamination by selected trace elements in the whole Danube Delta (Romania/Ukraine) to: identify general patterns of contamination by trace elements across the Delta, provide recommendations to refine existing monitoring networks and discuss the potential toxicity of trace elements in the whole Delta. Sediment samples were collected between 2004 and 2007 in the three main branches of the Delta (Chilia, Sulina and Sfantu Gheorghe) and in the secondary delta of the Chilia branch. Samples were analyzed for trace elements (Cd, Co, Cr, Cu, Ni, Pb, V, and Zn) and TiO2,
Fe2O3, MnO, CaCO3and total organic carbon. Cluster analysis (CA) and Principal Component Analysis
(PCA) showed that levels of Cd, Cu, Pb, and Zn were influenced by anthropogenic activities. At the opposite, concentrations of Cr and Ni largely originated from the weathering of rocks located in the Romanian part of the Danube catchment and naturally rich in these elements. Data analysis using Self-Organizing Maps confirmed the conclusions of CA/PCA and further detected that the contamination tended to be higher in the Chilia and Sulina arms than in the Sfantu Gheorghe arm. The potential ecological risks due to trace element contamination in the Danube Delta could be identified as moderate and localized, provided that the presence of the natural sources of Cr and Ni was properly considered. The available results suggest that monitoring sediment quality at the mouths of Sulina and Sfantu Gheorghe arms is probably enough to get a picture of the sediment quality along their entire lengths. However, a larger network of monitoring points is necessary in the Chilia and secondary Chilia delta to account for the presence of local point sources and for the more complex hydrodynamic of this part of the Danube Delta.
1. Introduction
The Danube River flows for 2857 km through ten countries (Germany, Austria, Slovakia, Hungary, Croatia, Serbia, Bulgaria, Romania, Moldavia and Ukraine) across half of Europe. Its watershed area of 817,000 km2 spreads over 19 European countries and is inhabited by more than 81 million people. It is also the major source of freshwater, nutrients and pollutants to the Black Sea whose coastal
zone is inhabited by at least 20 million people (up to 40 million if the area of Istanbul e Turkey e is included in the computation).
The Danube Delta begins at Ceatal Izmail (ceatal being a Turkish word for ‘bifurcation’), at Mile 44 from the river mouth, where the Danube divides into two branches: Chilia (going to the North) and Tulcea (going to the South). At Mile 34, the Tulcea branch further divides into Sulina branch to the North and Sfantu Gheorghe branch to the South (Fig. 1a). The two latter branches are entirely on Romanian territory, while Chilia represents the country border between Romania and Ukraine. The Sulina branch has been heavily modified by human activities (Stanica et al., 2007) and is now highly regulated and dedicated to commercial navigation. The Sf. Gheorghe has remained in a more undisturbed state although it was gradually straightened for navigation purposes in the 1980s.
* Corresponding author. Present address: LIEC, CNRS UMR 7360, Université de Lorraine, Campus Bridoux e Bât. IBISE e 8, rue du Général Delestraint, 57070 Metz, France. Tel.: þ33 3 87 37 84 42; fax: þ33 3 87 37 85 12.
E-mail address:[email protected](D.A.L. Vignati).
The Chilia branch, at about 18 km from the river mouth, forms the secondary Starostambulsky (or Chilia) delta which, except for the Starostambulsky arm (Fig. 1a), is entirely located in the Ukrainian territory (Tudorancea and Tudorancea, 2006).
Extensive characterization of bed sediments along the whole course of the Danube River was carried out in 2001 and 2007 by the International Commission for the Protection of the Danube River (ICPDR) (Woitke et al., 2003;ICPDR, 2008). However, these surveys included only three sites in the Danube Delta, a UNESCO World Natural Heritage and Ramsar site covering about 5800 km2 un-equally distributed between Romania and Ukraine. Other studies with a more detailed resolution and examining pollution by trace elements in the Danube Delta are, to date, scarce and localized.
Most investigations have been limited to the Romanian or Ukrainian part of the Delta (Burgess et al., 2009,2011;Oaie et al., 1997,2005), to some important aquatic depressions of the Delta (Friedrich et al., 2003;R!adan et al., 2000;R!adan and R!adan, 2004), to the marine area located in front of it (Secrieruet al., 2006), or to critical stretches of the Danube (Bird et al., 2010;Mila"ci"c et al., 2010). A special issue of the journal Estuarine Coastal and Shelf Science (volume 54, 2002) provided a wealth of information on various themes, but no overall characterization of the sediments from the whole Delta. Studies simultaneously covering the whole Danube Delta are necessary to highlight general contamination patterns by trace elements in this morphologically and hydrody-namically complex region.
This work, stemming from an international networking effort sponsored by the Swiss National Science Foundation, presents a synthesis of several unpublished monitoring data produced by Romanian and Ukrainian research bodies and has four major objectives:
a) identify general distribution patterns for trace elements (Cd, Co, Cr, Cu, Ni, Pb, V, Zn) and sediment characteristics (TiO2,
Fe2O3, MnO, CaCO3, total organic carbon) across the entire
Danube Delta,
b) provide recommendations, based on the identified patterns, for refining existing monitoring networks,
c) discuss the potential toxicity of trace elements across the whole Danube Delta,
d) highlight some geochemical peculiarities (i.e., elevated back-ground levels of Cr and Ni) of Danube Delta sediments and their implication for toxicity evaluation.
2. Material and methods 2.1. Sampling
Samples were collected during various projects using method-ologies routinely adopted by the various parties (Table 1). The aims of the campaigns were varied (e.g., regular monitoring projects, specific investigations, follow-up of major engineering works), but
Fig. 1. Panel A: Satellite view of the Danube Delta area with indication of the 3 main branches (Chilia, Sulina, and Sfantu Gheorghe), of the beginning of the Danube Delta and of the sampling sites monitored by Romanian partners on different occasions in 2004e2007. Panel B: Expanded map of the Chilia branch and secondary delta with sampling sites (numbers 1e26) visited by Ukrainian partners in May 2004. The two major settlements of the area (Chilia city and Vilkovo town) are indicated along with the Bystroe arm, the Starostambulsky branch and some other additional key information. Refer toTable S1in the supporting information for more details on the sampling sites.
a number of core analytes was common to all studies (Table 1) and provided the basis for the first overall evaluation of element contamination and associated sediment characteristics in the entire Danube Delta.
Samples in the Ukrainian part of the Delta were collected in May 2004 by the Research Center Noosphera (RCN, Odessa, Ukraine) during the dredging works leading to the (re)opening of the Bystroe Canal later that year (Schiermeier, 2004). Sampling operations were carried out in cooperation with Delta Pilot State Enterprise at the sites requiring dredging for navigational purposes and at the ma-rine dumping and control sites. At rivema-rine locations (Fig. 1b), sediment cores (upper 20 cm) were taken at about 300 m from the banks in large channels or in the middle of the smaller channels. At coastal/marine locations, samples were collected using a grab sampler with an area of 0.1 m2.
In the Romanian part of the Delta, surface sediments samples were collected by GeoEcoMar during various monitoring cruises in 2004e2007 (Table 1) on board of R/V Istros using a Van Veen grab and a Kullenberg gravity corer. Each transect (Fig. 1a) consisted in 1e3 sampling stations, with two samples close to the river banks and one in the middle of the riverbed when possible. Subsamples for the different analyses were collected from the primary grab samples and stored under suitable conditions. Samples from earlier campaigns (1995e1997) were collected with the same techniques and, being previously unpublished, will be presented to evaluate the temporal evolution of sediment contamination (see Section
3.5).
2.2. Chemical analysis
Wet aliquots of the samples collected in May 2004 in the Ukrainian part of the Delta were shipped by international express carrier to the Institute F.-A. Forel (IFAF). The analytes of interest were assayed following procedures described elsewhere (Vignati et al., 2003andTable 1). Sediment water content was determined on independent sediment aliquots and all data are expressed on a dry weight basis. For comparison purposes with data produced by GeoEcoMar (see below), loss of ignition (LOI) was transformed into total organic carbon (OC) dividing by the conversion factor of 14.9 established bySutherland (1998), while CaO analysis by XRF where converted to CaCO3by multiplying by 1.79.
Sediments samples collected in Romania by GeoEcoMar were air dried and grounded until all the material passed through a 0.032 mm mesh sieve. Total Organic carbon (OC) and CaCO3were
analyzed by titration according toGaudette et al. (1974)andBlack (1965), respectively. Aliquots of sediments were mineralized in open beakers by boiling with concentrated nitric acid (z140 C for 8 h;Jickells and Knap, 1984). The residue was evaporated to dry-ness, re-dissolved in diluted hydrochloric acid, quantitatively transferred to 50 ml volumetric flask and brought to 50 ml with ultrapure water. Trace elements were assayed by flame atomic
absorption e FAAS (Co, Cu, Ni, Pb, and Zn) or electrothermal atomic absorption e ETAAS (Cd) on a Pye Unicam SOLAAR 939E double beam absorption spectrophotometer with deuterium lamp back-ground correction.
The analysis of Fe2O3, TiO2, MnO, Cr, and V were performed by
X-ray fluorescence spectroscopy on a VRA e 30 XRF sequential spectrometer, fitted with an X-ray tube with W anode, directly on compacted powders. An analyzer crystal LiF 200 was used to select the characteristic wavelengths, measurements being done with a Na(Tl)J scintillation detector. Calibration was carried out with in-ternational standards kindly provided by US Geological Survey, the National Institute of Standards and Technology e USA and the National Research Council e Canada, using the relationship be-tween concentration and the difference bebe-tween the number of impulses recorded at the analytical line and the number of im-pulses at the background line.
2.3. Data presentation and statistical analysis
Raw results for all available samples are reported inTable S1of the supporting information along with details on sampling loca-tions. All data were centered and reduced before the analysis (Davis, 1986) and three different approaches were used to identify general patterns of sediment contamination across the Danube Delta: Cluster Analysis (CA), Principal Component Analysis (PCA), and Self Organizing Maps (SOM). CA and PCA were performed using Statistica
version 7. For R-mode and Q-mode cluster analysis, Euclidean distances and agglomerative hierarchical analysis ac-cording to Ward’s method were employed for clustering variables or sites. Self Organizing Maps were built using the SOM Toolbox version 2 for Matlab
(Vesanto et al., 1999). Temporal differences between 2004e2007 and 1995e1997 data sets were evaluated using the WilcoxoneManneWhitney test.
3. Results and discussion 3.1. Quality assurance
At IFAF, reproducibility between duplicate sample digestions was generally better than 15%. Element recovery from certified material STSD-2 and STSD-3 (Lynch, 1990) were between 80 and 120% for 3 replicates of each material. The sum of major elements obtained from X-ray analysis was generally higher than 98.5% for samples and 99e100% for standard materials W2 (Diabase, from USGS), DR-N (Diorite) and Br (Basalt) both from the Center de Recherche Pétrographiques et Géochimiques, Vandoeuvre les Nancy, France.
At GeoEcoMar, quality control was performed using reference material BCSS-1 (Marine sediment) from the National Research Council of Canada for both XRF and AAS. Measurements’ repro-ducibility, expressed as the coefficient of variation for six
Table 1
Synopsis of the sampling and analytical activities performed in the Danube Delta by participant institutions. Refer to Section2.1for sampling procedures and to Section2.2for methodological details. LOI, loss on ignition; OC, total organic carbon; RCN, Research Center Noosphera (Odessa, Ukraine).
Sampling period N. of samples Sampling area Methods Analytes Involved institutions
May 2004 26 Ukraine:
Chilia branch, Chilia secondary delta, Coastal zone
ICP-MS XRF LOI
Cd, Co, Cr, Cu, Ni, Pb, V, Zn CaO, Fe2O3, MnO, TiO2
LOI
RCN (sampling), IFAF
and University of Lausanne (analysis)
2004e2007 65 Romania: Chilia branch Sulina branch Sf. Gheorghe GFAAS FAAS XRF Titration Cd,
Co, Cu, Ni, Pb, Zn Fe2O3, MnO, TiO2, V, Cr
OC, CaCO3
GeoEcoMar
independent determinations, was better than 10%. Percentage el-ements’ recoveries varied from 85 to 90% for V and Cr to 100.5e 108% for the remaining elements.
Besides the proficiency of individual laboratories, it is important to appreciate the possible effects of the different preparation and digestion procedures on the measured metal content and hence on the overall discussion of the results. Considering the typical results of sequential extraction procedures (Bacon and Davidson, 2008), over 80% of Cd, Cu, Pb, and Zn can be mobilized following digestions with diluted acetic acid, hydroxylamine chloride (pH ¼ 1.5) and a mixture of H2O2and ammonium acetate at pH around 2e3. These
extraction steps are milder than the strong procedures used at GeoEcoMar and are comparable with that used at IFAF. In practice, differences due to extraction procedures for Cd, Cu, Pb, and Zn should not exceed 20%. In the case of Cr and Ni, sequential extraction techniques do point to a larger ‘residual fraction’ of these elements. However, comparison of all available data for Cr and Ni (seeTable S1, supporting information) does not reveal systematic differences between analyses performed at IFAF and GeoEcoMar. We further acknowledge that differences in grain size and OC content of the available samples can modify the efficacy of metal extraction from sediments. Harmonization of pretreatment and digestion procedures will clearly be beneficial for improved monitoring of sediment contamination by trace elements in the Danube Delta. However, based on the above considerations, com-parison of the results obtained from different institutions involved in this study (Table 1) remains meaningful despite the methodo-logical differences.
3.2. General patterns: cluster analysis and principal component analysis
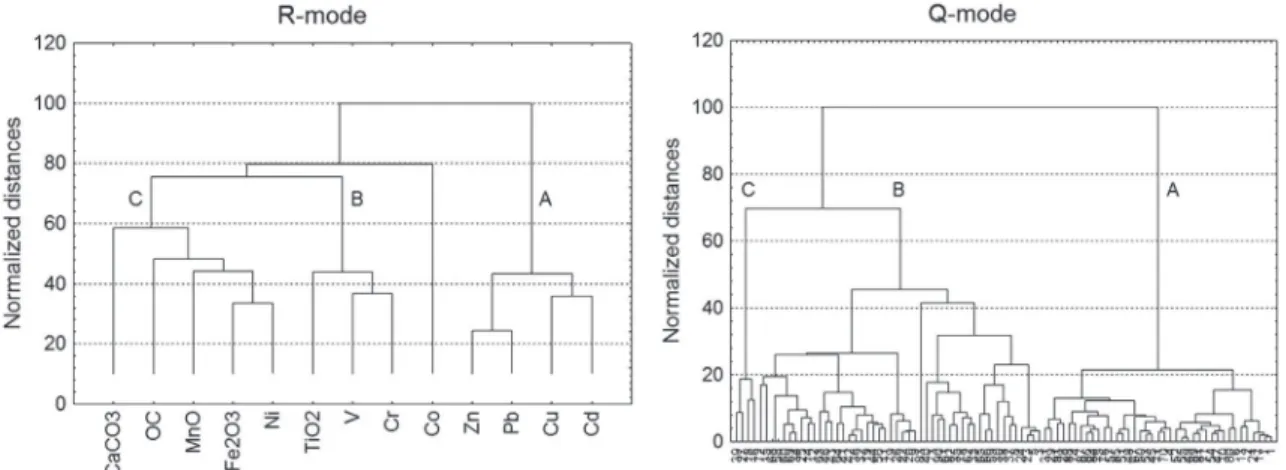
These multivariate techniques were applied on data from 91 samples collected in 2004e2007. R-mode cluster analysis (CA) showed a net separation between Cd, Cu, Pb and Zn and the other parameters (Fig. 2). Cluster A identifies elements that are most influenced by anthropogenic activities and exhibit occasionally high levels at various sites across the Delta (seeTable S1, supporting information for details). Cluster B groups V and Cr with TiO2,
sug-gesting an eminently natural origin of these elements in association with peculiar rock types in the Danube basin (see Section3.4for further discussion). Cluster C includes Ni and several potential carrier phases (CaCO3, OC, Fe2O3and MnO) whose occurrence in
the Delta is probably controlled by various factors such as the relative contribution of detrital material originating from different parts of the basin. The association of Ni with Fe also points to a principally natural origin of this element in Danube sediments (see Section3.4).
In Q-mode CA (Fig. 2), only cluster C containing samples 16, 18, 27, and 39 (see Table S1) could be clearly identified. All these samples came from Chilia arm and were from locations 16 and 18 in
Fig. 1b and K115 (site 27) and K3 (site 39) inFig. 1a. These samples showed a degree of contamination much higher than all the others available in this study. All other observations were assigned to clusters A and B without any clear separation among samples from the 3 main branches or from the secondary Chilia delta, suggesting a complex within-delta dynamics of sediment transport via the network of delta lakes and secondary branches (Coops et al., 2008). In principal component analysis (PCA), Cd, Cu, Pb, and Zn showed strong loadings on factor number one and slightly positive loadings of factor number 2; while TiO2, Cr, and V scored strong on
factor number 2 (Fig. 3). Interestingly, organic carbon, Fe2O3, MnO,
and Ni scored high on factor number 1, but slightly negative on factor 2 (Fig. 3). This pattern points to a certain association between the two groups of variables that could not be captured by cluster analysis. In particular, this indicates that OC, Fe and Mn likely act as carrier phases for Cd, Cu, Pb, and Zn or that the two groups of variables have a common origin. Considering that the two groups are associated on axis 1 (anthropogenic influence), but separated on axis 2 (natural factors) (Fig. 3), the first hypothesis is more likely. Co also showed an association with Ni and Fe2O3on factor 3 (data
not shown), while CaCO3remained essentially separate from all
other variables on the first 3 principal components. In total, the first 3 components explained about 57% of the total variance. Factors 4 and 5 also had Eigenvalues higher than 1 and satisfied the Kaiser criterion for inclusion in PCA analysis. However, the corresponding Eigenvalue scree plot (Fig. S1, supporting information) showed that the decrease of Eigenvalues leveled off after factor 3 and, consid-ering that no definite interpretation could be given for factors 4 and 5, the main pattern underlying PCA is probably captured by the first three components.
Finally, PCA could not clearly group sites based on their geographical location (Fig. 3) and confirmed the results of CA by identifying the contaminated sites 16, 18, 27, and 39 (see above). Furthermore, sample 64 (site S72), 38 (site K20) and 40 (site K3) were also separated from the big cloud of points at the intersection
Fig. 2. Results of R-mode and Q-mode cluster analysis performed on 91 samples collected across the Danube Delta in 2004e2007. Agglomerative clustering was performed using Euclidean distances followed by amalgamation according to Ward’s method. Refer to text for interpretation of clusters A, B, and C.
of axes 1 and 2. Sample 64 corresponds to another case of contamination, likely due to the activities of the port of Sulina city. Samples 38 and 40 represent clean sediments at sites K20 and K3, respectively (Fig. 1a). The occurrence of both contaminated and clean material at site K3 is easily explained by the location of Vil-kovo town that directly influences sediment quality on the left bank of the Chilia arm and much less on its right bank (see alsoTable S1). 3.3. General patterns: self organizing maps
The strengths of the SOM in comparison with conventional multivariate analyses were discussed inGiraudel and Lek (2001). Combining ordination and gradient analysis functions, the SOM is convenient to visualize high-dimensional data in a readily inter-pretable manner without prior transformation. The SOM algorithm is an unsupervised learning procedure that transforms multi-dimensional input data into a two-multi-dimensional map subject to a topological (neighbourhood preserving) constraint (Kohonen, 2001). The SOM thus plots the similarities of the data by grouping similar data items together onto a 2D-space (visualized as a grid) using an iterative learning process that was detailed inPark et al. (2003). The SOM algorithm is specifically relevant for analyzing sets of variables that vary and co-vary in non-linear fashions and/or have skewed distributions. Additionally, the SOM algorithm averages the input dataset using weight vectors through the learning process and thus removes noise. A full description of the modeling procedure employed here (training, map size selec-tion, number of iterations, map quality measurements) was detailed inPark et al. (2003)andCéréghino and Park (2009).
The structure of the SOM for this analysis consisted of two layers of neurons connected by weights (or connection intensities): the input layer was composed of 13 neurons (one per chemical vari-able) connected to the 91 samples from 2004 to 2007 and the output layer was composed of 50 neurons visualized as hexagonal cells organized on an array with 10 rows and 5 columns. The number of 50 output neurons was retained after testing quantiza-tion and topographic errors (Céréghino and Park, 2009). At the end of the training, each sample is set in a hexagon of the SOM map. Samples appearing distant in the modeling space (according to the chemical variables used during the training) represent expected chemical differences for real environmental characteristics.
A k-means algorithm was applied to cluster the trained map (Ultsch, 1993). The SOM units (hexagons) were divided into clusters according to the weight vectors of the neurons and clusters were
justified according to the lowest Davis Bouldin Index (Table 2), i.e., for a solution with low variance within clusters and high variance between clusters (Negnevitsky, 2002). In order to analyze the contribution of chemical variables to cluster structures of the trained SOM, each input variable calculated during the training process was visualized in each neuron (hexagon) of the trained SOM in gray scale. This visualization method directly describes the discriminatory powers of input variables in mapping (Kohonen, 2001).
SOM for individual variables (Fig. 4) confirm the results of cluster analysis and PCA by highlighting the similarities in map structures for Cd, Cu, Pb, and Zn; but also highlight additional el-ements such as the complex relationships between Cr vs. TiO2þ Fe2O3and Ni vs. Fe2O3. Furthermore, SOM allows a better
overview of how the different sediments characteristics are re-flected across sites with e.g., Fe2O3increasing from top to bottom of
the map and OC increasing from upper left to lower right. Joint examination of SOM for individual variables and the SOM for clustered sites (Fig. 5) provides important additional clues that could not be solved with CA of PCA.
Cluster F, containing the most contaminated sites (Fig. 5), is expanded to include samples number 11 (Fig. 1b), 64 (collected at S72,Fig. 1a), and 79 (collected at SG 107,Fig. 1a). Sites in the sec-ondary Chilia delta are grouped in clusters B and D and, except for 5 samples out of 31, separated from sites in the Sulina and Sfantu Gheorghe branches. This clustering suggests that the secondary Chilia delta responds to factors controlling the general behavior of the main branches, but also to other factors, e.g., marine influence or local sources, that are peculiar to this part of the Danube Delta. Except for sample 73, all samples belonging to Sulina branch are grouped in cluster E and F (Fig. 5) where Fe2O3, MnO and OC are
higher than elsewhere. Otherwise stated, the Sulina branch, which has been heavily modified to accommodate the transit of large ships, is distinct from Chilia and Sfantu Gheorghe. Finally, with the exception of sample 79, all Sfantu Gheorghe samples are in clusters
Fig. 3. Results of Principal Component Analysis performed on 91 samples collected across the Danube Delta in 2004e2007. Only samples clearly distinct from all others are identified by their corresponding number in the right panel (see text andTable S1for details).
Table 2
Davies Bouldin Index (DBI) of k-means clustering at different numbers of clusters on the trained Self-Organizing Map (SOM). The retained number of clusters was justified according to the minimum DBI.
Number of clusters
2 3 4 5 6 7 8
A, C and (two samples) B. These clusters include the sites with the lowest level of contamination for the anthropogenically impacted elements Cd, Cu, Pb, and Zn (Fig. 5).
Overall, SOM points to the possibility of occasionally encoun-tering moderately contaminated samples in all parts of the Danube Delta; with the majority of them being located in the Chilia and Sulina arm. Sfantu Gheorghe remains a relatively uncontaminated part of the Delta (at least in the period of observation); while sites in the secondary Chilia delta (clusters B and C) are distributed along a contamination gradient reflecting the occurrence of local pollution sources or factors favoring contaminant accumulation such as OC (Fig. 4) or, possibly, sediment grain size (not analyzed in this study). From the management point of view, monitoring of Sulina and Sfantu Gheorghe at the beginning and at the end of their courses is probably sufficient to characterize their overall contamination; although additional areas of sediment accumulation should also be considered. On the other hand, the monitoring network for the Chilia branch and the secondary Chilia delta must be more complex to account for possible local contamination sources.
3.4. Potential toxicity of trace elements in Danube sediments: geogenic origin of Cr and Ni
The Probable Effect Concentration Quotient (PEC-Q) approach (Long et al., 2006) allows an overall evaluation of the possible risk
posed by the simultaneous presence of several trace elements. PEC-Q is expressed as: PEC " Q ¼ Pn i ¼ 1 ½Me$i PECi n (1)
where [Me]iis the concentration of the ith element measured in the
sample, PECiis the corresponding PEC value (Table S2, supporting
information), and n is the total number of elements which have been measured and for which PEC values are established. While PEC-Qs remain empirically based guidelines, they are superior to comparison among measured concentrations and PEC for individ-ual elements because they account for possible additive contribu-tion to sediment toxicity.Long et al. (2006) report two critical figures for PEC-Qs: 0.25 and 0.34. The former identifies situations where the percentage incidence of toxicity exceeds 20% in labora-tory toxicity tests with marine (i.e., Ampelisca abdita and Rhepox-ynius abronius) or freshwater (i.e., Hyalella azteca) organisms. The latter points to sites where reduction in the abundances of am-phipods, gastropods, and capitellid polychaetes as well as total abundance of benthic organisms are likely to be observed.
Calculations of PEC-Q for samples collected in 2004e2007 (Table 1) according toFormula 1result in about 75% of the exam-ined samples exceeding the threshold value of 0.25 and approx. 35% above the value of 0.34 (Fig. 6). These percentages would indicate a
Fig. 4. Gradient analysis of each variable on the trained self-organising map, with visualization in shading scale (dark ¼ high values, light ¼ low values). Each small map rep-resenting one variable can be compared to (or superimposed on) the map reprep-resenting the distribution of samples shown inFig. 5.
very widespread risk of adverse effects of metal contamination in the Danube Delta. However, high PEC-Q values are mostly deter-mined by the high Cr and Ni content of the sediments (Fig. 6). Consequently, the scenarios for the potential ecological risks due to trace element contamination in Danube Delta sediments vary considerably depending on the inclusion or exclusion of these el-ements in the calculations.
Available knowledge actually supports the hypothesis of an eminently natural origin of Cr and Ni in the Danube sediments. Ultramafic rocks with very high Cr content in association with TiO2
are present in the Iron Gates area (800 km upstream from the Delta). In these rocks, Cr is mainly associated with TiO2; which
agrees with the results of our PCA (Fig. 2). Another major natural source of Cr and Ni (in association with Fe) is the Central Dobrogean right bank of the Danube (Oaie et al., 2005). In this area, the river crosses for many kilometers a zone of outcropping green schysts; pre-paleozoic sedimentary rocks (former grainstones) subject in time to a process of anchimetamorphism. Finally, the workshops and factories using Cr and/or Ni along the Romanian and Bulgarian banks of the Danube (e.g., light industry and skin processing) have all been closed for many years. A correct understanding of Cr and Ni
toxicity in Danube Delta sediments must therefore take into ac-count the high background levels of these elements.
To apportion Cr and Ni content between natural and possible anthropogenic sources we followed an approach similar to that described by Secrieru and Secrieru (2002). A robust MM linear relationship was developed between Cr vs. TiO2and between Ni vs.
Fe2O3. The choice of the carrier phases for Cr and Ni was made
following the results of principal component analysis (Fig. 3). A robust MM linear regression in essentially analogous to the wide-spread Least Square Method, but uses an estimator that is much less influenced by outliers and anomalies in data distribution. The resulting models were:
Cr ¼ ð75:6 & 1:7ÞTiO2
with a proportion of explained variance of 0.83; and Ni ¼ ð8:9 & 0:21ÞFe2O3
with a proportion of explained variance of 0.78. Chromium and Ni concentrations were in mg kg"1, while Fe
2O3and TiO2levels were
expressed as percentage content. Inclusion of MnO, LOI or CaCO3in
the Ni regression (see PCA) did not increase proportion of variance or improved model predictions presented above.
Modeled values were within &25% of measured ones in 62 out of 91 cases for Cr and in 72 out of 91 cases for Ni (Fig. S2, supporting information), with discrepancies larger than 40% being limited to 5 cases for Cr and 11 cases for Ni. From an environmental point of view, positively biased modeled results are of no concern because actual concentrations are lower than predicted ones. This type of discrepancies can be explained by the presence of other phases (such as CaCO3or SiO2) that have low Cr/Ni content. On the other
hand, negatively biased results indicate situations of potential anthropogenic contamination above the background level. In these cases, assuming that modeled results represented natural back-ground values, the excess Cr or Ni remained below 50% of the corresponding PEC values of 111 and 48.6 mg kg"1, respectively.
These results imply that: Cr and Ni in the Danube Delta sediments have a strong geogenic component, Cr and Ni would contribute only marginally to sediment toxicity, site-specific sediment quality criteria (or appropriate corrections for existing one) are required to properly evaluate Cr and Ni toxicity in the Danube Delta.
We acknowledge that the origin of an element is immaterial for its toxicity, which is controlled by its bioavailability. In the Sava River, the major tributary of the Danube, Cr and Ni have high concentrations, but low extractabilities in acetic acid (<0.3% for Cr and <16% for Ni) and thus present a low environmental risk (Mila"ci"c et al., 2010). The Sava joins the Danube upstream from the Iron Gates and therefore has a minor impact on Danube Delta sediment composition. However, the Sava is impacted by mining activities and can represent a reasonable worst case scenario for Cr and Ni toxicity. Albeit data on metal mobility in the Danube Delta will have to be produced, current knowledge supports evidence for a limited and localized risk from Cr and Ni in the Danube Delta.
Excluding Cr and Ni from PEC-Q calculations yields a much less worrying situation with only 4 samples exceeding the 0.34 criterion and an additional 4 exceeding the 0.25 criterion. These samples correspond to sites 16 and 18 inFig. 1b (Chilia secondary delta) and to samples 27 (site K115) and 3 (site K3) in the Chilia arm (Fig. 1a). Pollution at site 18 can be explained by the presence of a cardboard and paper factory located a few km upstream and that was in operation in Izmail at the time of sampling (ICPDR, 2005; annex 4). Occasional high contamination at sites K115 and K3 (Fig. 1a) likely reflects the presence of a big underwater dam creating a zone of preferential deposition at K115 and of the city of Vilkovo at K3. No
Fig. 5. Distribution of samples on the Self-Organising Map (SOM) according to measured values for 13 variables and clustering of the trained SOM. Samples that are neighbours within clusters are expected to have similar characteristics in terms of trace element content and TiO2, Fe2O3, MnO, CaCO3and OC levels. Samples separated
by a large distance from each other, according to input variables, are distant in the output space. Clusters AeF were derived from the k-means algorithm. Codes (1e91) correspond to samples as follows: 1e26, Chilia and secondary Chilia delta (Ukraine, May 2004); samples 27e55, Chilia arm (Romania, 2004e2007); samples 56e62, Tulcea arm (Romania, 2004e2007); samples 63e74, Sulina arm (Romania, 2004e2007); samples 75e91, Sf. Gheorghe arm (Romania, 2004e2007). Refer toTable S1in the supporting information for more details.
specific local inputs are known for site 16 (Fig. 1b) and pollution probably comes from diffuse sources or from local features creating conditions for contaminant deposition. The additional four samples exceeding the 0.25 criterion were sample 9 in the Chilia arm and 26 at sea (Fig. 1b), sample 64 in the Sulina branch (site S72,Fig. 1a) and sample 79 in the Sfantu Gheorghe arm (SG 107,Fig. 1a). The pres-ence of Sulina port explains the increased element levels at site S72, while the exact sources at site 9, 26 and SG 107 have not yet been identified.
The PEC-Q analysis suggests that, at present, ecological risks due to trace element contamination in the Danube Delta are moderate and localized, although we lack information on As and Hg; two other elements for which PEC criteria exist, but which were not system-atically analyzed in this work. Our conclusions agree well with the results ofBurgess et al. (2011)who demonstrated the bioavailability of sediment-bound trace elements at several sites in the secondary Chilia delta and were able to identify trace elements as contributors to toxicity of Danube sediments in laboratory toxicity tests. 3.5. Comparison with older unpublished data and literature data
Many socio-economical changes, essentially linked to the collapse of the communist economy, occurred in Romania over the
last two decades. These events led to potentially contrasting con-sequences on the environment. On the one hand, the economic collapse suddenly halted many industrial activities relying on obsolete practices and technologies. On the other hand, dismissed industrial areas and uncontrolled waste disposal could continue to threaten the environment. Comparison of trace element concen-trations in Danube sediments for the periods 1995e1997 (i.e., shortly after the collapse of communist economy) and 2004e2007 (when the country was in the process of joining the European Union) is therefore instructive. The number of measurements for the period 1995e1997 being limited (Table 1and Table S1), statistical com-parison between the two periods was possible only by pooling data for the Chilia, Sulina and Sfantu Gheorghe branches for each period. Significant differences between 1995e1997 and 2004e2007 were observed for Cd, Cr, Fe, Mn, Ni, Pb, V, and Zn (p < 0.02, Wil-coxoneManneWhitney test). Concentrations in ‘old’ sediments were higher than in recent ones for Cd, Mn, and Pb (Table 3). Cadmium is a known contaminant in fertilizers and the observed reduction likely reflects the abandoning of plans for intensive agriculture in the Danube Delta. The decrease for Pb and Mn can also be linked to the changes in land use, because these elements can enter into the composition of fungicides and other pesticides. In the case of Pb, the phasing out of leaded petrol is a complementary
Fig. 6. Values of Probable Effect Concentration Quotients (PEC-Q) for all the available samples collected in 2004e2007 calculated with and without the inclusion of Cr and Ni. Horizontal lines correspond to PEC-Q criteria of 0.34 and 0.25. Samples 1e26, Chilia and secondary Chilia delta (Ukraine, May 2004); samples 27e55, Chilia arm (Romania, 2004e 2007); samples 56e62, Tulcea arm (Romania, 2004e2007); samples 63e74, Sulina arm (Romania, 2004e2007); samples 75e91, Sf. Gheorghe arm (Romania, 2004e2007). Refer to
Table S1in the supporting information for more details.
Table 3
Comparison of trace element concentrations (ranges) in samples collected in this study and previously published results. The row ‘Years’ refers to the periods of sample collection in the various studies. The Joint Danube Survey databases 1 and 2 (http://www.icpdr.org/wq-db/home, free access, registration necessary) were accessed on 19th December 2012. All data are in mg kg"1dry weight.
Years Whole deltaa Whole deltaa Secondary Chilia deltab Delta JDS 1c Delta JDS 2d Danube rivere Danube tributariese
2004e2007 1995e1997 2006 2001 2007 2001 2001
Cd 0.115e1.9 0.5e10 n.d.e10 n.d.e1.5 0.6e0.75 <1.1e26 <1.1e33
Cr 20e124 18e101 6e378 71e80 76e102 35e139 26e556
Cu 3.5e94 2e51 1.5e138 40e88 60e105 31e663 31e8088
Ni 11e72 6e78 2.5e41 55e60 144e205 25e143 18e173
Pb 1e73 5e68 0.65e23 27e48 97e343 15e108 18e542
Zn 17e202 6e119 2.5e650 105e170 134e150 83e622 78e2010
a This study. b Burgess et al., 2009.
c Joint Danube Survey 1; sites JDS98 (Sf. Gheorghe), JDS97 (Sulina), and JDS 96 (Chilia arm, Km 56). d Joint Danube Survey 2; sites JDS93 (Chilia arm at Vilkovo), JDS95 (Sulina), and JDS 96 (Sf. Gheoghe). e Woitke et al., 2003.
explanation for the observed trend. Cr, Fe, Ni, V, and Zn have higher concentrations in recent sediments than in old ones, with Cr, Ni, V, and Zn exhibiting significant correlation with Fe (p < 0.01, Spearman correlation test). Their increase could then reflect diffuse pollution from ferrous deposits/material left abandoned after the transitions in Romanian economy. However, the observed trend could simply reflect a change in the dynamics of sediment trans-port and choosing between these or other hypotheses will require additional and regular monitoring.
Concentration ranges for 2004e2007 sediments in this study (Table 3andTable S1) are comparable with the results of the first and second Joint Danube Surveys (JDS1 and 2) carried out in 2001 and 2007. Our results also compare well with those reported by
Burgess et al. (2009)for samples collected in the Chilia secondary delta in SeptembereOctober 2006 (Table 3). Comparison with re-sults of the JDS1 for the entire Danube course from Neu-Ulm (Germany) to the Delta and for Danube tributaries (Table 3) show that Delta sediments (at least those in the main channels) are, with some exceptions (see Section3.4), less contaminated than those from some Danube stretches and tributaries.
4. Conclusions
The spatial coverage provided by this study showed that levels of trace elements in sediments of the whole Danube Delta are principally controlled by inputs from upstream, although inputs from local sources can increase contamination at some sites. Trace elements concentrations were comparable among sediments from the three main branches of the Danube Delta, the secondary Chilia delta and the facing coastal zone, further confirming that element inputs to the Delta are essentially from upstream sources. Cluster analysis and PCA identified Cd, Cu, Pb and Zn as elements suscep-tible to anthropogenic influence, while Cr and Ni concentrations were mainly determined by the presence of rocks naturally rich in these elements in the Romanian territory. These multivariate sta-tistical techniques could not, however, identify geographically coherent groups of sites.
On the other hand, Self Organizing Maps (SOM) gave the following information on the spatial patterns of sediment contamination and characteristics: sites from the secondary Chilia delta were separated from those in the three main Delta branches, sites from the Sulina branch had higher levels of Fe2O3, MnO and OC
than the other branches, and sites from the Sfantu Gheorghe branch had the lowest levels of sediment contamination. From a manage-ment point of view, the combination of results from PEC-Q and SOM indicates that: the secondary Chilia delta must be monitored separately from the main branches, punctual sources of contami-nation exist along the main Chilia branch and monitoring points upstream and downstream the cities of Izmail, Chilia, and Vilkovo should be included in monitoring programs, Sulina branch is moderately impacted by shipping activities, the Sf. Gheorghe branch is the least impacted part of the Danube Delta. Overall, although only a limited number of parameters were considered, this study provides information to build a joint RomanianeUkrainian network of monitoring (to complete other international efforts such as Joint Danube Surveys) and points to the necessity to develop specific sediment quality criteria for Cr and Ni in the Danube Delta. Acknowledgements
We thank Prof. Hans-Rudolf Pfeifer and Dr. Jean-Claude Lav-anchy (University of Lausanne) and Mr. Fabio Marco Capponi (University of Geneva) for the help with XRF analyses. GeoEcoMar authors acknowledge the financial support of the National Agency for Scientific Research (Romanian National Research Core Programs
GEOMAND, FLUDITMAR and GEOSIDMAR). The financial contribu-tion of the Swiss Nacontribu-tional Science Foundacontribu-tion (Grants 7IP 062626, project NEAR 2 and IB7420-110916, project NEAR 3) for the creation of the Network for Environmental Assessment and Remediation (NEAR) was instrumental in bringing together the expertise of the authors.
Appendix A. Supplementary data
Supplementary data related to this article can be found athttp:// dx.doi.org/10.1016/j.jenvman.2013.04.007.
References
Bacon, J.R., Davidson, C.M., 2008. Is there a future for sequential chemical extrac-tion? The Analyst 133, 25e46.
Bird, G., Brewer, P.A., Macklin, M.G., 2010. Management of the Danube drainage basin: implications of contaminant-metal dispersal for the implementation of the Eu Water Framework Directive. International Journal of River Basin Man-agement 8 (1), 63e78.
Black, C.A., 1965. Methods of Soil Analysis. American Society of Agronomy, Mono-graph 9, Madison, Wisconsin.
Burgess, R.M., Konovets, I.M., Kipnis, L.S., Lyashenko, A.V., Grintsov, V.A., Petrov, A.N., Terletskaya, A.V., Milyukin, M.V., Povolotskii, M.I., Demchenko, V.Y., Bogoslovskaya, T.A., Topkin, Y.V., Vorobyova, T.V., Portis, L.M., Ho, K.T., 2011. Distribution, magnitude and characterization of the toxicity of Ukrainian estuarine sediments. Marine Pollution Bulletin 62, 2442e2462.
Burgess, R.M., Terletskaya, A.V., Milyukin, M.V., Povolotski, M., Demchenko, V.Y., Bogoslavskaya, T.A., Topkin, Y.V., Vorobyova, T.V., Petrov, A.N., Lyashenko, A., Ho, K.T., 2009. Concentration and distribution of hydrophobic organic con-taminants and metals in the estuaries of Ukraine. Marine Pollution Bulletin 58, 1103e1115.
Céréghino, R., Park, Y.-S., 2009. Review of the Self-Organizing Map (SOM) approach in water resources: commentary. Environmental Modelling and Software 24 (8), 945e947.
Coops, H., Buijse, L.L., Buijse, A.D.T., Constantinescu, A., Covaliov, S., Hanganu, J., Ibelings, B.W., Menting, G., Navodaru, I., Oosterberg, W., Staras, M., Török, L., 2008. Trophic gradients in a large-river delta: ecological structure determined by connectivity gradients in the Danube Delta (Romania). River Research and Applications 24, 698e709.
Davis, J.C., 1986. Statistics and Data Analysis in Geology, second ed. John Wiley & Sons, New York.
Friedrich, J., Dinkel, C., Grieder, E., R!adan, S., Secrieru, D., Steingruber, S., Wehrli, B., 2003. Nutrient uptake and benthic regeneration in Danube Delta Lakes. Biogeochemistry 64 (3), 373e398.
Gaudette, H.E., Flight, W.R., Toner, L., Folger, D.W., 1974. An inexpensive titration method for the determination of organic carbon in recent sediments. Journal of Sedimentary Petrology 44, 249e253.
Giraudel, J.L., Lek, S., 2001. A comparison of self-organizing map algorithm and some conventional statistical methods for ecological community ordination. Ecological Modelling 146 (1e3), 329e339.
ICPDR, 2005. Danube Basin Analysis (WFD Roof Report 2004), p. 192. ICPDR Document IC/084, 18 March 2005.
ICPDR, 2008. Joint Danube Survey 2. Final Scientific Report. ICPDR, Vienna, p. 242. Jickells, T.D., Knap, A.H., 1984. The distribution and geochemistry of some trace metals in the Bermuda coastal environment. Estuarine, Coastal and Shelf Sci-ence 18, 245e262.
Kohonen, T., 2001. Self-Organizing Maps, third ed. Springer, Berlin.
Long, E.R., Ingersoll, C.G., MacDonald, D.D., 2006. Calculation and uses of mean sediment quality guideline quotients: a critical review. Environmental Science and Technology 40 (6), 1726e1736.
Lynch, J., 1990. Provisional elemental composition values for eight new geochemical lake sediment and stream sediment reference materials LKSD-1, LKSD-2, LKSD-3, LKSD-4, STSD-1, STSD-2, STSD-3, STSD-4. Geostandards Newsletter 14 (1),153e167. Mila"ci"c, R., "S"can"car, J., Murko, S., Kocman, D., Horvat, M., 2010. A complex investi-gation of the extent of pollution in sediments of the Sava River. Part 1: selected elements. Environmental Monitoring and Assessment 163 (1e4), 263e275. Negnevitsky, M., 2002. Artificial Intelligence. A Guide to Intelligent Systems, first ed.
Addison-Wesley, UK.
Oaie, Gh., Secrieru, D., Szobotka, S., Fulga, C., Stanica, A., 2005. Danube river: sedimentological, mineralogical and geochemical characteristics of the bottom sediments. GeoEcoMarina 11, 77e85.
Oaie, Gh., Szobotka, S., Stanica, A., 1997. Environmental state of the River Danube in 1995. GeoEcoMarina 2, 149e162.
Park, Y.-S., Céréghino, R., Compin, A., Lek, S., 2003. Applications of artificial neural networks for patterning and predicting aquatic insect species richness in running waters. Ecological Modelling 160, 265e280.
R!adan, S., Ganciu, A., Strechie, Cl., 2000. Overview of the long term ecological research performed by GEOECOMAR in the Danube Delta, Romania. In: Lajtha, K., Vanderbilt, K. (Eds.), Cooperation in Long Term Ecological Research in
Central and Eastern Europe, Proceedings of the ILTER Regional Workshop, 22e 25 June, 1999, Budapest, Hungary. Oregon State University, Corvallis, OR, pp. 101e112.
R!adan, S.C., R!adan, S., 2004. State of the sedimentary environments of the Matita-Merhei Depression (Danube Delta, Romania) as inferred from magnetic sus-ceptibility data. Proceeding of the Romanian Academy, Series B. Chemistry, Life-Sciences and Geosciences 3, 171e179.
Schiermeier, Q., 2004. Ukraine deluged by protests over plans for Danube Delta. Nature 431, 727.
Secrieru, D., Secrieru, A., 2002. Heavy metal enrichment of man-made origin of superficial sediments of the continental shelf of the north-western Black Sea. Estuarine, Coastal and Shelf Sciences 54, 513e526.
Secrieru, D., Gomoiu, M.T., Oaie, Gh., 2006. Marine Environmental Assessment of the NW Black Sea Area. GEOSCIENCES 2006 Conference, 288e291, Sofia. Stanica, A., Dan, S., Ungureanu, V.G., 2007. Coastal changes at the Sulina mouth of
the Danube River as a result of human activities. Marine Pollution Bulletin 55 (10e12), 555e563.
Sutherland, R.A., 1998. Loss-on-ignition estimates of organic matter and relation-ships to organic carbon in fluvial bed sediments. Hydrobiologia 389 (1e3), 153e167.
Tudorancea, C., Tudorancea, M.M. (Eds.), 2006. Danube Delta. Genesis and Biodi-versity. Backhuys Publishers, Leiden, p. 443.
Ultsch, A., 1993. Self-organizing neural networks for visualization and classification. In: Opitz, O., Lausen, B., Klar, R. (Eds.), Information and Classification. Springer-Verlag, Berlin, pp. 307e313.
Vesanto, J., Himberg, J., Alhoniemi, E., Parhankangas, J., 1999. Self-organizing map in matlab: the SOM toolbox. In: Proceedings of the Matlab DSP Conference 1999. Comsol Oy, Espoo, Finland, pp. 35e40.
Vignati, D., Pardos, M., Diserens, J., Ugazio, G., Thomas, R., Dominik, J., 2003. Characterisation of bed sediments and suspension of the river Po (Italy) during normal and high flow conditions. Water Research 37 (12), 2847e2864. Woitke, P., Wellmitz, J., Helm, D., Kube, P., Lepom, P., Litheraty, P., 2003. Analysis and
assessment of heavy metal pollution in suspended solids and sediments of the river Danube. Chemosphere 51, 633e642.