Group-Based Symptom Trajectories in Indicated Prevention of Adolescent Depression
Frédéric N. Brière, PhD,1 Paul Rohde, PhD,2 Eric Stice, PhD,2 Julien Morizot, PhD1,3
1 École de Psychoéducation, Université de Montréal, Montréal, Québec, Canada 2 Oregon Research Institute, Eugene, Oregon, United States
3 University of Montreal Public Health Research Institute (IRSPUM)
Correspondence: Frédéric N. Brière, École de psychoéducation, Université de Montréal, C.P. 6128, succursale Centre-ville, Montréal, Québec, Canada, H3C 3J7. Telephone: 514-452-0332. Email: frederic.nault-briere@umontreal.ca.
Running head: Adolescent Depression Prevention Trajectories
Keywords: Group-based trajectory modeling, latent class growth analysis, depression, prevention, adolescence, randomized controlled trial.
Disclosures:
Dr. Brière has nothing to disclose.
Drs. Rohde and Stice report grants from the National Institutes of Health (MH067183 and MH08053) during the conduct of the study.
Abstract
Background: Adolescent depression prevention research has focused on mean intervention
outcomes, but has not considered heterogeneity in symptom course. Here, we empirically identify subgroups with distinct trajectories of depressive symptom change among adolescents enrolled in two indicated depression prevention trials and examine how cognitive-behavioral (CB) interventions and baseline predictors relate to trajectory membership.
Methods: 631 participants were assigned to one of three conditions: CB group intervention, CB
bibliotherapy, and brochure control. We used group-based trajectory modeling to identify trajectories of depressive symptoms from pretest to 2-year follow-up. We examined associations between class
membership and conditions using chi-square tests and baseline predictors using multinomial regressions.
Results: We identified four trajectories in the full sample. Qualitatively similar trajectories were
found in each condition separately. Two trajectories of positive symptom course (Low-Declining, High-Declining) had declining symptoms and were distinguished by baseline symptom severity. Two
trajectories of negative course (High-Persistent, Resurging) respectively showed no decline in symptoms or decline followed by symptom reappearance. Participants in the brochure control condition were significantly more likely to populate the High-Persistent trajectory relative to either CB condition and were significantly less likely to populate the Low-Declining trajectory relative to CB group. Several baseline factors predicted trajectory classes, but gender was the most informative prognostic factor, with males having increased odds of membership in a High-Persistent trajectory relative to other trajectories.
Conclusions: Findings suggest that CB preventive interventions do not alter the nature of
Introduction
Adolescent depression is a prevalent and disabling condition that increases the risk of academic and occupational failure, interpersonal problems, comorbid psychopathology, and suicidality.[1-4] Considerable research has been devoted to developing effective interventions to prevent this disorder, with cognitive behavioral (CB) programs receiving most support.[5-7] To date, prevention programs have been examined using variable-centered (nomothetic) methods, which assume homogeneous change in intervention and control conditions. For this reason, little is known regarding the nature of heterogeneity in the symptom course of participants in prevention randomized controlled trials (RCTs). An approach to examine this heterogeneity is to use person-centered (idiographic) methods, such as group-based
trajectory modeling.[8; 9] This approach has been used to identify subgroups with qualitatively distinct symptom trajectories in natural development (e.g.,[10-13]) and in response to treatment in adults.[14-18] In general populations of adolescents, trajectory modeling has demonstrated that the development of depressive symptoms is characterized by multiple trajectories, with four replicated in several studies (chronically low, chronically high, increasing, decreasing) (e.g.,[10-13]). However, to our knowledge, this approach has never been used in depression prevention RCTs.
Group-based trajectory modeling may be useful for several reasons in prevention research. First, the method allows one to empirically identify typical symptom trajectories observed in RCTs in terms of number, shape and prevalence[9] and may thus provide a valuable description of patterns of response and non-response to interventions. Empirical trajectory classifications may be less arbitrary than common indicators used to define intervention response and non-response.[17] Second, trajectory modeling may offer a comprehensive understanding of intervention effects. The approach may reveal whether
interventions move participants from problematic to healthy trajectories and clarify the nature and timing of effects for different subgroups. Third, trajectory modeling may be useful to investigate predictors of
differential response to interventions.[15-18] Predicting who does and does not benefit from interventions is essential to reducing the risk of adverse effects in some participants, to refining interventions, and to determining which intervention should be offered to which participants.[19] Studies have examined moderators of intervention effects (e.g.,[20-24]) but few findings have replicated.[5; 7] Trajectory
modeling may reveal factors associated with multiple patterns based on the course of symptoms over time (e.g., two or more qualitatively distinct trajectories of poor response)[15] which may be overlooked by general moderation analyses focusing on specific time points,
In this study, we used group-based trajectory modeling to re-examine data from two large adolescent depression prevention RCTs. The trials respectively tested the efficacy and effectiveness of a brief indicated CB group intervention (the Blues Program) in relation to two alternative conditions: CB bibliotherapy and brochure control.[25; 26] Previous variable-centered analyses showed that the CB group intervention reduced mean depressive symptoms and the incidence of depression onset over follow-up relative to brochure control.[25; 26] The first objective of the present investigation was to identify subgroups with distinct trajectories of depressive symptoms from pretest to 2-year follow-up in a combined sample from the two RCTs. Our second objective was to determine how conditions related to the trajectories and, in particular, whether CB interventions were associated with increased membership in trajectories with positive symptom course relative to brochure control. Our third objective was to identify baseline predictors associated with trajectory membership, with a focus on identifying factors that could distinguish positive and negative symptom courses prior to intervention. We considered six factors (sex, age, negative cognitive style, substance use, motivation to reduce depression, intervention
expectancy) that have shown theoretical or empirical relevance in previous moderator research on adolescent depression prevention or intervention outcomes more generally.[5; 7; 20; 21; 27; 28] In contrast to most previous studies that used group-based trajectory modeling in clinical research, we analyzed both intervention and control conditions together whenever possible, as this is necessary to make inferences regarding intervention effects.
Method
Participants
The sample included 631 participants from the efficacy (n=253) and effectiveness (n=378) RCTs of the Blues Program.[25; 26] Participants were randomly assigned to one of three conditions: brief CB group Blues Program (n=215), CB bibliotherapy (n=208), and brochure control (n=208). An additional condition was included only in the efficacy trial (supportive-expressive intervention) and was excluded here. The sample included a majority of females (58%) and age ranged from 13 to 19 (M=15.5, SD=1.2). The sample included a majority of Caucasian adolescents (61%), and a minority of Asians (2%), African Americans (5%), Hispanics (17%), Native Americans (1%), and adolescents of mixed heritage (15%). Most participants had at least one parent with a college degree or higher (51%). Participants were recruited via mass mailings, handbills, and posters. Interested participants completed two versions of the Center for Epidemiologic Studies – Depression (CES-D)[29] questionnaire as a screener. Scores of 20 or higher were used for inclusion in the efficacy trial, and endorsement of two symptoms or more on a modified CES-D (which was not collected) was used for inclusion in the effectiveness trial. Exclusion criteria were current MDD and acute suicidal ideation (effectiveness trial specifically). Detailed procedures are described elsewhere.[25; 26]
CB group depression prevention intervention (blues program)
The CB group program included six weekly 1-hr sessions. Each session had two components: 1) “Changing Thinking”, which involved thought identification/recording and cognitive restructuring, and 2) “Changing Doing”, which primarily involved increased involvement in pleasant activities. The program was delivered by two facilitators in single-gender groups of 3 to 10 participants (M=6.3). Facilitators were trained research assistants in the efficacy trial and high school staff in the effectiveness trial.
CB bibliotherapy
Participants in CB bibliotherapy were given copies of Feeling Good[30] and were encouraged to use it as a self-help resource.
Brochure control
Participants in the brochure control condition were given a brochure (“Let’s Talk About Depression”)[31] that described major depression and recommended treatment. This condition was equivalent to usual care. Participants in this condition and the others were permitted to seek any type of psychiatric care during the study period.
Measures
Depressive symptoms. Depressive symptoms were assessed using 16 items adapted from the Schedule for Affective Disorders and Schizophrenia for School-Age Children (K-SADS).[32]
Assessments were conducted by blinded trained research assistants at pretest, posttest, and at 6-, 12-, and 24-month follow-ups. Participants indicated the peak severity of each symptom over the past 12 months at pretest or since the last interview in follow-up assessments. Items were averaged to form a continuous symptom severity measure (α=.78).
Baseline predictors. Baseline predictors were measured using questionnaires. Negative cognitive style was measured using 12 items from the Adolescent Cognitive Style Questionnaire (α=.93).[33] Substance use was measured using a 10-item scale asking participants to report the frequency of alcohol and drug intake in the past 6-month (α=.77).[34] Motivation to reduce depression was measured using
four items developed for this project (e.g., “I am prepared to give this intervention my best shot because I really want to overcome my problems with depression”; α=.88). Intervention expectancy was measured using 3 items respectively asking participants to rate how much they thought each of the three conditions (group to learn skills, self-help book, short pamphlet) would help someone prevent depression (1=not very prepared; 5=very prepared). We recoded a single variable reflecting scores for the condition participants were assigned to.
Statistical analyses
We conducted Group-Based Trajectory Modeling (also known as Latent Class Growth
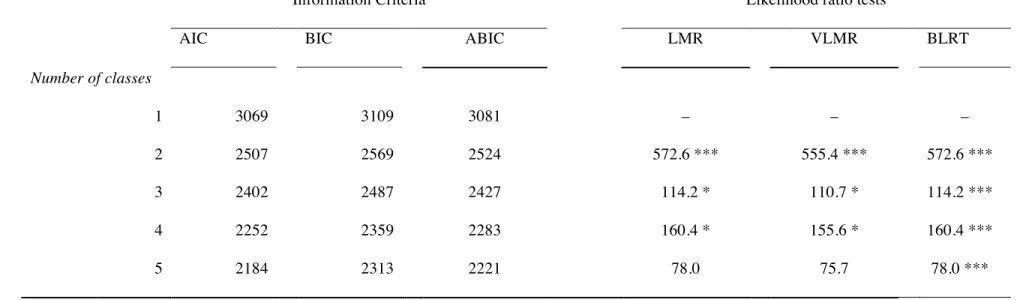
Analysis)[11; 17] in Mplus 6.21.[35] We estimated trajectories with four growth factors (intercept, linear growth, quadratic growth, cubic growth) and no within-class variation around these parameters. We derived solutions from 1 to 5 classes (models did not converge beyond 5 classes). We used a large number of start values (5000, with 100 optimizations) to avoid solutions at local maxima. We considered multiple criteria to select the best model.[36] First, we examined information criteria to compare the relative fit of trajectory solutions. Second, we considered likelihood ratio tests, which indicate whether a solution with k classes offers a significant improvement in fit over a solution with k-1 class(es). Third, we took into account the substantive value of each model by evaluating how solutions compared with
theoretical accounts and previous findings. We also tested Growth Mixture Models[37], which allow for within-class variation (or random effects) around growth parameters, in preliminary analyses. However, we discarded this approach because these models did not converge adequately.
After selecting the best-fitting trajectory model, we saved information on most likely class membership for all participants and conducted analyses of associations in a separate step. Although information is lost by fixing class membership, we chose this strategy to prevent predictors from modifying the trajectory solution and because we experienced convergence problems in model-based multivariate models using the Mplus R3STEP option. We examined the association between condition
and most likely trajectory class membership using a chi-square test, and the association between baseline predictors and class membership using multinomial regressions. Individual predictors were considered simultaneously in the three conditions adjusting for trial (efficacy vs. effectiveness). We took missing data into account using Full Information Maximum Likelihood estimation.
Results
Preliminary analyses
We examined differences in study variables between the two trials (Appendix A). The efficacy trial included more males and participants with higher baseline symptoms and poorer functioning than the effectiveness trial. This probably occurred because of the relaxed symptom requirements in the
effectiveness trial.[26] We also tested whether the equivalence of baseline depressive symptoms between conditions was preserved in the combined efficacy/effectiveness sample. One way ANOVA models indicated no difference between conditions on baseline symptoms (F(2, 627)=.48, p=.62). Finally, we examined attrition. Rates of missingness were 4% at posttest, and 11% at 6-month, 11% at 12-month, and 16% at 24-month follow-up. The number of missed assessments was associated with higher baseline depressive symptoms (B=.16, p<.05), but was not related to conditions or baseline predictors.
Identification of trajectories
We first derived trajectories separately for each condition to determine whether qualitatively distinct solutions existed in intervention and control groups. We found similar solutions in terms of number and shape of trajectories (Appendix B) and thus proceeded to identify trajectories in the full sample. Table 1 presents information criteria and likelihood ratio tests for various trajectory solutions. Fit improved with the number of trajectories, but improvements became more modest in models with more than 4 classes. Likelihood ratio tests favored a 4-class solution, except for the bootstrapped likelihood ratio test which failed to discriminate solutions. Substantive checking also favored a 4-class solution, which we selected.
Trajectories are displayed in Figure 1. The largest trajectory (58%) was labeled Low-Declining and included participants with moderate initial symptoms that decreased from baseline to 6-month
follow-up and remained relatively stable to 2-year follow-follow-up. The second largest trajectory (26%) was labeled High-Declining and included participants with elevated baseline symptoms that decreased steadily from baseline to 1-year follow-up and stabilized to 2-year follow-up. The third trajectory (10%) was labeled High-Persistent and included participants with elevated initial symptoms that remained elevated through 2-year follow-up. This trajectory had an inverted U-shaped course with initial increase in symptoms from pretest to 6-month follow-up, followed by decline to (elevated) baseline levels. The least prevalent trajectory (6%) was labeled Resurging and included participants with elevated baseline symptoms that declined from baseline to 6-month follow-up, before dramatically increasing from 6-month follow-up to 1-year follow-up. Symptoms then declined but remained elevated to 2-year follow-up.
A chi-square test indicated an overall difference in the prevalence of trajectory membership between the two trials (χ²(df=3)=73.7, p<.001). Post hoc comparisons indicated that efficacy trial participants were significantly more likely to be members of Declining (36% vs. 18%) and High-Persistent (18% vs. 4%) trajectories, and less likely to be members of the Low-Declining trajectory (42% vs. 71%) than effectiveness trial participants.
Association between condition and trajectory class
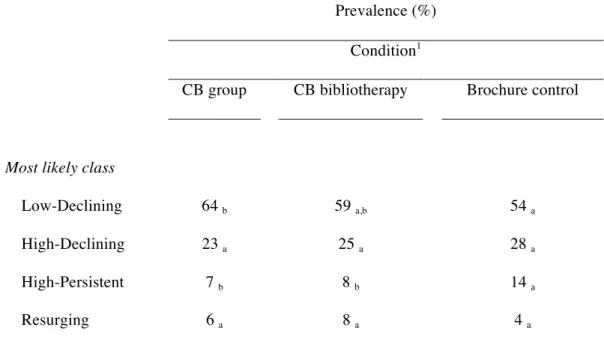
We next examined the association between condition and trajectory class (Table 2). Chi-square test indicated an overall difference in the prevalence of trajectory membership between conditions (χ²(df=6)=12.9, p=.04). Post hoc (within-row) comparisons indicated that participants in brochure control were significantly more likely to be classified in the High-Persistent trajectory compared to participants in CB group (14% vs. 7%) and bibliotherapy (14% vs. 8%). In addition, CB group was associated with significantly higher membership in the Low-Declining trajectory compared to brochure controls (64% vs. 54%). The three conditions did not significantly differ in membership in the High-Declining or Resurging classes.
Baseline predictors of trajectory class
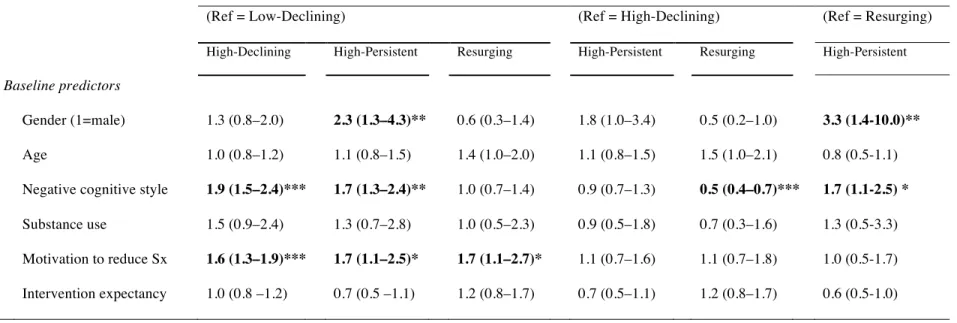
Table 3 presents associations between baseline predictors and trajectory classes. We used
multinomial regressions to examine multivariate models with binary and continuous predictors, entering trial as a covariate. The presentation of results differs from previous chi-square analyses because multinomial regression involves comparisons to specific references classes. We show all pairwise
comparisons between trajectories using three reference classes (1) Low-Declining versus all other classes (compares low versus high initial depression trajectories); (2) High-Declining versus High-Persistent and Resurging (compares positive versus negative courses among the highly depressed at baseline); and (3) Resurging versus High-Declining (compares the two negative trajectories with negative course).
Three predictors were associated with significant differences between classes: gender, negative cognitive style, and motivation to reduce depressive symptoms. Male gender was associated with increased odds of membership in the High-Persistent trajectory relative to the Resurging and Low-Declining trajectories, as well as the High-Low-Declining trajectory at a trend-level (p=.07). Negative cognitive style was higher in High-Declining and High-Persistent trajectories than Resurging and Low-Declining trajectories. Finally, motivation to reduce depression was higher in Low-Declining, High-Persistent, and Resurging trajectories than the Low-Declining trajectory.
Secondary analyses
We conducted a model-based test of moderation by examining whether the association between baseline predictors and trajectory class significantly differed in the three conditions. We used the Model Test option in Mplus to obtain Wald tests comparing models with multinomial regression parameters constrained to be equal in two specific conditions and models with free regression parameters in the same two conditions. This test was repeated for all predictors and all pairwise comparisons between conditions.
These analyses revealed no moderation effect, suggesting that baseline predictors had similar associations with trajectories in the three conditions.
We also examined whether other treatments sought by participants affected study findings. These analyses were only conducted in the effectiveness trial, since information in the efficacy trial did not demarcate adjunctive treatment during or after the intervention phase. Results showed no difference between trajectory classes in rates of adjunctive treatment for emotional or behavioral problems during the intervention phase, but higher rates of adjunctive treatment during the follow-up phase (posttest to 2 years) in the High-Persistent and Resurging classes compared to the High-Declining and Low-Declining classes (Appendix C). Rates of antidepressant usage did not differ between trajectories during or after the study. These analyses suggest that adjunctive treatment was unlikely to have confounded the association between trajectories and CB interventions, but may have resulted from the prolonged experience of symptoms in High-Persistent and Resurging trajectories.
Discussion
To our knowledge, this study is the first to use group-based trajectory modeling as a clinical research tool in adolescent depression prevention research. Using data from two large RCTs,[25; 26] we identified four trajectories of symptoms in participants who were and were not exposed to indicated CB preventive interventions. Two large trajectories, Low-Declining and High-Declining, had positive symptom course. These trajectories were characterized by symptom decline in the first six months followed by stabilization and were primarily distinguished on the basis of baseline symptom severity. These positive trajectories comprised the majority of participants in CB group and bibliotherapy, but also in the brochure control condition with no active intervention. This finding is consistent with research indicating high rates of spontaneous remission or placebo response in clinical research on adolescent depression.[38] Second, we identified two negative course trajectories. The High-Persistent trajectory was characterized by elevated symptoms from pretest to 2-year follow-up with an inverted U-shaped course (i.e., increase followed by decline to baseline levels). The Resurging trajectory was characterized by strong early reduction followed by a dramatic increase in symptoms.
Our second objective was to determine how CB interventions related to trajectories. Interestingly, exposure to CB interventions did not appear to modify the nature of trajectories because we found
qualitatively similar solutions in all conditions when investigated separately. However, CB interventions modified trajectory membership. Participants in both CB conditions had reduced rates of membership in the High-Persistent trajectory compared to brochure control participants, a finding that is consistent with a prophylactic effect. In addition, CB group (but not bibliotherapy) participants had an increased rate of membership in the Low-Declining class relative to brochure control participants. This finding is more challenging to interpret because the Low-Declining class had a positive course, which may have been influenced by CB group, but also lower pre-existing symptoms, which would not. It is therefore
impossible to conclude that this difference represents a CB group effect. No difference in trajectory class membership was found between CB group and bibliotherapy.
Our third objective was to examine baseline predictors of trajectories. Results from these analyses were complex, but may be summed up in three conclusions. First, gender was the most informative prognostic factor in its capacity to distinguish the poorest symptom course, High-Persistent, from other trajectories. Males had increased odds of being in the High-Persistent trajectory relative to the Low-Declining and Resurging trajectories, as well as the High-Low-Declining trajectory at a trend-level. A subset of males thus had a tendency to experience a chronic form of depression, which may help to explain why previous studies have shown poorer effects of CB interventions on males than females.[5; 7; 39] Second, motivation to reduce depression was primarily a predictor of initial severity. This factor predicted
membership in trajectories with elevated baseline symptoms relative to the Low-Declining trajectory, but did not distinguish subsequent positive (High-Declining) or negative (High-Persistent, Resurging) course among these trajectories. This suggests that baseline motivation did not contribute to intervention
response or natural improvement, but primarily reflected symptom-induced distress at baseline. Third, negative cognitive style was a mixed factor, predicting both positive (High-Declining) and negative (High-Persistent) trajectories relative to other positive (Low-Declining) and negative (Resurging) trajectories. This predictor appeared to be associated with symptom severity during the early portion of the trial, but did not seem to relate to subsequent course. The clinical explanations for this pattern are unclear and may depend on complex interactions between factors, such as gender and age. Secondary analyses indicated that associations between baseline predictors and trajectory classes did not differ by condition, suggesting that these predictors were general predictors of symptom course rather than moderators with stronger effects in specific conditions.[40]
Several study limitations should be acknowledged. First, we merged samples from two RCTs with different inclusion criteria in order to increase sensitivity. Although entering trial as a covariate in analyses should have reduced the risk of bias in associational analyses, the use of different samples may have influenced the trajectory solution. Second, the prevalence of High-Persistent and Resurging trajectories was relatively low, which may have limited statistical sensitivity in analyses involving these groups. Third, we included baseline symptoms as part of trajectories, making it difficult to determine the
degree to which associations between trajectories and conditions and baseline predictors were related to pre-existing symptom levels. Fourth, we conducted separate analyses with fixed class membership, which did not take into account uncertainty in trajectory classification. This was however necessary for
multivariate models to converge.
This study is the first to describe typical trajectories in an indicated prevention RCT, but additional trajectory research will need to replicate our findings. Several questions remain unanswered regarding distinctions between trajectories. A key issue for future investigations will be to uncover factors associated with the Resurging trajectory. Given the course of symptoms in this class, examination of time-varying covariates may prove more informative than a focus on baseline predictors. Another key issue will be to examine factors that explain why males were more likely to be in the High-Persistent trajectory than females.
Our findings extend previous results[25; 26] in several ways and have important clinical implications. Most importantly, our findings reveal two distinct poor outcome trajectories that were not described before in our prevention trials: a High-Persistent, chronic type trajectory particularly found in males and a Resurging, relapse-type trajectory that shows little differentiation from declining trajectories at baseline. Although CB interventions were successful at reducing the risk of membership in the High-Persistent trajectory, both poor outcome trajectories existed in CB group and bibliotherapy conditions (roughly comprising 15% of participants). This implies that sustained improvement should not be assumed for all participants and that symptoms should be monitored after the intervention. Monitoring should be conducted for an extended period (at least 12 months), since participants in the Resurging trajectory show strong initial improvement before a worsening of symptoms. Participants in the High-Persistent and Resurging trajectories may benefit from additional intervention, such as booster sessions or more intensive intervention in stepped-care models. Another implication concerns the selection of
participants for indicated CB prevention. Our results highlight that the large majority of participants (four out of five) in the control condition followed a declining trajectory, suggesting that most participants selected for indicated prevention may not have needed an intervention. Given the limited resources
available to implement prevention in natural settings, improving algorithms to ensure the selection of highest risk participants should be a priority of future research.
Acknowledgments
This study was supported by grants from the National Institutes of Health (MH067183 and MH08053) awarded to Paul Rohde and Eric Stice. The authors thank Jeff Gau for providing help with data organization.
References
1. Fergusson DM, Woodward LJ. Mental health, educational, and social role outcomes of adolescents with depression. Arch Gen Psychiatry 2002;59(3):225-31.
2. Lewinsohn PM, Hops H, Roberts RE et al. Adolescent psychopathology: I. Prevalence and incidence of depression and other DSM-III-R disorders in high school students. J Abnorm Psychol 1993;102(1):133-44.
3. Lewinsohn PM, Rohde P, Seeley JR et al. Psychosocial functioning of young adults who have experienced and recovered from major depressive disorder during adolescence. J Abnorm Psychol 2003;112(3):353-63.
4. Nock MK, Borges G, Bromet EJ et al. Suicide and suicidal behavior. Epidemiol Rev 2008;30:133-54.
5. Horowitz JL, Garber J. The prevention of depressive symptoms in children and adolescents: A meta-analytic review. J Consult Clin Psychol 2006;74(3):401-15.
6. Merry SN, Hetrick SE, Cox GR et al. Psychological and educational interventions for preventing depression in children and adolescents. Cochrane Database Syst Rev 2011;(12):CD003380. 7. Stice E, Shaw H, Bohon C et al. A meta-analytic review of depression prevention programs for
children and adolescents: factors that predict magnitude of intervention effects. J Consult Clin Psychol 2009;77(3):486-503.
8. Nagin D, Tremblay RE. Trajectories of boys' physical aggression, opposition, and hyperactivity on the path to physically violent and nonviolent juvenile delinquency. Child Dev
1999;70(5):1181-96.
9. Nagin DS, Odgers CL. Group-based trajectory modeling in clinical research. Annu Rev Clin Psychol 2010;6:109-38.
10. Brendgen M, Wanner B, Morin AJ, Vitaro F. Relations with parents and with peers,
temperament, and trajectories of depressed mood during early adolescence. J Abnorm Child Psychol 2005;33(5):579-94.
11. Brière FN, Janosz M, Fallu J-S, Morizot J. Adolescent Trajectories of Depressive Symptoms: Codevelopment of Behavioral and Academic Problems. J of Adolesc Health 2015;57(3):313-319. 12. Costello DM, Swendsen J, Rose JS, Dierker LC. Risk and protective factors associated with
trajectories of depressed mood from adolescence to early adulthood. J Consult Clin Psychol 2008;76(2):173-83.
13. Wickrama T, Wickrama KA. Heterogeneity in adolescent depressive symptom trajectories: implications for young adults' risky lifestyle. J Adolesc Health 2010;47(4):407-13.
14. Gueorguieva R, Mallinckrodt C, Krystal JH. Trajectories of depression severity in clinical trials of duloxetine: insights into antidepressant and placebo responses. Arch Gen Psychiatry
2011;68(12):1227-37.
15. Stulz N, Thase ME, Klein DN et al. Differential effects of treatments for chronic depression: a latent growth model reanalysis. J Consult Clin Psychol 2010;78(3):409-19.
16. Sunderland M, Wong N, Hilvert-Bruce Z, Andrews G. Investigating trajectories of change in psychological distress amongst patients with depression and generalised anxiety disorder treated with internet cognitive behavioural therapy. Behav Res Ther 2012;50(6):374-80.
17. Thibodeau MA, Quilty LC, De Fruyt F et al. Latent classes of nonresponders, rapid responders, and gradual responders in depressed outpatients receiving antidepressant medication and psychotherapy. Depress Anxiety 2015;32(3):213-20.
18. Uher R, Muthen B, Souery D et al. Trajectories of change in depression severity during treatment with antidepressants. Psychol Med 2010;40(8):1367-77.
19. Kazdin AE. Developing a research agenda for child and adolescent psychotherapy. Arch Gen Psychiatry 2000;57(9):829-35.
20. Briere FN, Rohde P, Shaw H, Stice E. Moderators of two indicated cognitive-behavioral
depression prevention approaches for adolescents in a school-based effectiveness trial. Behav Res Ther 2014;53:55-62.
21. Gau JM, Stice E, Rohde P, Seeley JR. Negative life events and substance use moderate cognitive behavioral adolescent depression prevention intervention. Cogn Behav Ther 2012;41(3):241-50. 22. Jaycox LH, Reivich KJ, Gillham J, Seligman ME. Prevention of depressive symptoms in school
children. Behav Res Ther 1994;32(8):801-16.
23. Possel P, Martin NC, Garber J, Hautzinger M. A randomized controlled trial of a cognitive-behavioral program for the prevention of depression in adolescents compared with nonspecific and no-intervention control conditions. J Couns Psychol 2013;60(3):432-8.
24. Spence SH, Sawyer MG, Sheffield J et al. Does the absence of a supportive family environment influence the outcome of a universal intervention for the prevention of depression? International journal of environmental research and public health 2014;11(5):5113-5132.
25. Stice E, Rohde P, Seeley JR, Gau JM. Brief cognitive-behavioral depression prevention program for high-risk adolescents outperforms two alternative interventions: a randomized efficacy trial. J Consult Clin Psychol 2008;76(4):595-606.
26. Rohde P, Stice E, Shaw H, Briere FN. Indicated Cognitive Behavioral Group Depression Prevention Compared to Bibliotherapy and Brochure Control: Acute Effects of an Effectiveness Trial With Adolescents. J Consult Clin Psychol 2013;82:65-74.
27. Driessen E, Hollon SD. Cognitive behavioral therapy for mood disorders: efficacy, moderators and mediators. Psychiatr Clin North Am 2010;33(3):537-55.
28. Knopp J, Knowles S, Bee P et al. A systematic review of predictors and moderators of response to psychological therapies in OCD: Do we have enough empirical evidence to target treatment? Clin Psychol Rev 2013;33(8):1067-1081.
29. Radloff LS. The CES-D Scale: a self-report depression scale for research in the general population. Appl Psychol Meas 1977;1(3):385-401.
30. Burns DD. Feeling good. New York: Guilford Press, 1980.
31. National Institutes of Mental Health. Let’s talk about depression (NIH Publication No. 01–4162) [Brochure]. Rockville, MD: National Institutes of Health, 2001.
32. Orvaschel H, Puig-Antich J, Chambers W et al. Retrospective assessment of prepubertal major depression with the Kiddie-SADS-e. J Am Acad Child Psychiatry 1982;21(4):392-7.
33. Hankin BL, Abramson LY. Measuring cognitive vulnerability to depression in adolescence: reliability, validity, and gender differences. J Clin Child Adolesc Psychol 2002;31(4):491-504. 34. Stice E, Barrera Jr M, Chassin L. Prospective differential prediction of adolescent alcohol use and
problem use: Examining the mechanisms of effect. J Abnorm Psychol 1998;107(4):616-628. 35. Muthén LK, Muthén BO. Mplus User’s Guide. Sixth Edition. Los Angeles, CA: Muthén &
Muthén, 1998-2010.
36. Tofighi D, Enders C. Identifying the correct number of classes in growth mixture models. In: Hancock GR, Samuelson KM, editors. Advances in latent variable mixture models. Charlotte, NC: Information age; 2008, p 317–341.
37. Muthen B, Shedden K. Finite mixture modeling with mixture outcomes using the EM algorithm. Biometrics 1999;55(2):463-9.
38. Birmaher B, Brent D, Bernet W et al. Practice parameter for the assessment and treatment of children and adolescents with depressive disorders. J Am Acad Child Adolesc Psychiatry 2007;46(11):1503-26.
39. Gillham JE, Hamilton J, Freres DR et al. Preventing depression among early adolescents in the primary care setting: a randomized controlled study of the Penn Resiliency Program. J Abnorm Child Psychol 2006;34(2):203-219.
40. Fournier JC, DeRubeis RJ, Shelton RC et al. Prediction of response to medication and cognitive therapy in the treatment of moderate to severe depression. J Consult Clin Psychol
Table 1. Information Criteria and Likelihood Ratio Tests for Trajectory Models with 1 to 5 Classes
Information Criteria Likelihood ratio tests
AIC BIC ABIC LMR VLMR BLRT
Number of classes 1 3069 3109 3081 – – – 2 2507 2569 2524 572.6 *** 555.4 *** 572.6 *** 3 2402 2487 2427 114.2 * 110.7 * 114.2 *** 4 2252 2359 2283 160.4 * 155.6 * 160.4 *** 5 2184 2313 2221 78.0 75.7 78.0 ***
AIC = Aikake Information Criterion; BIC = Bayesian Information Criterion; ABIC = Sample-Size Adjusted Bayesian Information Criterion; LMR = Lo-Mendell-Rubin Likelihood Ratio Test; VLMR = Vuong-Lo-Mendell-Rubin Likelihood Ratio Test; BLRT = Bootstrapped Likelihood Ratio Test; *** = p < .001; * = p < .05.
Table 2. Trajectory Class Membership by Condition
Prevalence (%)
Condition1
CB group CB bibliotherapy Brochure control
Most likely class
Low-Declining 64 b 59 a,b 54 a
High-Declining 23 a 25 a 28 a
High-Persistent 7 b 8 b 14 a
Resurging 6 a 8 a 4 a
Table 3. Baseline Predictors of Trajectory Class Membership
Trajectory Class Membership (OR)
(Ref = Low-Declining) (Ref = High-Declining) (Ref = Resurging)
High-Declining High-Persistent Resurging High-Persistent Resurging High-Persistent
Baseline predictors
Gender (1=male) 1.3 (0.8–2.0) 2.3 (1.3–4.3)** 0.6 (0.3–1.4) 1.8 (1.0–3.4) 0.5 (0.2–1.0) 3.3 (1.4-10.0)**
Age 1.0 (0.8–1.2) 1.1 (0.8–1.5) 1.4 (1.0–2.0) 1.1 (0.8–1.5) 1.5 (1.0–2.1) 0.8 (0.5-1.1)
Negative cognitive style 1.9 (1.5–2.4)*** 1.7 (1.3–2.4)** 1.0 (0.7–1.4) 0.9 (0.7–1.3) 0.5 (0.4–0.7)*** 1.7 (1.1-2.5) *
Substance use 1.5 (0.9–2.4) 1.3 (0.7–2.8) 1.0 (0.5–2.3) 0.9 (0.5–1.8) 0.7 (0.3–1.6) 1.3 (0.5-3.3)
Motivation to reduce Sx 1.6 (1.3–1.9)*** 1.7 (1.1–2.5)* 1.7 (1.1–2.7)* 1.1 (0.7–1.6) 1.1 (0.7–1.8) 1.0 (0.5-1.7)
Intervention expectancy 1.0 (0.8 –1.2) 0.7 (0.5 –1.1) 1.2 (0.8–1.7) 0.7 (0.5–1.1) 1.2 (0.8–1.7) 0.6 (0.5-1.0)
Figure Legends
Figure 1. Four Trajectories of Depressive Symptoms Identified in Two Indicated Prevention RCTs 1 1.2 1.4 1.6 1.8 2 2.2
Pretest Posttest 6 Months 12 months 24 months
K S A D S D epre ss ive S ym pt om s High-Persistent (10%) Resurging (6%)
Rate or mean (SD)
Efficacy (Austin) Effectiveness (Oregon) Mean or Rate Difference
Baseline factors
Depressive symptoms 1.8 (0.3) 1.4 (0.4) 0.4, p <.001
Gender (1=male) 56.9 32.3 24.6, p<.001
Age 15.5 (1.2) 15.5 (1.2) 0.0, p=.8
Negative cognitive style 3.7 (1.2) 3.5 (1.1) 0.3, p=.005
Substance use 0.5 (0.6) 0.3 (0.6) 0.2, p<.01
Motivation to reduce Sx 3.3 (0.9) 3.0 (1.1) 0.3, p<.001
B1. CB Group Trajectories
B2. CB Bibliotherapy Trajectories
B3. Brochure Control Trajectories
1 1.2 1.4 1.6 1.8 2 2.2 2.4
Pretest Posttest 6 Months 12 months 24 months
K S A D S D ep re ss ive S ymp toms High-Declinings (18%) High-Persistent (6%) Resurging (8%) 1 1.2 1.4 1.6 1.8 2 2.2 2.4 2.6
Pretest Posttest 6 Months 12 months 24 months
K S A D S D ep re ss ive S ymp toms Low-Declining (58%) High-Declining (26%) High-Persistent (12%) Resurging (4%) 1 1.2 1.4 1.6 1.8 2 2.2 2.4 2.6
Pretest Posttest 6 Months 12 months 24 months
K S A D S D ep re ss ive S ymp toms Low-Declining (56%) High-Declining (27%) High-Persistent (12%) Resurging (5%)
Chi-Square Test High-Declining High-Persistent Low-Declining Resurging
During the intervention phase
Any adjunctive treatment 19 29 20 25 X2 (df=3)=1.08, p=.78
Adjunctive medication 2 0 3 4 X2 (df=3)=0.88, p=.83
Posttest to 2 year follow-up
Any adjunctive treatment 39a 73b 31a 67b X2 (df=3)=22.42, p<.001
Adjunctive medication 6 7 8 15 X2 (df=3)=1.92, p=.59