Publisher’s version / Version de l'éditeur:
International Journal of Multiphysics, 5, 2, pp. 101-114, 2011-05-24
READ THESE TERMS AND CONDITIONS CAREFULLY BEFORE USING THIS WEBSITE. https://nrc-publications.canada.ca/eng/copyright
Vous avez des questions? Nous pouvons vous aider. Pour communiquer directement avec un auteur, consultez la
première page de la revue dans laquelle son article a été publié afin de trouver ses coordonnées. Si vous n’arrivez pas à les repérer, communiquez avec nous à [email protected].
Questions? Contact the NRC Publications Archive team at
[email protected]. If you wish to email the authors directly, please see the first page of the publication for their contact information.
NRC Publications Archive
Archives des publications du CNRC
This publication could be one of several versions: author’s original, accepted manuscript or the publisher’s version. / La version de cette publication peut être l’une des suivantes : la version prépublication de l’auteur, la version acceptée du manuscrit ou la version de l’éditeur.
For the publisher’s version, please access the DOI link below./ Pour consulter la version de l’éditeur, utilisez le lien DOI ci-dessous.
https://doi.org/10.1260/1750-9548.5.2.101
Access and use of this website and the material on it are subject to the Terms and Conditions set forth at
Coupled gas flow, diffusion and reaction in a ppb-level Sn0
₂-NiO
formaldehyde sensor system
Darcovich, K.; Tunney, J.J.; Dunford, J.L.; Styles, L.M.; Xiao, G.; Constant, A.
https://publications-cnrc.canada.ca/fra/droits
L’accès à ce site Web et l’utilisation de son contenu sont assujettis aux conditions présentées dans le site LISEZ CES CONDITIONS ATTENTIVEMENT AVANT D’UTILISER CE SITE WEB.
NRC Publications Record / Notice d'Archives des publications de CNRC:
https://nrc-publications.canada.ca/eng/view/object/?id=6ae778bb-e0c5-4954-bf5f-b1fdc0244583 https://publications-cnrc.canada.ca/fra/voir/objet/?id=6ae778bb-e0c5-4954-bf5f-b1fdc0244583
1
Coupled Gas Flow, Diffusion and Reaction in a ppb-level SnO
2-NiO
Formaldehyde Sensor System
K. Darcovich,*
J.J. Tunney, J.L. Dunford, L.M. Styles, G. Xiao
1and A. Constant
2National Research Council of Canada, Institute for Chemical Process and Environmental Technology, Ottawa, Ontario, Canada, K1A 0R6
1
National Research Council of Canada, Institute for Microstructural Sciences, Ottawa, Ontario, Canada, K1A 0R6
2 ICAM-Nantes, 35 av du Cha p de Ma œuvres, 44470 Carquefou, France
ABSTRACT
The present project is part of an effort towards the development of a ppb-level formaldehyde sensor system for indoor air quality. An electroceramic response model for a SnO2-NiO composite solid oxide
sensing material of n-type conductivity inside the porous material is coupled with a transient flow field simulation of the delivery of a formaldehyde pulse to the sensor surface. Coupled volumetric CFD domains are used to examine the effects of the transport of formaldehyde from a preconcentrator unit to the sensor, and its implications for interpreting the sensor signals from laboratory experiments.
1. INTRODUCTION
Semiconducting solid oxides have been long established as materials useful for gas sensing applications. Their functionality arises from electroceramic properties which are highly sensitive to the presence of extremely low analyte concentrations. In brief, when a gas to be detected (analyte) at a concentration above some threshold value comes in contact with the solid oxide material by diffusion into its porous bulk and simultaneous reaction with its surface, it serves to appreciably alter the material conductivity. The change in solid oxide electrical conductivity owing to the presence of analyte is the sensor response. In real sensor applications, a further consideration is the interface between the external gas
environment and the sensor surface. Models to date which have looked at the internal chemistry and physics of sensor behaviour, have treated the external gas phase as having constant properties. It is known however, that if analyte is delivered to the sensor surface in some kind of flowing system, and temporally, (ie; a desorption pulse from a preconcentrator), the external transport of the gas and analyte to the sensor surface has a significant influence on the sensor response.
The present project has for its aim the development of technology for a sensing system for formaldehyde (HCHO), with resolution in its sensitivity at the parts per billion (ppb) level. The
motivation for the project was in response to Health Canada guidelines on indoor air quality which has been increasingly understood in recent years as a significant health risk. [1] Risk thresholds posing
* Corresponding author. Tel: 1-613-993-6848 ; fax: 1-613-991-2384 ; e-mail address: [email protected]
2 potential health problems have been determined as exposure for one hour at 100 ppb, or exposure over 8 hours at 40 ppb.
At present, there exist a variety of established methods for formaldehyde detection, which are typically laboratory instruments for ppb-level sensitivity, such as reaction and detection with high-performance liquid chromatography, or real time detection with mass spectrometry systems. [2,3] Hand-held systems based on a variety of detection schemes are available although they generally exhibit sensitivities in the ppm range and are often not very selective to formaldehyde and are priced in the $1000 range. [4]
The use of metal oxide materials for the detection of atmospheric and industrial gases including volatile organic compounds has long been established, with materials based on SnO2, TiO2 and ZnO commonly
used as gas sensors. [5] These materials are typically n-type semiconductors, which when exposed to reducing gases such as aldehydes, ketones or alcohols will show an increase in conductivity by reacting with chemisorbed oxygen species on the surface causing electrons to be injected into the conduction band of the material.
Gas sensitivities below the 1 ppm range can sometimes be achieved by better controlling the
nanostructure of the metal oxides. [6] At present, the highest sensitivities reported in the literature are around 50 ppb, achieved using metal oxides based on both SnO2 and NiO [7,8] composite materials. The
sensing mechanism for formaldehyde detection is temperature dependent and believed to be the surface catalyzed oxidation of formaldehyde. [7,9,10] This reaction is transduced as a bulk conductivity change proportional to the surface concentration of adsorbed oxygen ions.
Considering the state of the art, metal oxide films based on SnO2-NiO composite films were selected for
evaluation in this project. In terms of system design, the sensor was integrated with an upstream preconcentrator unit, a porous solid region of packed powder of a carbon molecular sieve material (Carboxen 1018, Supelco), a highly efficient adsorbent, highly selective for formaldehyde. [11,12] While the overall project is broad in scope, targeting a wireless sensing network integrated with building heating, ventilation and air conditioning for enhanced indoor air quality and energy efficiency, the material presented here relates to the development and implementation of an SnO2-NiO solid oxide
sensor in a dynamic environment. 2. PHYSICAL SYSTEM
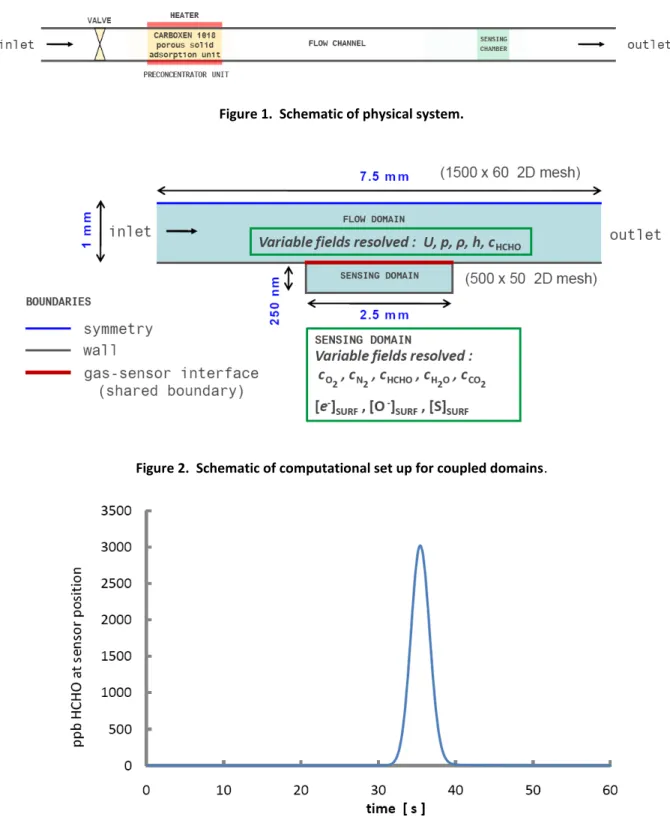
Figure 1 shows a schematic depiction of the physical system constructed for the project.
The system is operated as follows: HCHO from the ambient air is adsorbed in the porous solid during collection period ranging from 15 to 25 minutes. To desorb the HCHO, the upstream valve is closed, and a heater around the porous solid brings the unit to 120 C (about 70 C required for full desorption). The valve is then opened, and a pump moves the pulse of desorbed HCHO along channel to the sensing chamber where it interacts with the solid oxide transducer producing a signal.
3 2.1 Flow Domain
The experimental system consisted of 5 mm diameter tubing with various valves and connections for versatile operation. The sensor was located about 152 cm downstream of the preconcentrator, which was a carboxen plug, 1 cm in length. The preconcentrator was loaded with ambient air containing HCHO for adsorption cycles of 15 minutes. The pumping rate was 50 mL/min.
The physics in the flow domain were governed by the following set of equations: Navier-Stokes equation for compressible air (momentum balance):
U
U
p
S
t
U
)
(
(1) A parabolic inlet velocity profile was imposed, along with no-slip wall conditions and zero-gradient at the outlet. Flow through the porous solid (carboxen) zone was modeled with momentum sink source terms from the Darcy-Forchheimer equation. [13]. Explicitly,U
F
U
D
S
21|
|
(2)where the parameters D and F are respectively viscous and inertial loss coefficients. For the carboxen plug, D was determined to be 5.46 x 10⁷ [m-2] and F was 75.8 [m-1].
The transport of a compressible gas was modeled using the energy equation for enthalpy (ideal gas treatment) : p U t p h t h eff ) ( (3) The convection-diffusion equation was used to model the transport of a small amount of analyte (HCHO) in an air stream : R c U c D t c c 2 (4)
Above, c represents the concentration of HCHO [mol/m3] with an initial condition specified in the carboxen zone for pulse generation cases, or a temporal profile on the inlet for the coupled cases. Zero-gradient conditions applied on other boundaries.
2.2 Sensor
The sensor was a thin film of SnO2-NiO, with a Ni:Sn mole ratio of 0.2. The films were about 250 nm
4 were used to determine these values. The sensing performance was optimal at 300 C, in terms of considering all influencing factors such as kinetic response, heating power requirements and resistance resolution in a measureable range.
The sensing functionality arises from the diffusion of HCHO into the porous solid sensor film, and its subsequent catalytic oxidation on the solid surface. The transport of HCHO into the porous SnO2-NiO
film occurred by Knudsen diffusion. [15] Eqn 5 shown below for the transport of species in the gas phase by diffusion, was solved for HCHO as well as O2 and N2 (components of air) and H2O and CO2,
reaction products. R c D t c 2 (5)
Details on the determination of D in Eqn 5 are given in [16]. The source terms R in Eqn 5 account for the chemical reactions which occur among the diffusing gases and surface species, arising from the catalytic oxidation mechanism for HCHO [7,16] on SnO2-NiO, outlined below:
Ionization: 2 SURF 2 1
O
S
1O
1 k ke
(6) Catalytic oxidation:e
k kS
O
H
CO
HCHO
O
2 2 1 2 2 1 2 1 SURF 2 2 (7)Above, S is the concentration of available adsorption sites [mol/m2] on the SnO2-NiO surface. The total
number of surface sites (S0) was calculated in [16]. The mass action calculation for the equilibrium
concentrations of the species specified by the four constants (k1, k-1, k2 and k-2) in Eqns 6 and 7, also
made use of the relations that [S0]SURF = [S]SURF + [O
-]
SURF, as well as [CO2] = [H2O] and also that [HCHO] and
[O2] are inputs from the local gas concentrations.
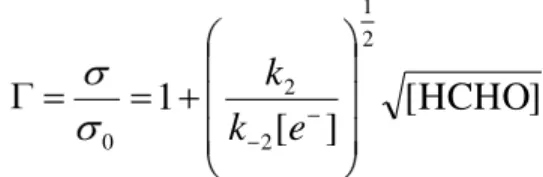
Finally, the conductivity in the SnO2-NiO was determined based on a model developed by Windischmann
and Mark [17], where σ is the local conductivity, and σ0 is the conductivity in the absence of HCHO.
Here,
]
HCHO
[
]
[
1
2 1 2 2 0k
e
k
(8)2.3 Coupled Flow and Sensing Domains
5 The coupling was achieved via the concentration fields of transported HCHO in the flow domain, and HCHO in the gas phase in the pores of the porous solid sensor film, on the shared boundary at the gas-sensor interface. For the flow domain, this boundary condition for making use of c or [HCHO] involved setting a diffusion rate based velocity, Uc at the interface, as:
y
M
c
c
D
n
U
c(
)
HCHO_Knudsen(
BDY_gas BDY_CELL_sensor)
W_air (9)For the cHCHO equation in the sensor film, c or [HCHO] was set as:
gas BDY_ BDY_sensor c
c (10)
Eqns 9 and 10 ensure that the HCHO flux is equal at the gas-sensor interface in both domains. The two domains were solved simultaneously in this approach. The open-source C++ code, OpenFOAM was used on two-dimensional meshes. Convergence criteria were set for residuals less than 10-6.
3. MODEL CALIBRATION AND VALIDATION
Initial calculations were performed to ensure the correctness and coherence of the behaviours in both the flow domain and the sensing domain, by comparing simulated output with experimental data.
3.1 Flow Domain
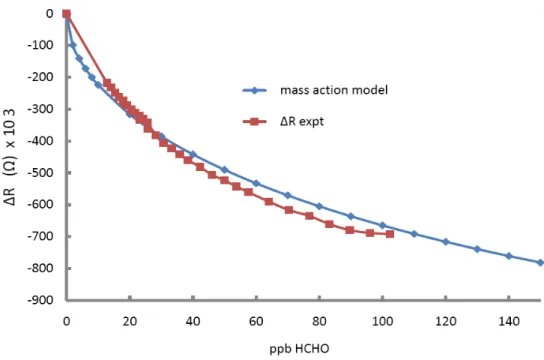
Initial concentrations in the carboxen zone (see Figure 1) were calculated based on a 15 minute
adsorption period at a 50 mL/min flow rate for various ambient concentrations of HCHO. For example, for ambient 40 ppb HCHO, a 1 cm carboxen plug begins at 133290 ppb HCHO after the adsorption process. At t = 0, open flow is begun and HCHO concentration monitored at a point 152 cm downstream (sensor location). Figure 3 shows the pulse of HCHO at the sensor location. This pulse is used as a temporal inlet concentration condition for subsequent coupled simulations. The pulse corresponded to measured observations which showed a maximum HCHO signal at about 38 seconds. In general, pulse peaks become broader and lower as the flow rate is decreased.
The above development was extended to examine pulse delivery data obtained on a different
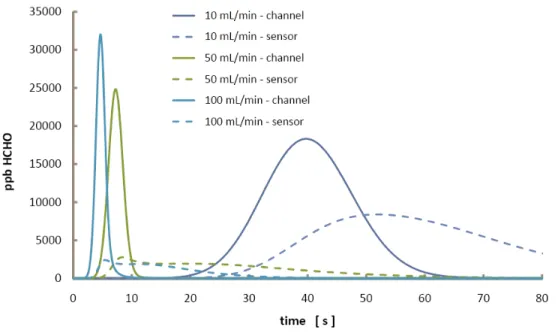
experimental system built for designing and optimizing the preconcentrator function, which made use of a commercially available HCHO sensor (Membrapor AG, Wallisellen, Switzerland, model no. CH20/M-10). Figure 4 shows experimental sensor signals plotted against different ambient HCHO concentrations that had been enriched in the preconcentrator. For simulated data, the sensor signal was scaled from the pulse peak height to sensor signal height obtained using the sensing model of Section 2.2, to match the sensor signal from the commercial unit which was lower. The ratio of sensor signals for the SnO2
-NiO film and the commercial unit was roughly constant for both the 10 ppb and 30 ppb points. Two distinct linear regions can be observed in the experimental data. Above 30 ppb ambient (feed) HCHO, the data show a non-zero intercept, indicating incomplete adsorption during the HCHO collection
6 period. It was observed that the ratio of the pulse peak height to signal peak height was independent of feed concentration. This allowed curve fitting an amount of HCHO loss proportional to the difference in feed concentration and 30 ppb, the level at which full ambient HCHO capture could be assumed. In this way it was possible to simulate the higher ambient feed concentration pulses with incomplete HCHO capture with a 1 cm carboxen plug.
3.2 Sensor
From Eqn 7, it can be seen that the ratio of k2/k-2 determines an equilibrium response in the sensor film,
while their absolute values would account for the dynamic response.
Estimating responses for data collected at equilibrium (Figure 5), along with the sensor response to feed gasses requiring a chamber volume exchange (Figure 6), allowed the determination of k2 and k-2 . Given
that the reactions took place on SnO2, activation energies were taken from previous work, [16] while the
catalytic effect of the nickel was taken as the basis for an increased pre-exponential constant. The sensor model (Eqns 5 through 8) was applied to experimental data from [14], shown in Figure 6a. The case for 14 ppb ambient HCHO was simulated as an example case. The flow rate supplying HCHO to the sensing chamber was known to require a time of 10 minutes to completely fill the chamber, or displace the gas initially present. Thus, for this case, the boundary condition at the gas-sensor interface was set as:
)
ppb
14
,
600
ppb
14
min(
]
HCHO
[
t
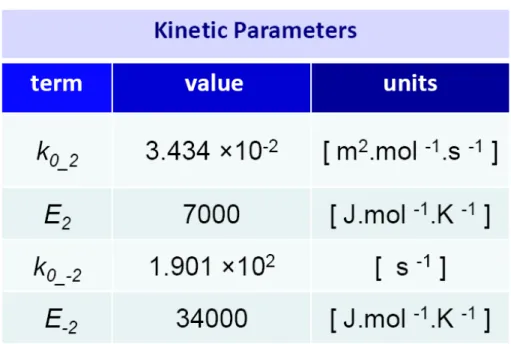
(11) Eqn 11 produces a linear increase in interfacial HCHO concentration over time up to 10 minutes (600 s), at which point it remains at a constant plateau value of 14 ppb. The simulated result shown in Figure 6b shows a close fit of the dynamic response of the model with the measured data through optimizing estimates of k2 and k-2 . This result indicates that the sensor response time is primarily attributable tothe time required to transport sufficient gas for one volume exchange in the sensing chamber. The kinetic parameters for the HCHO catalytic oxidation reaction (Eqn 7) are shown in Table 1.
A calculation was made at 30 ppb to test dynamic response of the sensor operating at 300 C in contact with a 30 ppb ambient HCHO environment. The output signal reached 99% of the theoretical
7 4. RESULTS AND DISCUSSION
HCHO pulses generated as described in Section 2.1 were used as cHCHO inlet conditions for coupled
system simulations. For these coupled cases, the flow domain was the one shown in Figure 2, with a channel length of 7.5 mm, and in contact with a 2.5 mm wide sensor surface.
Figure 7 shows example output from the coupled simulation. The sensor signal is based on the domain average of Γ inside the SnO2-NiO film. The channel concentration is taken as the [HCHO] at the
gas-sensor interface. Figure 8 shows concentration contours for HCHO at a number of time levels as the pulse passes the sensor. What can be observed here is the comparatively slower HCHO transport in the sensing domain. For the cases at 4 s and 12 s, the leading and trailing sections of the flow domain HCHO peak are passing over the sensor. The HCHO is slow to diffuse into the sensor and the concentration in the sensing domain is closer in value to points in the flow domain well forward of the sensor position. The flow pulse peak occurred at t = 7.3 s, while the sensor signal peak occurred at t = 8.5 s. There is also a thermal effect occurring at the gas-sensor interface. There is a fairly sharp temperature gradient here with the bulk of the flow domain at 25 C, and the sensor film at 300 C. HCHO concentrations at near equivalent mole fraction in both domains will show a kind of step decrease in molar concentration because of the higher temperature inside the sensor film. This effect seems most pronounced and visible in the 8 s and 10 s cases in Figure 8.
The fully coupled results discussed above appear to be novel. While transport modeling has been regularly undertaken inside sensor films [6], the coupled effects of external gas phase transport delivering analyte have not been simultaneously considered. A number of recent papers exist which study the transport of analyte in the external gas phase in a sensing system with preconcentraion, and which provide comment on how the flow fields and other associated parameters would be expected to influence sensor behaviour. [18-21] One paper was found where the flow field was simulated which included a sensor surface source term for analyte, thereby estimating the sensor-gas phase interface concentration of analyte in a steady state flow field. [21] The fully coupled flow field and sensor environments presented here represent a new advance in this field of study.
The effect of flow rate on the sensor response is shown in Figure 9. It can be seen that the ratio of the pulse peak to the signal peak heights decreases with flow rate. A lower flow rate allows the HCHO pulse to diffuse axially, such that it has a longer transit time over the sensor interface along with a lower maximum concentration value. At higher flow rates, the lag time between the peak channel concentration and the maximum observed sensor signal becomes shorter.
The geometry of the sensing chamber also has an effect on the system performance. Good design needs to consider the general contacting pattern of the flow over the sensor surface, with the view that a more uniform flow field makes sensor signal interpretation less complicated. Simulations which vary the channel height of above the gas-sensor interface demonstrate this concept. Figure 10 shows the effects of varying the channel height in the range from 2 mm to 10 mm. For these cases, rather than employ a constant volumetric flow rate, an equivalent mean velocity (based on the 2 mm channel
8 height) was used to allow consistent dynamic comparisons. As channel height increases, the ratio of the pulse peak to the sensor signal peak is invariant, however with wider channels, the increased flow volume serves to broaden and dilute the HCHO pulse.
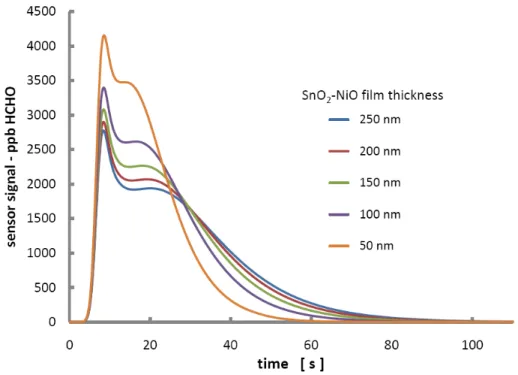
In the interests of a obtaining sensor signal which is more representative of the HCHO concentration present in the pulse peak, simulations were run with films of different thicknesses. The laboratory films were 250 nm thick. This thickness is required to ensure a defect-free contiguous SnO2-NiO domain,
ensuring measureable and reproducible conductivity. Hypothetical films were considered in simulations in the 200 nm to 50 nm range. Figure 11 shows the effects of using thinner sensor films. The ratio of pulse peak to signal peak increases as films become thinner. It can also be seen that the residence time of the HCHO inside the SnO2-NiO film is shorter with thinner films. In general, it would be desirable to
have as thin a sensor film as possible.
At the outset of the project, the preconcentrator was designed into the system as existing low cost HCHO sensors were only sensitive in the ppm range. Experimental testing and theoretical modeling investigation has shown that the sensitivity and the response time of the SnO2-NiO materials developed
here may be suitable for ambient HCHO sensing without preconcentration. The model as developed here was adapted to run in a steady-state regime, with the inlet condition of the flow domain set at a constant ambient HCHO concentration. Figure 12 shows the results of these simulations. It can be seen that for flow rates above 1 mL/min, a sensor signal over 95% of the equilibrium signal will be obtained. At 5 mL/min over 98% of equilibrium signal is achieved and close to 100% can be obtained at flows over 20 mL/min. The contours on the left in Figure 12 show how the catalytic oxidation of the HCHO depletes the HCHO concentration in the flow domain at low flow rates, as it is not being supplied quickly enough to match the rate of reaction. The contour at 10 mL/min is indistinguishable from the ambient 40 ppb HCHO concentration.
5. CONCLUSIONS
The project has modeled and simulated the simultaneous processes of a gas stream transporting HCHO, and the ensuing sensor response from its diffusion into and reaction inside an adjacent porous SnO2-NiO
film. The chemical reaction mechanism and kinetic parameters for the catalytic oxidation of HCHO on an SnO2-NiO surface and accompanying electroceramic response have been determined. The study has
shown the effects of gas flow rate, channel height, film thickness and HCHO concentration on the sensor response, providing a basis for calibrating output signals in order to report ambient HCHO levels. Results have been obtained for both steady state and transient cases. The simultaneous simulation of the flow field transport of HCHO sensor surface, and its uptake and chemical reaction giving rise to the sensor response represents a novel advance in the modeling of sensor systems. Finally, the SnO2-NiO
films produced experimentally may exhibit a sufficient degree of sensitivity and kinetic response for HCHO sensing without requiring a preconcentrator unit.
9 REFERENCES
1. Residential Indoor Air Quality Guideline: Formaldehyde. April 15, 2006. Health Canada Publication: 4120, Cat.: H128-1/06-432-1E, ISBN: 0-662-42661-4.
2. M. Possanzini and V. Di Palo, Determination of formaldehyde and acetaldehyde in air by HPLC with fluorescence detection, Chromatographia, 46 [5-6] (1997) 235-240.
3. E. Grosjean, P.G. Green and D. Grosjean, Liquid Chromatography Analysis of Carbonyl
(2,4-Dinitrophenyl)hydrazones with Detection by Diode Array Ultraviolet Spectroscopy and by Atmospheric Pressure Negative Chemical Ionization Mass Spectrometry, Anal. Chem., 71 [9] (1999) 1851-1861. 4. K. Kawamura, K. Kermana, M. Fujihara, N. Nagatani, T. Hashiba and E. Tamiya, Development of a novel hand-held formaldehyde gas sensor for the rapid detection of sick building syndrome, Sens. Actuators B: Chem., 105, [2] (2005) 495-501.
5. G. Eranna, B.C. Joshi, D.P. Runthala and R.P. Gupta, Oxide materials for development of integrated gas sensors – a comprehensive review, Critical Reviews in Solid State and Materials Science, 29 [3] (2004) 111-188.
6. N. Yamazoe, Towards Innovations of Gas Sensor Technology, Sens. Actuators B: Chem., 108 [1-2] (2005) 2-14 .
7. P. Lv, Z.A. Tang, J. Yu, F.T. Zhang, G.F Wei, Z. Huang and Y. Hu, Study on a micro-gas sensor with SnO2-NiO sensitive film for indoor formaldehyde detection, Sens. Actuators B: Chem., 132 [1] (2008)
74-80.
8. Y.H. Wang, C.Y. Lee, C.H. Lin and L.M. Fu, Enhanced sensing characteristics in MEMS-based formaldehyde gas sensors, Microsyst. Technol., 14 [7] (2008) 995-1000.
9. J.A. Dirksen, K. Duval and T.A. Ring, NiO thin-film formaldehyde gas sensor, Sens. Actuators B: Chem., 80 [2] (2001) 106-115.
10. C.Y. Lee, CM. Chiang, Y.H. Wang and R.H. Ma, A self-heating gas sensor with integrated NiO thin-film for formaldehyde detection, Sens. Actuators B: Chem., 122 [2] (2007) 503-510.
11. J. Jagiello and W. Betz, Characterization of pore structure of carbon molecular sieves using DFT analysis of Ar and H2 adsorption data, Microporous and Mesoporous Materials, 108 [1-3] (2008) 117-
122.
12. J. Brown and B. Shirley, A Tool for Selecting an Adsorbent for Thermal Desorption Applications, Supelco Technical Report T402025, Supelco Inc., Bellefonte, PA, (2001).
10 13. P. Forchheimer, Wasserbewegung durch Boden, Z. Ver. Deutsch. Ing., 45 (1901) 1782-1788.
14. J.L. Dunford, J.J. Tunney and X. Du, SnO2/NiO Composite Thin Films for Formaldehyde Detection, in
Proc. 9th Ann. IEEE Conf. Sensors, Waikoloa, HI, USA, Nov. 1-4, 2010, 4 pp.
15. G. Sakai, N. Matsunaga, K. Shimanoe, N. Yamazoe, Theory of gas-diffusion controlled sensitivity for thin film semiconductor gas sensor, Sens. Actuators B: Chem., 80 [2] (2001) 125–131.
16. K. Darcovich, F.F. Garcia, C.A. Jeffrey, J.J. Tunney and M.L. Post, Coupled microstructural and transport effects in n-type sensor response modeling for thin layers, Sens. Actuators A : Phys., 147 [2] (2008) 378–386
17. H. Windischmann and P. Mark, A model for the operation of a thin-film SnOx
conductance-modulation carbon monoxide sensor, J. Electrochem. Soc., 126 [4] (1979) 627–633.
18. B. Alfeeli, D.Cho, M. Ashraf-Khorassani, L.T. Taylor and M. Agaha, MEMS-based multi-inlet/outlet preconcentrator coated by inkjet printing of polymer adsorbents, Sens. Actuators B: Chem., 133 [1] (2008) 24-32.
19. R. Inglés, J. Pallarés, J. L. Ramirez and E. Llobet, Fluid Flow Simulation of Preconcentration
Membranes Using Finite Elements Tools, in Proc. European Comsol Conference 2009, Milan, Oct. 14-16, 2009, 4 pp.
20. K. Yang and J.Wu, Numerical study of in situ preconcentration for rapid and sensitive nanoparticle detection, Biomicrofluidics, 4 [3] (2010) 034106-1-034106-15.
21. R.P. Manginell, S. Radhakrishnan, M. Shariati, A.L. Robinson, J.A. Ellison and R.J. Simonson, Two-Dimensional Modeling and Simulation of Mass Transport in Microfabricated Preconcentrators, IEEE Sensors J., 7 [7] (2007) 1032-1041.
11 FIGURES.
Figure 1. Schematic of physical system.
Figure 2. Schematic of computational set up for coupled domains.
Figure 3. HCHO pulse in flow channel at sensor location for ambient 40 ppb HCHO adsorbed for 15 minutes at 50 mL/min flow rate.
12
Figure 4. HCHO signal from sensor in preconcentrator design test equipment as a function of HCHO concentration in feed gas. Data taken for a 15 minute adsorption period at a 50 mL/min flow rate.
13
Figure 5. Experimental and simulated resistivity changes for a range of equilibrium HCHO concentrations in the SnO2-NiO thin film.
Figure 6. (a) Experimental data for HCHO sensor response for HCHO in 10 to 30 ppb range. (b) Experimental and simulated sensor response for 14 ppb case.
(a)
14
Figure 7. Simulated data for sensor response to a desorbed pulse of HCHO at 50 mL/min. The pulse was generated by an adsorption cycle of 15 minutes at 50 mL/min with ambient HCHO at 40 ppb.
15
Figure 8. HCHO concentration contours in both the flow and sensing domains at a number of time levels. The pulse was generated by an adsorption cycle of 15 minutes at 50 mL/min with ambient HCHO at 40 ppb. Note that the concentration scale changes in each case to provide visual resolution. The sensing domain is magnified by a factor of 106 in the y-direction.
16
Figure 9. Sensor signal and HCHO concentration in the flow channel as a function of flow rate. Data for cases with a 15 minute adsorption cycle with ambient HCHO at 40 ppb at 50 mL/min flow rate.
Figure 10. Sensor signal and HCHO concentration in the flow channel as a function of channel height. Data for cases with a 15 minute adsorption cycle with ambient HCHO at 40 ppb at an average inlet velocity of 0.0425 m/s.
17
Figure 11. Simulated results for sensor signals obtained from SnO2-NiO films of different thicknesses. The data
are for a 15 minute adsorption cycle with ambient HCHO at 40 ppb at a 50 mL/min flow rate. For reference, the HCHO peak height in the channel is 28800 ppb.
Figure 12. HCHO concentration contours in the flow domain for a range of flow rates. On the right is a plot of the steady state sensor response versus the flow rate, as compared to the equilibrium response.
18 TABLES