Quench Sensitivity of High Pressure Vacuum Die Castings and Permanent Mold Castings of Aural-3/5 Alloys
By Mengyun Liu
Master Candidate: Mengyun Liu Permanent code: LIUM03529309
Director: Prof. X.Grant Chen Co-director: Prof. Zhan Zhang
Québec, Canada
I
Abstract
The quench sensitivities of Al-10wt%Si-0.5wt%Mg alloy (AuralTM-3) in
permanent mold (PM) and high pressure vacuum die (HPVD) castings as well as the quench sensitivity of Al-7wt%Si-0.2wt%Mg alloy (AuralTM-5) in HPVD
have been investigated by temperature-transformation (TTT) and time-temperature-property (TTP) curves using an interrupted quench technique. The sensitivity temperature range of AuralTM- 3 HPVD is from 275 oC to 450 oC, and
its nose temperature is 375oC, while the nose temperature of AuralTM- 3 PM is
350 oC and its sensitivity temperature range is from 255 oC to 430 oC. The nose
temperature of AuralTM 5 HPVD is 350 oC and its quench sensitivity temperature
range is from 260 to 430 oC. The mechanical properties of the alloys with various
cooling rates were predicted using quench factor analysis method. For AuralTM
-3 HPVD, the cooling rate should be higher than 20 oC/s to obtain more than 95%
of the hardness on T6 condition, which is 17 oC/s for AuralTM-3 PM and 6 oC/s
for AuralTM 5 HPVD. Different types of Mg
2Si particles precipitated from
supersaturated aluminum matrix during isothermal holding at various temperature. At nose temperature, coarse Mg2Si particles mainly precipitated
along grain boundaries in HPVD samples, and however, in PM samples, rod-like Mg2Si precipitates were observed nucleating on Mn-containing dispersoids in
aluminum grains. The temperatures of β’- Mg2Si and β- Mg2Si particles
precipitated from supersaturated aluminum matrix in AuralTM-3 HPVD are lower
II
calorimetry (DSC) analysis. The phase transformation kinetics of AuralTM-5
HPVD during isothermal holding have been discussed. AuralTM-3 HPVD has
higher quench sensitivity than AuralTM-3 PM and AuralTM-5 HPVD.
The difference of quench sensitivity between AuralTM-3 HPVD and PM
is mainly due to the microstructure variation of both castings. HPVD provided much finer microstructure than PM due to rapid injection speed of liquid metal and high pressure. Fine microstructure in HPVD comes along with a large amount of grain boundaries, which act as nucleation sites and greatly reduced the nucleation energy required for precipitation during insufficient quenching. On the other hand, PM casting has a relatively larger amount of dispersoids, which are in aid of precipitation during insufficient quenching. The TTP/TTT and DSC results showed that the effect of grain boundaries in HPVD is larger than dispersoids in PM, which leads to higher quench sensitivity in AuralTM-3
HPVD.
As for AuralTM-5 and AuralTM-3 HPVD, the difference of their quench
sensitivity is caused by the concentration of alloying elements. AuralTM-5 has
lower concentrations of Si and Mg that markedly reduced the driving force of precipitation. On the other hand, the larger grain size in AuralTM-5 diminished
the grain boundary precipitation. Thus, the quench sensitivity of AuralTM-5 is
III
Résumé
La sensibilité à la trempe du moule permanent (PM) Al-10wt%Si-0.5wt%Mg (AuralTM-3) et du moulage sous vide à haute pression (HPVD) and
Al-7wt%Si-0.2wt%Mg (AuralTM-5) HPVD ont été étudiés par des courbes de
temps-température-transformation (TTT) et de temps-température-propriété (TTP) en utilisant une technique de trempe interrompue. La plage de température de sensibilité de l'AuralTM-3 HPVD se situe entre 275 oC et 450 oC et la
température du nez est de 375 oC, tandis que la température du nez des moules
permanents est de 350 oC et la plage de sensibilité de 255 oC à 430 oC. La
température du nez de l'AuralTM 5 HPVD est de 350oC. Sa plage de température
de trempe est de 260-430oC. Les propriétés mécaniques des pièces coulées avec
différentes vitesses de refroidissement ont été prédites en utilisant une méthode d'analyse par facteur de trempe. Pour le HPVD AuralTM-3, la vitesse de
refroidissement serait supérieure à 20 oC/s pour obtenir plus de 95% de la dureté
à l'état T6, soit 17 oC/s pour l'AuralTM-3 PM et 6 oC/s pour l'AuralTM 5 HPVD.
Différents types de particules de Mg2Si précipitent à partir de la matrice
d'aluminium sursaturée au cours de la tenue isotherme à différentes températures. À la température du nez, les particules grossières de Mg2Si précipitent
principalement le long des joints de grains dans les échantillons de HPVD. Cependant, pour les moules permanents, des précipités de Mg2Si en forme de
bâtonnets ont été observés dans des grains d'aluminium. Les températures des particules β 'et β précipitées à partir de la matrice d'aluminium sursaturée dans l'AuralTM-3 HPVD sont inférieures à celles de l'AuralTM-3 ( PM ) selon
IV
l'analyse par calorimétrie différentielle à balayage (DSC). La cinétique de transformation de phase du HPVD AuralTM-5 au cours de la tenue isotherme a
été discutée. AuralTM-3 HPVD a une sensibilité à la trempe plus élevée que
l'AuralTM-3 PM et l'AuralTM-5 HPVD.
La différence de sensibilité à la trempe entre l'AuralTM-3 HPVD et les
moules permanents est principalement due à la divergence de la microstructure des pièces moulées. HPVD a fourni une microstructure beaucoup plus fine que les particules en raison de la vitesse d'injection rapide du métal liquide et de la haute pression. La microstructure fine s'accompagne d'une grande quantité de joints de grains. Il agirait comme des sites de nucléation et réduirait considérablement l'énergie de nucléation nécessaire à la précipitation lors d'une trempe insuffisante. Par ailleurs, les particules ont une quantité relativement plus grande de dispersoïdes qui aideraient à précipiter lors d'une trempe insuffisante. Mais les résultats du TTP / TTT et du DSC ont montré que l'effet des joints de grains dans le HPVD est plus important que celui des dispersoïdes dans les moules permanents, ce qui conduit à une sensibilité accrue à la trempe dans le HPVD AuralTM-3.
En ce qui concerne l'AuralTM-5 et l'AuralTM-3 HPVD, la différence de
sensibilité à la trempe est due à la concentration des éléments précipités. AuralTM-5 a une concentration plus faible de Si et de Mg, ce qui réduit nettement
la force motrice des précipitations. D’un autre côté, la plus grande taille de grain dans l'AuralTM-5 a diminué la précipitation des joints de grains. Ainsi, la
V
sensibilité à la trempe d'AuralTM-5 est beaucoup plus faible que celle d'AuralTM
VI
Acknowledgement
First and foremost, it is with immense gratitude that I acknowledge the support and help of my two directors Prof. X Grant Chen and Prof. Zhan Zhang. Prof. Chen always gives me valuable and constructive suggestions during the planning and development of this research work. Prof. Zhang also offered functional guidance and timely help in my study. Without their help, I wouldn’t be able to fulfill my goal of completing a master’s degree successfully.
I am indebted to my many colleagues who supported me. They made my oversea studying much more fun and easier. Those includes Chen Li, Wei Xu, Sinan Chen, Xiaoming Qian, Xingli Chen, Zhixing Chen, Shuai Wang, Dong Li, Anil Arici.
In addition, I would like to express my profound gratitude to my host family parents Jean Jacques Reigneau and Catherine Lamontagne. They have given me so much supports and encouragements and make me feel like home. Heartfelt thanks to my friend Tony Murphy for helping me to correct grammatic problems and polish the sentences in my thesis.
Finally, but by no means least, I cannot find words to express my gratitude to my family whose love and guidance are with me in whatever I pursue. I also thank my partner Yan Côté for the unceasing encouragement, support and attention.
This project was financially supported by Natural Science and Engineering Research Council of Canada (NSERC) and Rio Tinto Aluminum through the NSERC Industry Research Chair in the Metallurgy of Aluminum
VII
Transformation at Université du Québec à Chicoutimi (UQAC). I would like to thank both organizations for their support for my research.
VIII
Contents
Abstract ... I Résumé ... III Acknowledgement ... VI Contents ... VIII List of figures ... XII List of tables ... XVIIChapter 1 Introduction ... 1
1.1 Introduction ... 1
1.2 Definition of problems ... 3
1.3 Objectives ... 4
1.4 Methodology ... 5
Chapter 2 Review of literature ... 6
2.1 Al-Si alloy ... 6
2.2 Quench sensitivity ... 10
2.2.1 Quench factor analysis ... 12
2.3 Effect of casting processes ... 14
2.3.1 Casting processes ... 14
2.3.1.1 Permanent mold casting (PM) ... 14
IX
2.3.1.3 High pressure vacuum die casting ... 17
2.3.2 Effect of casting process on quench sensitivity ... 19
2.4 Effect of chemical composition ... 21
2.4.1 Effect of Magnesium on quench sensitivity ... 21
2.4.2 Effect of Silicon on quench sensitivity ... 23
2.4.3 Effect of Manganese on quench sensitivity ... 24
Chapter 3 Experimental procedures ... 27
3.1 Sample preparation ... 27
3.2 Microstructure Characterization ... 28
3.2.1 Optical Microscopy (OM) ... 28
3.2.2 Scanning Electron Microscopy (SEM) ... 29
3.2.3 Electron Backscatter Diffraction (EBSD) ... 30
3.2.4 Transmission electron microscopy (TEM) ... 31
3.2.5 Electrical Conductivity testing ... 31
3.2.6 Differential scanning calorimetry DSC testing ... 32
3.3 Mechanical Characterization ... 32
3.3.1 Tensile testing ... 32
3.3.2 Micro-hardness testing ... 34
3.4 Quench factor analysis ... 35
X
3.4.4 Instrumentation and Cooling Curves ... 36
3.4.5 Continuous cooling tests ... 37
3.4.6 Interrupted quench techniques for time-temperature transformation curves ... 38
Chapter 4 Results and discussion ... 40
4.1 Microstructures and mechanical properties of AuralTM 3 HPVD and PM ... 40
4.1.1 Microstructure of HPVD and PM samples ... 40
4.1.2 Mechanical properties on as-cast condition and after T6 heat treatment ... 47
4.1.3 Summary ... 50
4.2 Quench sensitivity of AuralTM 3 HPVD and PM ... 52
4.2.1 Time temperature transformation curves ... 52
4.2.2 Time –temperature-properties curves and quench factors ... 54
4.2.3 Differential scanning calorimetry ... 60
4.2.4 Microstructure observation ... 62
4.2.5 Discussion ... 66
4.2.6 Summary ... 68
4.3 The quench sensitivity of AuralTM 5 HPVD ... 68
4.3.1 Time temperature transformation curves ... 68
XI
4.3.3 Quench factor analysis ... 72
4.3.4 Avrami kinetics... 73
4.3.5 Microstructure analysis ... 75
4.3.6 Comparison of quench sensitivity of AuralTM 5 and AuralTM 3 HPVD castings ... 77
4.3.7 Summary ... 80
Chapter 5 Conclusion and suggestions for further work ... 81
5.1 Conclusions ... 81
5.2 Suggestions for further work ... 82
XII
List of figures
Chapter 2
Figure 2.1: Equilibrium binary Al-Si phase diagram21. ... 7
Figure 2.2:Pseudo binary phase diagram for AuralTM alloys (Al-0.50wt%Mn-0.5
wt%Mg-0.17 wt%Fe-10 wt%Si). ... 8 Figure 2.3: Pseudo binary phase diagram for AuralTM alloys (Al-0.50wt%Mn-0.2
wt%Mg-0.17 wt%Fe-7 wt%Si). ... 9 Figure 2.4: 99.5% TTP curves of A356 casting alloy, dash and solid indicate the TTP
curves under different calculation27. ... 12
Figure 2.5: (a) Permanent mold casting process (a) before casting (b) during casting30.
... 15 Figure 2.6 : Schematic view of a high pressure die casting machine30. ... 16
Figure 2.7:The principle of the high pressure vacuum die casting process36. ... 18
Figure 2.8: micrographes of the cross-section of the Al-8%Si alloy, showing the porosity distribution in: (a) high pressure die casting (b) high pressure vaccum die
casting36... 18
Figure 2.9: Microstructures of (a) Permanent mold casting, (b)high pressure die
casting17... 20
Figure 2.10: 95 pct iso-yield strength contours in three Al- Mg2Si alloys18. ... 22
Figure 2.11: Morphology of a-Al(Mn,Fe)Si particles depending on the Mn content. Acicular b-AlFeSi particles in: (a) A356-0.20Fe alloy; (b) A356-0.20Fe- 0.07Mn alloy;
XIII
Figure 2.12: TEM micrograph of 7050 wrought alloy slow cooled to room temperature showing a band of Mg(Zn2,AlCu) M-phase particles precipitated on Al3Zr
dispersoids48. ... 26
Chapter 3
Figure 3.1 : Red line : solution treatment (T4 : 500oC for 3h), Black lines: solution+aging treatment(T6: 500oC for 3h and 170oC for 2.5h). ... 28Figure 3.2: Clemex image analysis system with Nikon Eclipse ME600 optical microscope. ... 29
Figure 3.3: JEOL JSM-6480LV SEM system ... 30
Figure 3.4: JEM-2100 transmission electron microscopy. ... 31
Figure 3.5: Schematic illustration of Tensile Test Specimen ... 33
Figure 3.6: Red line: solution treatment (T4 : 500oC for 1h), Black line: solution+aging treatment(T6: 500oC for 1h and 170oC for 2.5h) ... 34
Figure 3.7: Schematic of heat treatments used in the procedure for time-temperature precipitates tests ... 36
Figure 3.8: Cooling curves for HPVD (line) and PM (dash). ... 38
Figure 3.9: Schematic of heat treatments used in the procedure for time-temperature transformation tests ... 39
Chapter 4
Figure 4.1: Microstructure of the as-cast HPVD sample: (a) optical images near cast surface and (b) at the center; SEM electron backscattered images near (c) cast surface and (d) at the center. ... 42XIV
Figure 4.2: (a) The secondary dendrite arm spacing (SDAS) and equivalent diameter of aluminum grains; (b) the equivalent diameter of Si, (c) primary Mg2Si and (d) Fe-rich
intermetallics along the cross section of PM and HPVD samples. d: the distance from one
edge to other; dmax: the sample thickness. ... 43
Figure 4.3: Microstructure of as-cast PM samples: optical images (a) near cast surface and (b) at the center; SEM electron backscattered image (c) near cast surface and
(d) at the center. ... 45 Figure 4.4: (a) Si (b) Mg distribution in the HPVD sample; (c) Si (d) Mg distribution
in the PM sample. ... 46 Figure 4.5: Microstructure in the sample center after T6 heat treated: optical images
of (a) HPVD and (b) PM samples; SEM backscattered electron image of (c) HPVD and
(d) PM samples. ... 47 Figure 4.6: Mechanical properties of HPVD and PM samples on as-cast condition:
(a) the hardness profile along the cross section and (b) the tensile properties. Tensile properties of HPVD are taken from Breton and Fourmann (2016)25. d: the distance from
one edge to other; dmax: the sample thickness. ... 50
Figure 4.7: Mechanical properties of HPVD and PM samples on T6-treated condition: (a) the hardness profile along the cross section and (b) the tensile propertie. Tensile properties of HPVD are taken from are taken from Ref.15. d: the distance from one edge
to other; dmax: the sample thickness. ... 50
Figure 4.8: (a) Effect of isothermal treatment on conductivity of as-quenched HPVD
XV
Figure 4.9: Effect of isothermal treatment on electrical conductivity of as-quenched
PM (a), TTT curve of PM (b). ... 54 Figure 4.10: Effect of isothermal treatment on hardness (a), and TTP curves (b) of
AuralTM-3 HPVD. ... 56
Figure 4.11 : Effect of isothermal treatment on hardness (a), and TTP curve (b) of
AuralTM-3 PM. ... 56
Figure 4.12 : TTP curves of 99.5% and 80% of maximum hardness of AuralTM-3
HPVD (solid) and AuralTM-3 PM (dash). ... 57
Figure 4.13 : Effect of cooling rate on quench factor and predicted hardness (a), and
on hardness drop (b) of HPVD. ... 60 Figure 4.14 Effect of cooling rate on quench factor and predicted hardness (a), and
on hardness drop (b) of PM. ... 60 Figure 4.15: Typical DSC heating flow curves of solution heat treated (500oC 3h)
AuralTM 3 HPVD (a), AuralTM 3 PM (b)... 62
Figure 4.16 : optical microstructure of solution heated (500oC for 3h) AuralTM 3
HPVD (a), and AuralTM 3 PM (b). ... 63
Figure 4.17 : EBSD mappings of solution treated HPVD (a), and PM (b). Dark lines
indicate that the misorientation is more than 15 degrees. ... 63 Figure 4.18: BF TEM images of precipitates in as-aged HPVD (a), and PM (b),
recorded near [001] direction. ... 65 Figure 4.19: BF TEM images of precipitates in aluminum matrix with SAD pattern
(a) and grain boundary of HPVD (b), isothermal treated at nose temperature for 300s,
XVI
Figure 4.20: TEM images of AuralTM 3 PM quenched specimens held at 360 °C for
300 s with SAD pattern. ... 65 Figure 4.21: the electrical conductivity evolution as function of isothermal
temperature and holding time (a); TTT curves of AuralTM-5 HPVD samples (b). ... 70
Figure 4.22: (a) hardness evolution as function of isothermal temperatures and
holding time; (b) TTP curve of AuralTM-3 HPVD samples. ... 71
Figure 4.23: (a) Effect of average cooling rate on quench factor and predicted hardness of AuralTM 5 HPVD alloy (b)drop in property vs. quenching rate of AuralTM 5
HPVD. ... 72 Figure 4.24 : Precipitate transformation as function of holding time during
isothermal treatment for AuralTM-5 HPVD samples. ... 74
Figure 4.25 : (a) optical microscope image of AuralTM 5 HPVD 500℃3h sample (b)
EBSD mapping images of AuralTM 5 HPVD 500℃ 3h sample. ... 76
Figure 4.26 : TEM images (a) AuralTM 5 HPVD as-quenched sample at 350℃ 300s
with SAD pattern (b) grain boundary of AuralTM 5 HPVD as-quenched sample at 350℃
300s. ... 76 Figure 4.27 : TEM image of A5 HPVD as-aged specimen with SAD pattern. ... 76 Figure 4.28 : TTP curves of 99.5% max hardness of AuralTM 5 HPVD (solid) and
XVII
List of tables
Chapter 2
Table 2.1: the chemical composition of AuralTM alloys25. ... 9
Chapter 3
Table 3.1: Chemical compositions of experimental alloys (wt.%) ... 28
Chapter 4
Table 4.1: Chemical compositions of experimental alloys (wt.%) ... 46Table 4.2 : Coefficients for TTP diagram of AuralTM-3 HPVD and PM. ... 56
Table 4.3 : Average values of onset and peak temperature of HPVD and PM. ... 62
Table 4.4 : Grain size and grain boundary length of AuralTM 3 HPVD and PM ... 63
Table 4.5 : Coefficients for TTP diagram of AuralTM 5 and AuralTM 3 HPVD. ... 71
Table 4.6 : Avrami parameters of AuralTM 5 HPVD alloy. ... 74
Table 4.7 : Parameters of quench sensitivity of AuralTM-3/5 HPVD. ... 79
1
Introduction
1.1 Introduction
AuralTM alloys as one group of the Al-Si foundry alloys have a superior
chemistry that offer a good balance of strength and ductility, while exhibiting excellent corrosion resistance without coating. Due to their very good fluidity, these alloys are well suited to the casting of thin and large structural components1.
The casting process is one of the key factors that affect microstructure and ultimately affect mechanical properties. Al-Si alloys are widely applied to high pressure vacuum die (HPVD) casting and permanent mold (PM) casting. In HPVD, molten metal is injected into a cavity at high speeds (30-50 m/s in the gate velocity for aluminum alloys), which allow to solidify under high pressures (up to 200 MPa in the cavity) and with a high cooling rate (up to ~103 Ks–1)2, 3.
The presence of vacuum in the die cavity generally reduces the casting flaws such as gas pores or shrinkage, allowing the application of heat treatment.
In the permanent mold (PM) casting, molten metal is poured into a metal mold under gravity with low speed (< 1.5 m/s in the gate for aluminum alloys) and solidified under low cooling rate (<10 Ks–1 for aluminum alloys)4, 5.
Permanent mold casting generally avoids porosity and blister, which results in desirable grain structures that have high strength and soundness and are a good candidate for heat treatment.
The chemical composition is another key factor that affects mechanical properties. In AuralTM alloys, Mg and Si concentration have a great impact on
2
Mg2Si phase during heat treatment. Needle-like β"- Mg2Si is hardening phase
which would greatly improve the mechanical properties after aging. Metastable states such as β"- Mg2Si are typically silicon enriched. Having an excess of Si
will meet the requirement of free energy thus predominance the metastable states and increase the mechanical properties. However, the presence of large, brittle, acicular flakes and plates of eutectic silicon leads to a substantial reduction of strength and elongation of the castings6, 7. Moreover, the increase in silicon
content will increase the eutectic fraction which is distributed throughout the microstructure, thus providing a deleterious effect upon the electrochemical corrosion resistance8. Studies9, 10 showed that with the increase of Mg
concentration, the mechanical properties would increase. However, Mg enrichment will promote the formation of the β-Mg2Si equilibrium phase11.
Some studies9, 12 also indicated that excessive addition of Mg would also
decreases the ductility and fracture toughness of the materials. Therefore, the enrichment of certain phases or states with either Mg or Si must be considered in order to properly balance the alloy.
The ability to form a non-hardenable phase during quenching is called quench sensitivity13. Quench factor analysis (QFA), introduced by Evancho and
Staley14 in the 1970s, is an effective way to study quench sensitivity. It indicates
that precipitation rate is an explicit function of temperature and the amount of solute remaining in solution15. Many studies14-17 have associated QFA with C
curves such as property (TTP) and time-temperature-transformation (TTT) curves to obtain important information such as the critical
3
time or nose temperature for precipitation during quenching, which can be used to predict the mechanical properties. Interrupted quenching techniques, in which a series of isothermal heating tests followed by quench are performed, have been widely used in determining C curves14. After mathematical calculations,
isothermal C curves can be used to investigate continuous cooling processes14.
1.2 Definition of problems
C curves studies initially started in wrought alloys, and gradually developed to casting alloys. Murat and Ralph18 constructed TTP curves based on yield
strength for D357 (Al-7Si-0.62Mg) alloy with unknown casting process, they reported that D357 is slightly less quench sensitive than 6061(Al-0.65Si-0.89Mg) and more quench sensitive than 6082(Al-0.92Si-0.59Mg), they thought the difference was caused by the Mg and Si concentration. Zhang and Zheng19
studied the quench sensitivity of Al-7 pct Si- 0.4 pct Mg (A356) permanent mold (PM) casting alloy and compared it to 6063 wrought (Al-0.6 pct Mg-0.4 pct Si) alloy. They reported that excessive Si content would act as nucleation sites and increase quench sensitivity. Except for solute concentration, non-equilibrium defects such as excess vacancies, dislocations, grain boundaries and inclusions will act as nucleation sites and affect quench sensitivity. Ives, et al.16 studied
AA2024 alloy by constructing TTP curves. They revealed initial precipitation occurred at the grain boundary, followed by further precipitation at dispersoids. Subsequent transformation from non-equilibrium phase to equilibrium phase was the dominant factor. Casting process has a great impact on microstructure,
4
as well as the formation of non-equilibrium defects. Chemical composition also has a huge influence on mechanical properties. However, very few studies showed the impact of casting process on the quench sensitivity and very few studies investigated the effect of chemical composition on the HPVD casting alloys. Investigating the impact of the casting processes on non-equilibrium defects and the impact of chemical compositions will help us better understand the quench sensitivity and kinetic of precipitation.
1.3 Objectives
The main objective of the present work is on investigation of quench sensitivity and microstructure characterization of both AuralTM-3 and 5 alloys by
high pressure vacuum die casting and permanent mold casting. To achieve the objective, several research works will be carried out as follows:
1. To demonstrate the effect of casting processes (HPVD vs PM) on quench sensitivity;
2. To investigate the effect of different chemical compositions (AuralTM-3
vs AuralTM-5) on quench sensitivity;
3. To determine the effect of cooling rates on mechanical properties; 4. To characterize microstructure to assist in understanding the precipitation behaviour during quenching.
5
1.4 Methodology
1. Samples were produced by high pressure vacuum die casting and permanent mold casting;
2. TTT and TTP curves of samples were constructed by using interrupted quenching techniques;
3. Quench factor analysis (QFA) was used to predict the mechanical properties of the castings with various cooling rates;
4. Differential scanning calorimetry (DSC) tests and Avrami kinetics were performed in aid of comparing the quench sensitivity;
5. Optical microscope was applied to observe the microstructure of the samples in as cast condition and solution heat treated condition; scanning electron microscope (SEM) equipped with energy-dispersive X-ray spectroscopy (EDS) was used to give an element analysis; transmission electron microscopy (TEM) was utilised in the isothermal heat treated samples to study precipitates.
6. Electron backscatter diffraction (EBSD) were used to study the grain size and grain boundary;
6
Review of literature
2.1 Al-Si alloy
With the development of automotive, electronics and aerospace industries, the demanding of light and high mechanical properties metal is increasing. As one kind of light metal alloys, the Al–Si alloys has an excellent combination of casting characteristics and mechanical properties19.
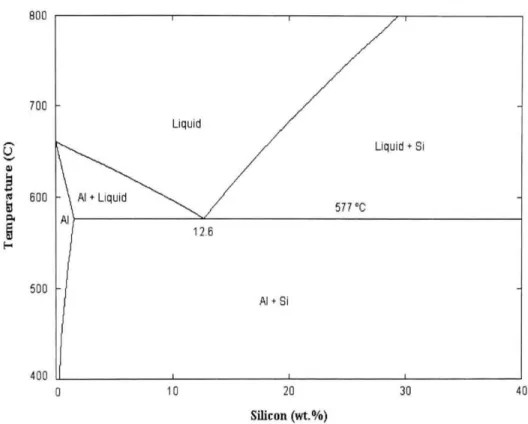
Al-Si alloy contain high silicon content, which results of excellent castability and good corrosion resistance20. As shown in figure 2.121, the Al-Si
binary system forms a simple eutectic at 577°C with 12.6% Si. It can also be seen that aluminum can dissolve a maximum of 1.62% Si into solid solution. Depending on the amount of silicon, the Al-Si casting alloys are divided into three groups22 : hypoeutectic alloys with Si contents between 5% and 10%,
eutectic alloys with 11%-13% Si, and hypereutectic alloys, commonly with a Si content between 14% and 20%. Generally, hypoeutectic and near eutectic Al-Si alloys are used when good castability and corrosion resistance are required, moreover, small additions of Mg and Cu are added in order to enhance their response to heat treatment. The increase in properties from heat treatment, results in an extensive use of these alloys in a variety of applications in the automotive, aerospace and military industry. However, the presence of large, brittle, acicular flakes and plates of eutectic silicon leads to a substantial reduction of strength and elongation of the castings6, 7. Modification of the eutectic silicon by small
additions of Na or Sr results in a noticeable improvement in strength, and a significant increase in elongation23-24.
7
Figure 2.1: Equilibrium binary Al-Si phase diagram21.
AuralTM alloys as one of the Al-Si alloy is a family of high performance
alloys specifically designed for demanding automotive safety and structural components, due to its superior light weight and high mechanical performance. AuralTM alloys have a superior chemistry content that offers a good balance of
strength and ductility, while also exhibiting excellent corrosion resistance. Due to their very good fluidity, these alloys are well suited to the casting of thin and large structural components1.
Figure 2.2 is the binary phase diagram of AuralTM alloys
(Al-0.50wt%Mn-0.5 wt%Mg-0.18 wt%Fe-10 wt%Si) obtained by Thermo-calc software. It illustrates the AuralTM 3 alloys phase diagram with the weight percentage of Si
ranges from 0-12%. As we can see, with the increase of Si, the solvus temperature of Mg2Si increases, and reaches the peak temperature (525oC) at 10
8
wt% of Si. Figure 2.3 is the binary phase diagram of AuralTM series alloys
(Al-0.50wt%Mn-0.2 wt%Mg-0.18 wt%Fe-7 wt%Si) with weight percentage of Si ranges from 0-7%. With 7 wt% of Si (AuralTM-5), the solvus temperature of
Mg2Si is 475 oC. With the increase of element concentration, the solvus
temperature also increases.
Figure 2.2:Pseudo binary phase diagram for AuralTM alloys (Al-0.50wt%Mn-0.5 wt%Mg-0.17
wt%Fe-10 wt%Si).
9
Figure 2.3: Pseudo binary phase diagram for AuralTM alloys (Al-0.50wt%Mn-0.2 wt%Mg-0.17
wt%Fe-7 wt%Si).
Table 2.1: the chemical composition of AuralTM alloys25.
As shown in the table 2.1, the differences between AuralTM-2 and AuralTM
-3 alloys are the addition of Mg and Sr. In AuralTM-2 alloy, it has 0.31 wt% of
Mg, which is much less than AuralTM-3 alloy (0.55 wt% Mg). Since Magnesium
Silicide (Mg2Si), is the main strengthening phase for AuralTM alloys, the
10
Meanwhile, the addition of Sr in AuralTM-3 alloy will modify the morphology of
the Si particle from needle shape into fibrous form, which increases the ductility. The difference between AuralTM-3 and AuralTM-5 alloys are the addition of
Si and Mg. In AuralTM-3 alloy, it has 10 wt% Si addition compares to 7 wt% in
AuralTM-5 alloy. Moreover, AuralTM-3 has twice as much Mg as in AuralTM-5
alloy. The increased addition of both Si and Mg in AuralTM-3 alloy will lead to
higher mechanical property than AuralTM-5 alloy.
2.2 Quench sensitivity
The tendency for an alloy to form non-hardnable precipitates during quenching is referring to as quench sensitivity26 .Quenching is a significant step,
because insufficient quenching often leads to a decrease in performance after ageing. When the quenching rate is relatively small, the coarse particles precipitate heterogeneously from the supersaturated solid solution and grow fast, leading to decrease in strength. However, excessive rapid cooling rate will increase the tendency for thick pieces to develop the severe residual stress and lead to distort14 . Different alloys have different sensitivity to quenching rate,
for a particular material, an appropriate quenching rate is necessary in order to maximize the mechanical properties and minimize the residual stress of the alloy.
The most straightforward approach for calculating quench sensitivity for a certain alloy after a continuous cooling process would simply be to introduce time-temperature-precipitation (TTP) and time-temperature-transformation (TTT) diagrams. Time-temperature-precipitation (TTP) diagrams deliver
11
important material data, such as quench sensitivity temperature and time ranges for precipitation during the quenching step of the solution heat treatment process. After mathematical calculations, isothermal TTP diagrams can be used to investigate continuous cooling processes. Ma et al.27 investigated the quench
sensitivity of Al-7 pct Si- 0.4 pct Mg (A356) solution heat treatment samples. They used quench factor analysis and constructed TTP curves, which has nose temperature at 425oC, as indicated in the figure 2.427. There are several factors
that would affect quench sensitivity. Zhang and Zheng19 investigated the quench
sensitivity of Al-Si-Mg alloy, they found that the heat treatment process would affect quench sensitivity, as to the fact that the underaged condition was less quench sensitive than the peak-aged condition. Chaudhury and Apelian28
investigated the quench sensitivity of Al-7 pct Si-Mg alloys with Mg content from 0.35-0.56 pct. They found that the alloy with the highest Mg content are the most sensitive to cooling rate, which implied highest quench sensitivity.
12
Figure 2.4: 99.5% TTP curves of A356 casting alloy, dash and solid indicate the TTP curves under different calculation27.
2.2.1
Quench factor analysis
The Quench factor is defined as the severity of a quench and can be quantified to a single number using integrated cooling rate and TTP curves29.
Quench factor has been generally used to predict properties under certain cooling rate.
When a precipitation hardenable alloy is cooled from above the solvus temperature, the change in free energy increases progressively as the difference between the present temperature and the solvus temperature increases. This change in free energy of the system with undercooling is the driving force for nucleation of a new phase. The nucleation rate I as a function of temperature T can be expressed as:
13
I = β exp(−ΔG ∕ kT) exp(−∆𝐺∗∕ kT) …….(2.1)15
Where
∆𝐺∗=activation energy for nucleation ΔG =activation energy for diffusion k =Boltzmann’s constant
β=parameter including density of potential nucleating sites
The nucleation kinetics of equilibrium precipitates, transition precipitates, and Guinier-Preston (GP) zones all show a C-shaped TTP behaviour. Nucleation rates are low at high temperatures (small undercooling) because the driving force for nucleation is small (low ΔG*). Precipitation rates are low at low temperatures (large undercooling) because diffusion kinetics are low (low ΔG )15.
All terms in this equation are essentially independent of temperature, except for ΔG*; the main factor controlling ΔG* is the driving force for precipitation, ΔG . For a particular alloy, ΔG is proportional to the degree of undercooling. It can be expressed as a function of temperature:
𝛥𝐺∗= 𝐾 𝑇 ∕ (𝑇 − 𝑇) ………..….….(2.2)15
Where 𝐾 is another constant. This expression was substituted in the reciprocal form of equation (2.1)15 to give
Ct(T)=-k1k2𝑒𝑥𝑝
( ) 𝑒𝑥𝑝 ………..….….(2.3)
15
Where
Ct(T) = the critical time for a certain amount of solute to precipitate
k1 = the natural logarithm of the fraction unprecipitated during isothermal
14
k2 = the constant associated with the reciprocal of the number of nucleation
sites;
k3 = the constant corresponding to the nucleus energy;
k4 = the constant related to the solvus temperature;
k5 = the constant related to the activation energy for diffusion;
R = the mole gas constant;
T = the thermodynamic temperature;
This is also the equation that will be used to calculate TTP curves.
2.3 Effect of casting processes
Previous studies show that there are some influencing factors that would affect mechanical properties. It is widely agreed that the mechanical properties are affected by the microstructure of the material. Casting process, besides chemical compositions and heat treatment process is one of key variables controlled the microstructures as well as mechanical properties.
2.3.1
Casting processes
2.3.1.1
Permanent mold casting (PM)
Permanent mold casting is a metal casting process that employs reusable molds ("permanent molds"), usually made from metal, where molten metal is poured into a mold that is made in two halves. In permanent mold casting, the metal is poured either directly by gravity or by pouring the metal into a cup attached to the mold and tilting it from a horizontal to a vertical position, as
15
indicated in the figure 2.530. The metal mold aids in quicker solidification of the
casting material, which results in highly desirable fine-grained structures that have high strength and soundness31. Permanent mold requires high production
volume to reduce its tool cost. However, the thermal fatigue and erosion usually limit the life of the molds. Thus, permanent mold considered as medium to high cost per part32.
Figure 2.5: (a) Permanent mold casting process (a) before casting (b) during casting30.
2.3.1.2
High pressure die casting (HPDC)
High pressure die casting (HPVD) production is economic and yields quicker results when compared to permanent mold casting. High pressure die casting can produce geometrically complex metal parts and is ideal for a large quantity of small- to medium-sized castings with low cost. It is a near-net shape manufacturing process in which molten metal is injected into a metal mould at high speeds and allowed to solidify under high pressures. It provides excellent
16
dimensional accuracy and the smooth surfaces33.A schematic view of high
pressure die casting is given in Figure 2.630.
Figure 2.6 : Schematic view of a high pressure die casting machine30.
However, the turbulence of the liquid alloy and the complex shape of the casting mold in die casting often result in porosity, since air and other gases are often trapped in the metal2. Porosity also affects the mechanical properties of the
product as it can concentrate the stress and speed fracture34. The formed pores,
especially the ones located adjacent to the casting surface, are likely to expand size during heat treatment, thus lead to blisters at the casting surface35. In
consequence of that, the die castings are normally non-heat treatable, that limits the application of the aluminium die castings. However, with the joint of vacuum system, almost all the air is positively evacuated from the mold, which largely reduces porosity36. In contrast to that, permanent mold castings typically contain
17
lower levels of entrapped gas, resulting in superior pressure tightness and soundness.
2.3.1.3
High pressure vacuum die casting
In high pressure vacuum die casting process, a vacuum valve is added into a die to evacuate the entrapped air in the cavity, thus creates a vacuum casting environment. As a result, the number density of the porosity is largely reduced. The potential applications for the high pressure vacuum die casting process are for the production of high integrity die casting components that require pressure tightness and good mechanical properties via heat treatment. Figure 2.736
illustrates the principle of the high pressure vacuum die casting process. After the metal was ladled into the injection chamber, the plunger moved past the pouring hole and sealed off the die cavity (Figure 2.7(a)). The vacuum valve was then activated and a lower than atmospheric pressure was created in the die cavity. The cavity was evacuated continuously from the beginning of die filling to the end (Figure 2.7 (b)).
18
Figure 2.7:The principle of the high pressure vacuum die casting process36.
Figure 2.836 illustrates the micrographs of the cross-section of the Al-8%Si
alloy under different casting processes. It shows that the high pressure die casting has higher number density of gas porosity than high pressure vacuum die casting.
Figure 2.8: micrographes of the cross-section of the Al-8%Si alloy, showing the porosity distribution in: (a) high pressure die casting (b) high pressure vaccum die casting36.
19
2.3.2
Effect of casting process on quench sensitivity
Different casting processes have different casting process parameters, for example injection speed, casting pressure and cooling rate, thus produce different microstructures. There is a wide agreement that the mechanical properties are affected by the microstructure of the material37. Okayasu et al.17
studied the mechanical properties of an Al–Si–Cu alloy (ADC12) produced by various casting processes. Figure 2.917 illustrated the microstructure of the
castings under high pressure die casting (HPDC) and permanent mold casting (PM) in as cast condition. They found that the microstructure of PM samples was formed mainly with coarse α-Al phase and needle shaped Si and Fe based eutectic structures. In contrast, a fine round α-Al phase and fine eutectic structures were observed for the HPDC. Due to fine round α-Al phase and fine eutectic structures, ultimate tensile stress and strain to failure for HPDC samples are higher than those for the PM samples. In addition, HPDC samples has higher hardness than PM in as cast condition. Those differences were caused by the solidification rate. In HPDC, high inject rate and high pressure produced fine microstructure, following by high mechanical properties.
20
Figure 2.9: Microstructures of (a) Permanent mold casting, (b)high pressure die casting17.
When the difference between the microstructures is excessively large, the impact of microstructure on the precipitation behavior cannot be ignored. Precipitation in solids is almost always heterogeneous38. Suitable nucleation
sites are non-equilibrium defects such as excess vacancies, dislocation, grain boundary, stacking faults, inclusions, and free surfaces, all of which increase the free energy of the material38. If the creation of a nucleus results in the destruction
of a defect, some free energy will be released thereby reducing (or even removing) the activation energy barrier38. The other planar defects such as
inclusion/matrix interfaces, stacking faults can behave in a similar way to grain boundaries in reducing activation energy barrier38. However, the stacking flaults
are much less potent sites due to their lower energy in comparison to grain boundary38. If the casting process results in large discrepancy in grain size as
well as the amount of grain boundary between the two alloys, that difference would affect the precipitation behaviour during quenching, leading to a difference in quench sensitivity.
21
2.4 Effect of chemical composition
2.4.1
Effect of Magnesium on quench sensitivity
Magnesium (Mg) is one of the important elements found in AuralTM series
aluminum alloys. Mg can associate with Si and form the compound Mg2Si phase
in the dendritic primary. In general, the Mg2Si precipitation sequence expected
upon aging remains: GP zone--β" --β' --β. Stoichiometry dictates that there are 2 Mg atoms for every Si atom in this compound. The equilibrium phase Mg2Si
or β- Mg2Si is usually Mg enriched. Metastable states such as β'- Mg2Si and β"-
Mg2Si are typically silicon enriched. Having an excess of Si will meet the
requirement of free energy thus predominance the metastable states. Mg enrichment will promote the formation of the equilibrium phase11.
After manufacturing, the alloys can sometimes be age hardened directly (T5 temper) or solutionized and then age hardened (T6 temper). The faster the alloy is quenched after the manufacturing operation for a T5 temper or after the solution treatment for a T6 temper, the less likely the non-hardening Mg2Si phase
will precipitate during quenching. Ideal hardening phases are β"- Mg2Si. The
optimized aging treatment after solution heat treatment should be designed to precipitate β"- Mg2Si 39. However, the non-hardening phase such as β’- Mg2Si
or β- Mg2Si would precipitate during slow quenching, consuming large amount
of Mg and Si solutes. The reduction of solute after quenching leaded to the decrease of strengthening phase in artificial aging, which ultimately decreased the hardness. Chaudhury and Apelian28 investigated the quench sensitivity of
22
with the highest Mg content are the most sensitive to cooling rate, which implied highest quench sensitivity. Tiryakioglu and Shuey18 investigated the quench
sensitivity of D357 (Al-7Si-0.6Mg) casting alloys by constructing TTP curves and compared it to 6061 (Al-0.7Si-0.9Mg) wrought alloy, as shown in the figure 2.1018. They found that 6061 has higher quench sensitivity due to the fact that it
has higher nose temperature and shorter critical time. The difference is caused by the chemical composition. As both alloys contain excessive Si levels, the low Si content of 6061 wrought alloy had a little impact on quench sensitivity. However, the 0.3 pct extra Mg addition greatly increased the supersaturation solubility which leaded to an increase of driving force of precipitation during quenching and increased the quench sensitivity.
23
2.4.2
Effect of Silicon on quench sensitivity
Silicon (Si) additions can improve the mechanical properties, such as modulus, strength, hardness and wear resistance of Al alloys and reduce the density and coefficient of thermal expansion40; however, the shape of the Si
phase is usually acicular, thus results in poor tensile properties6. Modification
can change the morphology of the Si particles from needle shape into fibrous form41.
Due to its high fluidity and low shrinkage, Si has excellent castability. Its low solubility and high hardness in Aluminum improve the abrasion resistance. Si reduces thermal expansion coefficient of Al-Si alloys8. Machinability is poor
with addition of silicon in Aluminum42.
G.T. Abdel-Jaber et al.40 investigated the mechanical behaviour of Al-Si
alloy against silicon content. It was found that with the increase of Si content from 3% to 12% the hardness increases. Zhang and Zheng19 studied the quench
sensitivity of Al-7 pct Si- 0.4 pct Mg (A356) permanent mold (PM) casting alloy and compared it to 6063 wrought (Al-0.6 pct Mg-0.4 pct Si) alloy. They reported that excessive Si content would act as nucleation sites and increase quench sensitivity. Robinson43 speculated that the increasing hardness drop during
isothermal test holding at 450oC with the prolonging of the holding time is not
only because of the growth of β" or β' to larger size β which has much less strengthening effect than the former, but also because of loss of Si in solution by its diffusion to eutectic Si particles. The study has been also proved by Tiryakioglu and Shuey18. They investigated the quench sensitivity of D357
(Al-24
7pct Si-0.6pct Mg) casting alloy. They reported that the quench sensitivity of D357 alloy is due to (a) the loss of Si to eutectic particles, (b) precipitation of β on eutectic Si particles, and (c) precipitation of β in the aluminum matrix. They also compared the D357 casting alloy to 6082 wrought alloy. The high quench sensitivity of D357 is due to the presence of Si particles. Zhong found that an excess of Mg slows down the natural aging process44.
2.4.3
Effect of Manganese on quench sensitivity
There are two ways to modify the morphology of β-Al5FeSi: postsolutionizing cooling rate and chemical modification45. Alloying elements
such as Mn has been used to replace the acicular β-phase with α-Al(Mn,Fe)Si which has granular or skeleton (or Chinese script) morphology, shown in figure 2.1141. Mn can also control the recrystallization via the formation of
25
Figure 2.11: Morphology of a-Al(Mn,Fe)Si particles depending on the Mn content. Acicular b-AlFeSi particles in: (a) A356-0.20Fe alloy; (b) A356-0.20Fe- 0.07Mn alloy; (c) A356-0.20Fe-0.13Mn alloy; and (d) A356-0.20Fe-0.20Mn alloy41.
The dispersoids formed during solution heat treatment can achieve strengthening effect of solute solution. Rometsch et al.47 reported that the density
of Mn containing dispersoids in cast and homogenised 6082, which are nucleation sites for non-hardening precipitates, such as β’- Mg2Si and β’’- Mg2Si,
and result in an increase of quench sensitivity. Robson48 investigated
microstructural evolution during quenching from homogenization. They found a large amount of Mg(Zn2, AlCu) M-phase particles precipitated on Al3Zr
dispersoids, as shown in figure 2.1148. This study confirmed that the dispersoids
would act as nucleation sites for precipitates during quenching. Mn dispersoids would affect quench sensitivity by influencing the precipitation behavior during quenching.
26
Figure 2.12: TEM micrograph of 7050 wrought alloy slow cooled to room temperature showing a band of Mg(Zn2,AlCu) M-phase particles precipitated on Al3Zr dispersoids48.
27
Experimental procedures
3.1 Sample preparation
The materials selected in the present study are the cast aluminum alloy AuralTM-3 and AuralTM-5. In this work, AuralTM-3 alloy was produced by two
different casting processes: (i) permanent mold casting (PM), (ii) high pressure vacuum die-casting (HPVD). AuralTM-5 alloy was produced by HPVD. For the
permanent mold casting, the AlSi10Mg alloy was prepared with commercially pure Al (99.7%), pure Mg (99.9%), Al-25%Mn, Al-25%Fe, and Al-50%Si master alloys. For each batch, approximately 3 kg of materials were melted in an electrical resistance furnace. The melt was kept at 720-750 ºC for 30 min and degassed for 15 min, and then poured into a permanent copper mold preheated at 250 ºC. The dimension of the cast plates is 100 mm x 80 mm with a thickness of 4 mm. The HPVD castings were produced by a cold chamber vacuum die casting machine, provided by Rio Tinto Aluminum. The dimension of the cast plates is 220 mm x 65 mm with a thickness of 2.5 mm. The chemical compositions of samples analyzed by an optical emission spectrometer are listed in Table 3.1. Some cast specimens were also subjected to T6 heat treatment with the solution treatment at 500 °C for 1 h followed by the aging at 170 °C for 2.5 h, shown in figure 3.1.
28
Table 3.1: Chemical compositions of experimental alloys (wt.%)
Alloys Castings Si Mn Mg Ti Sr Fe Al
AuralTM 3 PM 10.10 0.50 0.59 0.08 0.012 0.20 bal.
AuralTM 3 HPVD 10.10 0.50 0.55 0.08 0.011 0.18 bal.
AuralTM 5 HPVD 7.40 0.49 0.20 0.08 0.018 0.17 bal.
Figure 3.1 : Red line: solution treatment (T4 : 500oC for 3h), Black lines: solution+aging
treatment(T6: 500oC for 3h and 170oC for 2.5h).
3.2 Microstructure Characterization
3.2.1
Optical Microscopy (OM)
Samples were cut into rectangular shape (high pressure vacuum die casting 20mm× 20mm× 2.5mm; permanent mold casting 20mm× 20mm× 4mm), and vertical mounted with graphite powder. Conventional metallographic polishing was applied for the sample preparation. Samples were first polished with emery papers with increasing grit size (120, 220, 320, 600) and fine polished with 6 µm and 1 µm diamond abrasive. The final step 0.05 µm polishing was done with a
Te m pe ra tu re ( C) 500 400 300 200 100 Time(h) 3h 2.5h
29
colloidal silica suspension. The microstructure variables in five zones along the sample cross section were analyzed with image analysis. In each zone, eight optical images (500x) were quantitatively analyzed.
An optical microscope (Nikon Eclipse ME600 machine) with an image analyzer (CLEMEX software PE4-0), as shown in figure 3.2, was used for observation and quantitative characterization of the microstructural variables, such as the equivalent diameter, aspect ratio, volume fraction, distribution of various phases.
Figure 3.2: Clemex image analysis system with Nikon Eclipse ME600 optical microscope.
3.2.2
Scanning Electron Microscopy (SEM)
A scanning electron microscope (SEM, JSM-6840LV) equipped with an energy dispersive spectrometer (EDS), as indicated in figure 3.3, was employed to observe and characterize different types of phases.
30
Figure 3.3: JEOL JSM-6480LV SEM system
3.2.3
Electron Backscatter Diffraction (EBSD)
EBSD specimens were ground with grit abrasive paper with grit size from 120 to 600 and polished using 6 μm and 1 μm diamond paste. The samples were then polished with 0.05 μm non-crystallizing colloidal silica without water addition for 5 minutes. EBSD patterns were obtained through SEM.
31
3.2.4
Transmission electron microscopy (TEM)
TEM samples were cut from the cross section of the plate, and grinded to about 60µm thickness. Double-jet electro-chemical polishing were applied on the samples in a solution of 15% nitric acid and 85% methanol at -25 oC and at
a voltage of 20V. TEM observation was conducted by the JEM-2100 transmission electron microscopy, as shown in figure 3.4.
Figure 3.4: JEM-2100 transmission electron microscopy.
3.2.5
Electrical Conductivity testing
For conductivity testing, the standard test method for determining the resistivity of electrical conductor materials is ASTM B 193-87. Conductivity is calculated from the measured resistance and dimensions of the specimen. The accuracy and convenience with which resistance can be measured depends on the actual resistance of the specimen. The conductivity of aluminum alloys is
32
used to correlate to the extent of solutes retained in solid solution49. It is a
function of the microstructural state of the matrix alloy49. It is inversely
proportional to the volume of the precipitates and is proportional to the quantity of the precipitates. Temperature has a huge impact on the results49, thus each test
was calibrated by standard aluminum test sample— bringing standards to sample temperature. The electrical conductivities of the samples were obtained by Sigmascope SMP10 unit. Each side of samples was measured 2 times. The average electrical conductivity of 4 tests were obtained.
3.2.6
Differential scanning calorimetry (DSC)
testing
Differential scanning calorimetry (DSC) analyses were performed using a DSC 8000, acomputerized differential scanning calorimeter at a heating rate, 10°C/minute, from room temperature to 570 oC. The average data of three
samples for each type of castings were reported. Four-millimeter diameter disc samples with mass about 30 mg were cut out from solution treated cast plates.
3.3 Mechanical Characterization
3.3.1
Tensile testing
The tensile tests were carried out at room temperature using an Instron universal testing machine according to the ASTM B557. Sub-size tensile test bars (100 mm in the overall length and 25 mm in the gage length) were used. Figure 3.5 showed the ASTM E8/E8M standard for a sub-size tensile specimen.
33
Tensile specimens were heat treated according to the T4, T6 thermal profiles in figure 3.6. The tensile properties, namely the ultimate tensile strength (UTS), yield strength (YS) at a 0.2% offset strain and fracture elongation (El), were reported as an average value of four test bars.
Figure 3.5: Schematic illustration of Tensile Test Specimen
G – Gage length: 25.0 ± 0.1 mm; W – Width: 6 ± 0.1 mm;
T – Thickness: 3 ± 0.1mm; R – Radius of fillet, min: 6 mm;
L – Overall length, min: 100mm; A – Length of reduced section: 32 mm; B – Length of grip section, min: 30 mm; C – Width of grip section: 10 mm.
34
Figure 3.6: Red line: solution treatment (T4 : 500oC for 1h), Black line: solution+aging treatment(T6:
500oC for 1h and 170oC for 2.5h)
3.3.2
Micro-hardness testing
In order to measure Vickers hardness, a flat and polished surface is required. The standard metallurgical preparation procedure was used to prepare the sample. Samples were first polished with emery papers with increasing grit size (120, 220, 320, 600) and fine polished with 6 µm and 1 µm diamond abrasive. The final step 0.05 µm of polishing is done with a colloidal silica suspension. Vickers hardness measurements were performed using Nextgen NG-1000CCD hardness test machine with a load of 100 g and 15 s dwell period on the polished surface following the ASTM E92. The sample was then placed in the Nextgen machine. Lines were made along the 2 diagonals of the diamond indents; both diagonals
1h
Te
m
pe
ra
tu
re
(
C)
500
400
300
200
100
Time(h)
Solution treatment
Solution +aging treatment
35
were entered the Vickers hardness formula shown in the following equation, and auto-calculated by Nextgen.
HV = = . ……..(3.1)
where P is the load in kgf and d is the length of the diagonal in micronsThe data, minimum 10 measurements, was then averaged over all the points taken on each specimen.
3.4 Quench factor analysis
3.4.3
Interrupted quench techniques for
time-temperature-precipitate curves
In order to meet the requirement of isothermal tests. All the samples were cut into square plate with dimensions 20×20×2.5mm (HPVD) and 20×20×4mm (PM). Samples were solute-heat treated at 500 ℃ for 3h, and immediately transferred into a salt bath and held isothermally at temperatures ranging from 250-450oC for set period. Subsequent quenching was done in water at room
temperature. Then all the samples were artificial aged at 170oC for 2.5h.
Ultimately, the samples were prepared via the standard metallurgical sample preparation method for Vickers hardness measurements. Figure 3.7 showed a schematic of the different heat treatments used to conduct these tests.
36
Figure 3.7: Schematic of heat treatments used in the procedure for time-temperature precipitates tests
1. Solution heat treatment under 500℃for 3h;
2. Soaking steps at different temperatures(250℃-450℃) and different time(10s-1800s);
3. Water quench to room temperature; 4. Aging at 170℃ for 2.5h.
3.4.4
Instrumentation and Cooling Curves
The cooling rates of each sample are important to calculate because there is a direct correlation between cooling rate and the mechanical properties after the T6 treatment. To do this for the HPVD and PM samples, the samples had to be instrumented with thermocouples. 1mm holes were drilled from the cross section of the sample and move through the sample in the axial direction. The holes were drilled 10mm deep. This was done to reflect the temperature at the middle of the sample to represent the sample temperature. K+ thermocouples were used to
④ Te m pe ra tu re (℃ ) 500 400 300 200 100 ② ③ Time(s) ①
37
collect the data. Samples were heated at 500oC for 3h and immediately cooled in
different media to obtain different cooling rates. The data collected from the thermocouples was done using Graphtec GL240 data logger. Due to the nature of these alloys the important transformations occur during the moderate temperature range of each alloy which will be obtained after constructing the time-temperature-precipitate curves. Based on this information the average cooling rate was calculated between this temperature range. The average cooling rate was calculated by averaging the first derivative between the temperatures of 450°C to 250°C. The data was then taken from these calculations and matched up with hardness values.
3.4.5
Continuous cooling tests
To evaluate the suitability of predicted and experimental results. Continuous cooling tests were conducted. Samples were sectioned from initial casting alloy and instrumented with Type K thermocouples in the center of the sample. After solution heat treatment at 500oC for 3h, samples were quenched
immediately (less than 3s) by various means (still or flowing air, fiberglass insulator, oil with different temperature) shown in fig. 10, and artificial aged at 170 oC for 2.5h, followed by Vickers hardness tests. This allows us to assess the
38
Figure 3.8: Cooling curves for HPVD (line) and PM (dash).
3.4.6
Interrupted quench techniques for
time-temperature transformation curves
Similar to isothermal tests for time-temperature precipitate curves, the specimens for time-temperature transformation were solute-heat treated at 500℃ for 3h, and immediately transferred into a salt bath and held isothermally at temperatures ranging from 250-450oC for set period of time. Subsequent
quenching was done in water at room temperature, and artificial aging was done at 170oC for 2.5h. Electrical conductivity tests were conducted after that. Figure
3.9 illustrated a schematic of the different heat treatments used to conduct these tests.
39
Figure 3.9: Schematic of heat treatments used in the procedure for time-temperature transformation tests
1. Solution heat treatment under 500℃for 3h;
2. Soaking steps at different temperatures(250℃-450℃) and different time(10s-1800s);
3. Water quench to room temperature.
Te m pe ra tu re (℃ ) 500 400 300 200 100 ① ② ③ Time(s)
40
Results and discussion
4.1 Microstructures and mechanical properties of
Aural
TM3 HPVD and PM
4.1.1
Microstructure of HPVD and PM samples
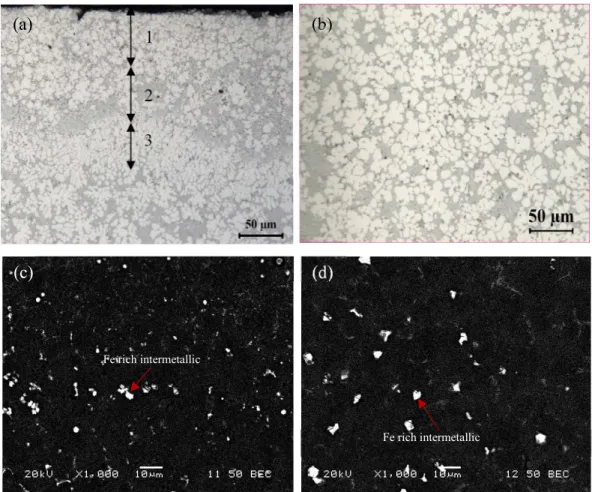
Figure 4.1 showed the optical and SEM images of the HPVD microstructure. Under optical microscopy, the rosette-like aluminum grains present with a light color, Al-Si eutectic is grey color and primary Mg2Si particles show dark color
(Figure 4.1(a) and (b)). The Fe-rich intermetallic phase can be better observed under SEM backscattered images (Figure 4.1(c) and (d)), which are the dot- and block-like particles with white color. The surface layer in HPVD castings has a unique feature and consists of 1) a skin sublayer, 2) a eutectic-rich sublayer and 3) an aluminum grain-rich sublayer, as indicated in Figure 4.1(a). The skin sublayer is directly adjacent to the sample surface with 60-100 µm in thickness, in which the size of aluminum grains and silicon particles is much smaller than that in the center position (Figure 4.1(b)). Next to the skin sublayer, it is a eutectic-rich sublayer, in which the fraction of Al-Si eutectic is much more than the other positions of the sample. Adjacent to the eutectic-rich sublayer, there is an aluminum grain-rich sublayer. After the surface layer (approximately 180-200 µm) towards the center, the microstructure becomes uniform as shown in Figure 4.1(b). In a particle suspension system, fluid flow affects the particle distribution50. In the HPVD die cavity filling process, the melt flow contains
many aluminum grains, which are at first solidified in a shot chamber or on the die wall, and some of the aluminum grains would then dropped off from the wall
41
under the melt flow action. The skin sublayer forms on die cavity wall when the melt enters the cavity from a gate due to the high cooling rate on the wall. A shear force arises between the solidified skin sublayer on die cavity wall and the melt flow. Under the shear force, solute-rich liquid aluminum is concentrated on the interfaces (solidified skin sublayer/melt) to reduce the flow resistance, and the aluminum particles/grains are pushed to one side. Consequently, this results in the formation of a eutectic-rich sublayer and an aluminum grain-rich sublayer. The quantitative image analysis results of the HPVD microstructure are shown in figure 4.2. The secondary dendrite arm spacing (SDAS) and aluminum grain size vary from the cast surface to the center (figure 4.2 (a)). The average value of SDAS in the skin sublayer (2.5 μm) is much smaller than that at the center (6 μm). The aluminum grains size varies along the cross section of the HPVD sample (figure 4.2 (a)) and increases from the cast surface toward the center. The equivalent diameter of the aluminum grains in the skin sublayer (4.2 μm) is approximately 60% of that in the center (7.2 μm). The similar phenomenon is observed on the eutectic Si and primary Mg2Si particles as well
as Fe-rich intermetallic particles, i.e. the size of those phases increases with increasing distance from the cast surface to the center (figure 4.2 (b), (c) and (d)).
42
Figure 4.1: Microstructure of the as-cast HPVD sample: (a) optical images near cast surface (1. a skin sublayer; 2. a eutectic-rich sublayer, 3. an aluminum grain-rich sublayer), and (b) at the center; SEM electron backscattered images near (c) cast surface and (d) at the center.
(c) (d) Fe rich intermetallic Fe rich intermetallic (a) (b) 3 2 1