Collaboration and contracting out versus funding and support - Impact on the propensity to patent of Canadian biotechnology firms 1999-2005
34
0
0
Texte intégral
(2) CIRANO Le CIRANO est un organisme sans but lucratif constitué en vertu de la Loi des compagnies du Québec. Le financement de son infrastructure et de ses activités de recherche provient des cotisations de ses organisations-membres, d’une subvention d’infrastructure du Ministère du Développement économique et régional et de la Recherche, de même que des subventions et mandats obtenus par ses équipes de recherche. CIRANO is a private non-profit organization incorporated under the Québec Companies Act. Its infrastructure and research activities are funded through fees paid by member organizations, an infrastructure grant from the Ministère du Développement économique et régional et de la Recherche, and grants and research mandates obtained by its research teams. Les partenaires du CIRANO Partenaire majeur Ministère du Développement économique, de l’Innovation et de l’Exportation Partenaires corporatifs Autorité des marchés financiers Banque de développement du Canada Banque du Canada Banque Laurentienne du Canada Banque Nationale du Canada Banque Royale du Canada Banque Scotia Bell Canada BMO Groupe financier Caisse de dépôt et placement du Québec CSST Fédération des caisses Desjardins du Québec Financière Sun Life, Québec Gaz Métro Hydro-Québec Industrie Canada Investissements PSP Ministère des Finances du Québec Power Corporation du Canada Rio Tinto Alcan State Street Global Advisors Transat A.T. Ville de Montréal Partenaires universitaires École Polytechnique de Montréal HEC Montréal McGill University Université Concordia Université de Montréal Université de Sherbrooke Université du Québec Université du Québec à Montréal Université Laval Le CIRANO collabore avec de nombreux centres et chaires de recherche universitaires dont on peut consulter la liste sur son site web. Les cahiers de la série scientifique (CS) visent à rendre accessibles des résultats de recherche effectuée au CIRANO afin de susciter échanges et commentaires. Ces cahiers sont écrits dans le style des publications scientifiques. Les idées et les opinions émises sont sous l’unique responsabilité des auteurs et ne représentent pas nécessairement les positions du CIRANO ou de ses partenaires. This paper presents research carried out at CIRANO and aims at encouraging discussion and comment. The observations and viewpoints expressed are the sole responsibility of the authors. They do not necessarily represent positions of CIRANO or its partners.. ISSN 1198-8177. Partenaire financier.
(3) Collaboration and contracting out versus funding and support – Impact on the propensity to patent of Canadian biotechnology firms 1999-2005 * Catherine Beaudry†. Résumé / Abstract Using the four Biotechnology Uses and Development surveys of Statistics Canada, we analyse the relative importance of funding and support as well as collaboration and contracting, R&D and IP strategies on the propensity to patent of Canadian biotechnology firms. Our model accounts for the potential endogeneity due to the simultaneity of some of these strategies. Controlling for various firm characteristics, the stage of development of the firm and the sources of its revenues, we find that collaboration with other firms does matter for patenting, as well as R&D, even when controlling for potential endogeneity. IP strategies and contracting out activities also increase the propensity of a firm to patent. And so does angel and venture capital funding. Mots clés : Innovation, Patents, Collaboration, Contracts, R&D, Biotechnology.. *. I acknowledge support from the Social Science and Humanities Research Council of Canada (grants numbers 820-2006-0064 and 410-2009-1965) and from the Tom Symon fellowship of Statistics Canada. I am grateful to the Science, Innovation and Electronic Information Division of Statistics Canada and particularly to Fred Gault and Paula Thomson for allowing access to the biotechnology use and development survey database, to Chuck McNiven for his wisdom on the state of biotechnology collaboration in Canada, to Javier Ojarzun for constructing the quasi-longitudinal database, and I am particularly indebted to Charlene Lonmo who not only supported the technical aspects of the data analysis but shared her findings and questioning relative to the data. Research assistance was provided by Alessandro Ceschia and Joël Levasseur. The research and analysis are based on data from Statistics Canada and the opinions expressed do not represent the views of Statistics Canada. The author is solely responsible for the contents. † École Polytechnique de Montréal and Center for Interuniversity Research and Analysis of Organization (CIRANO), catherine.beaudry@polymtl.ca.
(4) 1.. Introduction. Biotechnology firms require two very important resources to be innovative and eventually to survive: external collaborators/partners (Deeds and Hill, 1996; Oliver, 2004; Powell et al., 1996) and specific funding according to their stage of development (Hall and Bagchi-Sen, 2002) and that of their products. Several studies have indicated the importance of collaboration for technology and innovation, adding to the internal innovation capabilities of the firm (Deeds and Rothaermel, 2003; Hagedoorn, 2002). In general, the literature finds a positive influence of collaboration on the innovative performance of firms (Baum et al., 2000; Deeds and Hill, 1996; Faems et al. 2005; Rogers, 2004; Shan et al., 1994; Stuart, 2000). While some collaboration agreements are accompanied with funding agreements, a great number of other sources of funding are available to biotechnology firms. A number of scholars mention the necessity for venture capital in the early and highly innovative stages of the firm (Kortum and Lerner, 2000; Engel and Keilbach, 2007). Baum and Silverman (2004) for instance show that government funding has a positive effect on the propensity to patent, but that venture capital has no effect. Other studies are in agreement regarding the incapacity of traditional debt financing to provide the right funding for highly risky R&D phases of projects (Czarnitzki and Kraft, 2009; Hall, 2002; Gompers and Lerner, 2001). Considering the fact that collaboration and contracting has an influence on innovative performance, that funds and government intervention all play a role, the goal of this project is to verify that this is also the case for small and medium biotechnology firms. If there is a field for which patents are well suited, it is definitely biotechnology. As a consequence, we measure innovative performance in terms of patenting. We have the chance of working with a very complete database on Canadian biotechnology firms covering 8 years, which allows the characterisation of a great number of aspects of these firms over the years. For instance, we have access to the number of products of the firm at each stage of development. While small biotech firms did not intend to replace large pharmaceutical industries and produce drugs themselves, does the current business model allow them to maintain a number of products at different stages of development or does one key product drives the behaviour of the entire firm? Are they merely the transfer channel between science and large pharmaceutical companies? Some authors argue that “biotechnology as such is not an industry, but refers more to a set of technologies that 1.
(5) profoundly affect existing industries such as agriculture, food-processing and human health (Pisano, 2002)” (Gilsing and Nooteboom, 2006, p. 6). As a consequence, one may be inclined to think that firms that have products further along the development stage may not be as innovative as they were in the past. Although Klepper (1996) shows that product innovation dominate the early stages of the product lifecycle, process innovation is more important in the later stages of production, when higher volumes have to be produced. The latter type of innovation may involve less patenting activities than the early stages. The rest of the article proceeds as follows. The next section presents a brief review of the literature, the theoretical framework and related hypotheses. The following section describes our research methodology, including data and regression models. The next section then presents the regression results. Finally, the last section presents a discussion of these findings and draws conclusions from the research. 2.. Theoretical framework and hypothesis development. 2.1 Collaboration and contracting Collaboration has been positively linked to patent propensity by a number of authors. The rationale is simple, before entering into any type of partnership, firms feel the need to protect their own intellectual property (IP) before the partner gains access to that precious knowledge. Patenting may also be the result of the collaborative agreement. Brouwer and Kleinknecht (1999) find that R&D collaboration agreements have a positive effect on the probability of applying for a patent. In their study of Finland and Germany, Czarnitzki et al. (2007) conclude that collaboration leads to a better patenting performance of the economy in general. Greis et al. (1995) find that the frequency with which US firms have entered into collaborative agreements has increased dramatically since the 1970s (Hagedoorn and Shankenraad, 1990a, b) to overcome innovation barriers such as short-termism of capital markets and heavy regulatory process. The innovation process is now so intertwined that the locus of innovation (Pisano et al. 1988) has shifted from the single firm towards a network or inter-organizational relationships. The paper is somewhat linked to the exploration-exploitation dichotomy (March, 1991) and the cycle of discovery of Nooteboom (2000). “Exploitation, i.e. the efficient employment of current assets and capabilities, is needed to survive in the short term. Exploration, i.e. the development. 2.
(6) of novel capabilities, is needed to survive in the long term. Thus, to survive in the short and long term, firms must combine the two, somehow.” (Gilsing and Nooteboom, 2006, p. 3). Exploration hence is associated with “the pursuit of knowledge, of things that might come to be known”, and exploitation is related to “the use and development of things already known” (Levinthal and March, 1993, p. 105). The question is whether biotechnology small and medium firms (SMEs) in Canada follow this pattern or whether long-term survival is not the goal of this paper. Exploration activities may well result in the patenting of innovation, whether the collaboration agreement is with a firm or a public institution, but may also result in the development of new ideas, published in academic journals if the biotech firm collaborates with a university. In contrast, firms that collaborate for exploitation purposes are more likely to do so with private enterprises rather than with public institutions. As a consequence, collaboration between firms for exploration purposes is likely to result in the production of patented knowledge, while collaboration between firms for exploitation purposes is likely to require the patenting of innovation prior to its commercialisation. Our first hypothesis is therefore: H1: Firms that collaborate with private organisations have a greater propensity to patent Because some firms may contract out R&D instead of collaborating with other organisations, we propose the following hypothesis: H2: Firms that contract out R&D activities to other organisations have a lesser propensity to patent 2.2 Private funding and public support Depending on the life cycle of the firm, various sources of funding are accessible to the firm. In the case of relatively young and small firms, angels and venture capital (VC) firms are often the first port of call. Controlling for R&D expenditures, Kortum and Lerner (2000) find that venture capital in the US has an important impact on the increase in patenting. They suggest that “a dollar of venture capital appears to be about three times more potent in stimulating patenting than a dollar of traditional corporate R&D” (Kortum and Lerner, 2000, p.675). Engel and Keilbach (2007) find similar results for Germany. An important nuance though is that the patents to which they refer are those for which the firm has applied prior to the involvement of venture capitalists. After the investment, the number of patent applications does not differ significantly. 3.
(7) from firms that were not funded by VC firms (Hellmann and Puri, 2000). This evidence suggests the following hypothesis: H3: Firms that benefit from angel funding and venture capital are more likely to patent Capital markets, venture capital and initial public offering (IPO) or the issuance of stock, are generally focused on short-term return on investment, which seems far removed from the realities of a domain where the regulatory process is long and cumbersome. Consequently, firms will be obliged to combine a number of sources of funding to go through the entire innovation process, from R&D to commercialisation (Hall and Bagchi-Sen, 2002). It is often assumed that debt financing is detrimental to innovation. This Schumpeterian view is based on the fact that “R&D cannot be used as collateral in credit negotiations with banks” (Czarnitzki and Kaft, 2009, p.376). R&D is an expense and its outcome is highly uncertain. As a consequence, banks are very reluctant to fund such endeavours (Hall, 2002). For these reasons, Gomper and Lerner (2001) state that banks are unable to adequately finance innovative firms, particularly high-tech firms. Audretsch and Lehmann (2004) then demonstrate that small innovative firms are more likely to be financed by venture capital than by banks. These findings suggest the following hypothesis: H4: Firms that receive funding from traditional banks tend to patent less If the cost of external funding is too high as Hall (2002) argues, some innovation will not be brought forward. Firms will simply abandon some projects and not devote the socially optimum amount towards R&D. To remedy this R&D sub-optimality and to provide an incentive to firms, Government intervention is therefore needed to help fill the gap between the private and social returns to innovation expenditures. Among the Government tools are direct funding, through grants and loans, and tax credits, mainly R&D tax credits. A number of studies have examined the impact of these tools (see for example the surveys by David, Hall and Pool, 2000; Hall and van Reenen, 2000). Relatively few have concentrated their analysis on Canadian firms. Bérubé and Mohnen (2009) examine whether firms that receive R&D subsidies are more innovative. They find that firms that benefit from both R&D grants and R&D tax credits introduce more new products than firms that only benefit from the latter. In the same vein, Czarnitzki et al. (2011) show that R&D tax credits lead to additional product innovations and increased shares of new or improved products. 4.
(8) In a study of Belgian firms, Cincera (2005) find that while the impact of private (from firms) funding has a positive impact on the number of patent applications, the effect of government funding is not significant. Her argument for justifying these results is that public support is generally intended for long-term fundamental research that will take some time to show an impact on innovative output. As a consequence, we propose the following hypothesis: H5: Firms that receive direct public funding have higher propensity to patent 3.. Methodology. 3.1 Data The data used in this study was collected by Statistics Canada. The responses to the four Biotechnology Uses and Development (BUD) surveys1 of 1999, 2001, 2003 and 2005 have been linked to one another to build a quasi-longitudinal database. Because the number of biotechnology firms in Canada is relatively small, all firms involved in biotechnology are surveyed and completion of these questionnaires by the surveyed firms is a legal requirement under the Statistics Act. As a consequence, the obtained response rates are between 60% and 70%. As such, Statistics Canada considers these surveys as a census of all biotechnology enterprises. Our sample is therefore representative of the population. Table 1 summarizes the number of firms in each survey. In this paper, we will concentrate our analysis on the small and medium size enterprises (SMEs). The two right-hand columns indicate the number of individual firms that are included in the quasi-longitudinal database resulting from the data linkage. In total, the data used in this paper includes 1004 firms from 1999 to 2005. In this joint sample, a number of firms have been added to the database over the years, either because they did not exist previously, or because they only converted to biotechnology recently, or simply because they did not answer the questionnaire in past years. In addition, a number of firms also leave the database because they cease their activities, are merged or acquired, or once again, did not answer the questionnaire. The quasi1. Each BUD survey is carried out in two steps. A first questionnaire is sent to the Canadian enterprises that are potentially capable of using or developing biotechnology, in order to identify the reference population. For economic reasons, sampling generally reaches about a 70% response rate. The methodologists of Statistics Canada then apply non-response weights to the sample by strata (firm size, province and NAICS code). Then a second detailed questionnaire is sent to all firms of the reference population. The same procedure for the non-response correction is applied; the resulting weights are thus a combination of the two non-response weights, from the first and second questionnaire.. 5.
(9) longitudinal database thus constructed is a very unbalanced panel. For instance, some firms may have answered the 4 questionnaires, some only one questionnaire, while others may have responded to one questionnaire in 2001 and to another in 2005. Considering our sample, proper panel data analysis is not feasible. Table 1 – Number of firms by size and sector, per survey year 1999. 2001. 2003. 2005. 269. 267. 352. 397. 51. 62. 77. 83. SMEs. 320. 329. 429. 480. Large. 37. 47. 61. 52. Sector Human health. 150. 197. 262. 310. Agriculture and food processing. Size Small Medium. 118. 113. 137. 146. Environment. 35. 33. 38. 39. Other. 54. 32. 52. 37. 1999-2005. 2001-2005. 1004. 810. 907 358 375 490 532 1129 Total Note: For individual surveys are presented the weighted number of firms using the non-response weights. For the two right-hand columns, the number of firms is not weighted and indicates the size of the sample. Because the four surveys were not originally planed as a longitudinal study, non-response weights for an individual firm across time cannot sensibly be constructed a posteriori.. The phenomenon of interest is whether firms have innovated in the past two years. More than half of the firms have filed patent applications within the last two years of the survey (for example, the 2005 survey comprises the patent applications of both 2004 and 2005). Our dependent variable, PatApp, indicates if firms have applied for a patent in the past two years. A second dependent variable, nbPatApp, measures the number of patent applications filed by the firm in the past two years. 3.2 Variables Firms may develop new innovations in-house, in collaboration with other organisations or simply by contracting out this task. In the first case, internal R&D is the main driver of new innovations that will eventually be patented. In the second case, both internal and external R&D are required. Finally, in the third case, external R&D yields the innovations that the firm requires. 6.
(10) or has contracted out. Our first two variables on external linkages of the firm are related to the collaboration and contracting activities of the firm. In the database available for this study, most firms that collaborate do so for exploration purposes, i.e. for the development of knowledge, it is therefore difficult to disentangle the effect of public and private collaboration because both types are equally present. In contrast, firms that collaborate for exploitation purposes are more likely to do so with private enterprises rather than with public institutions. Exploration in our case would be represented by collaboration with academia. When collaborating with a university, a firm is generally seeking the development of knowledge, a patent may be the result, but it is not necessarily an automatic result. Indeed, when firms collaborate for exploration purposes, patents and papers may be the results of this endeavour. In contrast, when collaborating with other firms, exploitation would be related to collaboration with large pharmaceutical firms and aimed at commercialisation. To measure the extent to which a firm collaborates with other firms, we include the number of collaborative arrangements that a firm has reported for the year of the survey, nbCollPriv2. For some aspects of the research, a firm might not have the necessary knowledge, know-how or capacity in-house and might want to contract out some of these activities3. Generally, the IP generated by the firm contracted to do the work would be expected to belong to the firm that gives the contract. Unless other arrangements (such licensing at a reduced fee or share IP) are made for the IP, we would expect contracting out to have a positive effect on innovation. For this purpose, we include CostContOut, which measures the cost of the contracts granted by the firm to other organizations4.. 2. The dummy version of this variable is also included in the analysis as dCollPriv. The number of collaborative arrangements is not available in the 1999 survey, only whether the firm had collaborative arrangements with various types of partners. 3 The survey questionnaire provide a clear definition of cooperative and collaborative arrangements: “Cooperative and collaborative arrangements involve the active participation in projects between your company and other companies or organizations in order to develop and/or continue work on new or significantly improved biotechnology processes, products and/or services. Pure contracting-out work is not regarded as collaboration.” This distinction allows us to also include in the analysis contracting activities as an alternative means by which firms acquire knowledge. 4 The most recent survey questionnaires ask the firm to distinguish the total value of contracts by type or organization as well as by the objective of the contract in a matrix format. Because of the complexity of the answers demanded and considering the small proportion of firms that have filled the matrix we will not make use of this rich information. In addition, the matrix to be filled is not identical from one survey to the next, rendering a detailed analysis difficult if at all possible. At the aggregate level, there are less risks of mismeasurement, a firm knows how much it has spent on contracts in total.. 7.
(11) The second group of variables of interest is related to the private funding and public support of biotechnology firms. As an alternative to revenues in their early life, firms are strongly dependent on external funding. The four surveys asked the firms whether they successfully managed to raise capital, how much they raised and what proportion came from each source of funds. With that information, we construct four funding variables, FundGov, which measures the total amount of direct funding received from government sources, FundVC, represents the total amount of venture capital received, regardless of its geographical origin5, FundAng, measures the amount of funds received from family and other providential investors (angels), and finally FundDebt, represents the amount borrowed by the firm. Because venture capital and angel funding are the very first doors on which to knock, these should have a positive effect on patenting. In addition to the variables of interest, we include a number of control variables, which all have their importance individually. The size and age of the firm have been studied in great length in the past. In addition, we add the basic characteristics of the firm, the stage of its product development, its IP related strategies, the revenues generated from the firm in addition to a number of sector, time-related and environment dummy variables. These are described in the paragraphs below. Brouwer and Kleinknecht (1999) find that larger firms have a greater propensity to patent. Arundel et al. (1995) suggest that patents are more important for small firms because they are at a disadvantage regarding other protection mechanisms compared to large firms. Other studies however refute this argument by showing that the importance of patents increases with the size of the firm (Arundel, 2001; Kortum and Lerner, 1999; Hussinger, 2006). These studies include large firms in their analysis. In this paper, we concentrate our analysis on small and mediumsized enterprises (SMEs). The question is then whether this finding still stands without the larger firms included in the sample and within a very specific technology field, i.e. biotechnology. Owen-Smith and Powell (2004) include both the size of the firm and its age as control variables in their analysis of the factors that affect successful patent applications in the Boston Biotechnology industry. They find an inverted-U relationship for the age of the firm. Once again, 5. The more recent surveys distinguish venture capital from Canadian, European, American and other sources. Because this reporting is not consistent through out the surveys and mainly because the distinction between the sources did not provide robust results, the aggregated values are used in this paper.. 8.
(12) their sample also includes the large enterprises, which are generally older than SMEs and small firms. As an alternative to the typical number of employees of the firm, we have access to the number of employees dedicated to biotechnology (from research to IP management, from marketing to operations management), nbEmpBio. This variable proved much more significant than the total number of employees of the firm and will thus be used in this paper as a measure of the size of biotechnology activities. To account for the fact that a more complete managing team helps the firm obtain better sales results which then contribute to financing R&D (Woiceshyn and Hartel, 1996), or for the fact that the lack of employees in marketing functions is a barrier to innovation (Hall and BagchiSen, 2002), we include a measure of diversity of biotechnology employment (research, including lab directors and technicians, regulation and clinical trials, production, finances and marketing, general management). A simple Hirshman-Herfindahl index, HHIEmpBio, based on the share of these five employment tasks is constructed. The closer to 1 is the index, the less diverse and levelled is the team, the closer to 0, the more one category of employee dominates. As independent additional control variables, we include the usual controls for the age of the firm, Age. A dummy variable, dPub, is included which takes the value 1 if the firm is a public firm. A second dummy variable, dMerg, takes the value 1 if has merged or been acquired. A third dummy variable, dSubsInt, takes the value 1 if the firm is a subsidiary of an international company. Finally, a fourth dummy variable, dSpinoff takes the value 1 if the firm is a spinoff, whether it emerged from a public institution or a private enterprise6. For the collaborative arrangements to be beneficial to the firm, its research team must be able to perform its own R&D activities, to have knowledge to transmit to other organizations, but also for its own absorptive capacity (Cohen and Levinthal, 1990). We therefore include RDExp, which measures the amount spent in R&D by the firm. A somewhat related variable is whether the firm has put in place specific strategies for the protection of the intellectual property. These strategies would have a definite positive impact on patenting because of the very nature of the domain. In the questionnaires, the firms rated the 6. Distinctions between the types of spinoffs where examined during the course of this study, but no significant effects were ever noted. A simpler version of the dummy variable is thus presented in this paper.. 9.
(13) importance of knowledge development strategies on their firm‟s performance on a 5-point lickert scale from a low importance (1) to a high importance (5). Two items in the survey relate to IP: Developed firm policies and practices for knowledge/intellectual property protection; and Conducted an intellectual property audit to ensure protection of products and processes at all stages of development. We construct a variable, StratIP, with the mean score for these questions to generate a measure of the importance of IP protection in the firm7. One question that springs to mind is whether the business model of some biotechnology firms is not simply that of the one-product firm, i.e. based on one product brought to the market or brought to phase II of the clinical trials followed by the traditional venture capitalist exit strategy (IPO or acquisition by a another firm). These particular firms would thus file for patents early in their life and then follow the product through the pipeline, while neglecting further research or patenting. As a consequence, patenting would strongly depend on the stage of the product pipeline that the firm has reached. To account for this possibility, we have constructed a variable that takes into consideration the proportion of the products that are at various stages of development, from R&D, to the preclinical phase and the clinical trials (all three phases), followed by production and commercialization of the products. The resulting ordered variable, ProdStage, takes the value 1 if the highest proportion of the products is at the R&D stage, the value 2 if the highest proportion of the products is at the preclinical stage, the value 3 if the highest proportion of the products is at the regulation and clinical trials stage, and the value 4 if the highest proportion of the products is in production or on the market8. In addition to public funding, venture capital and debt financing, a firm may well have to resort to research contracting to be able to maintain operations (Hall and Bagchi-Sen, 2002). The authors find that contract or collaboration revenue represented 17% of all the revenue sources of Canadian biotechnology firms in 1998. In order to finance the laboratories while waiting for the patenting process to takes its course or for the research to reach its goal, some firms subcontract, so to speak, their research facilities. This is a common survival strategy in the field, which allows the firm more time to devote to research or further testing. Such activities would then be 7. The Cronbach alpha of the two components of StratIP is 0.7660, which show a good level of reliability. During the course of the analysis, we have tested whether the number of products at each stage of development (and taking the natural logarithm), or the proportion of products at each stage of development had a more significant effect. These variables did not however yield robust results and increased the number of regressions with a great improvement on the explanatory power of the regressions. 8. 10.
(14) associated with intellectual property that belongs to other organizations and would thus have a negative effect on innovation of the firm in question. We measure the revenues from contracting in research activities, RevContIn, rather than the number of contracts, which may not reflect accurately the extent of the contracting activities. Another important source of revenues in this strongly science-based domain is the licensing fees obtained from leasing, licensing or selling IP to other organizations. For firms that have a strong tradition of patenting, this represents a potentially high source of revenues, which would generally be associated with a positive effect on patenting. Once again, the value of licensing, RevIPR, is more appropriate than say the number of such licenses as it represents the „quality‟ or usefulness of the innovation. We also include in the analysis the number of patents owned by the firm, nbPat, as a measure of innovation capability. These are the result of patent applications in the past that are the consequence of R&D performed a few years back. The IP that does not have direct uses for the firm might as well be used by another organization while providing extra revenues to finance the firm‟s activities. Once we have accounted for the revenues from contracting in and from IP licensing, revenues from sales are what most firms aspire to. The survey provides information from total sales revenues as well as from exports revenues. We have examined various ways of including domestic sales and exportations within the analyses, unfortunately, the distinction did not yield significant results. As a consequence, we include in the regressions the total sales revenues, RevSales, and a dummy variable, dExport, taking the value 1 if the firm has exported products within the past two years of the survey. Finally, our model will include subdomain dummy variables, for human health, agriculture biotech, environment, and other subdomains, to take into account for subdomain heterogeneity that may not be picked up by other variables, as well as regional dummy variables for provinces and survey-year dummy variables to account for variations in the economic environment across provinces and across time that may affect the firms.. 11.
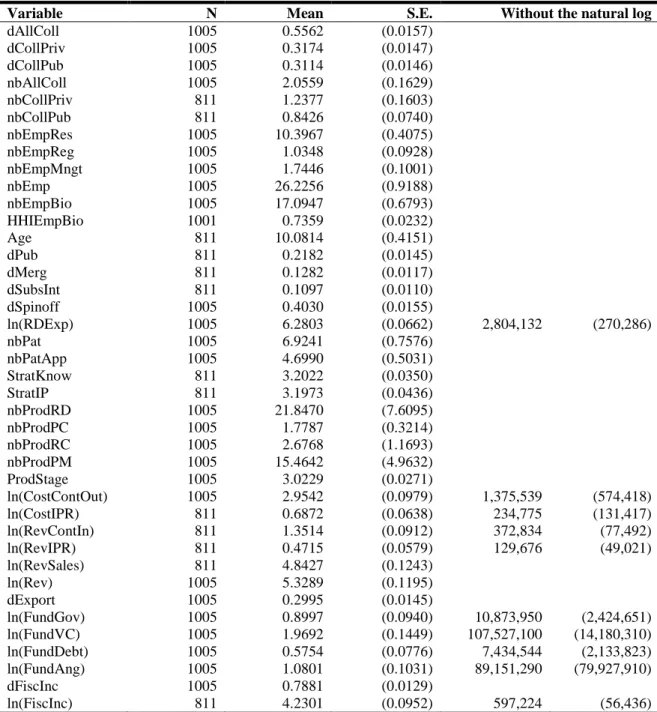
(15) 3.3 Descriptive statistics Table 2 presents the descriptive statistics for SMEs for the most complete sample9. The variables for which the number of observations N is equal to 811 are not present in the 1999 survey. More than 50% of firms submitted patent applications during the two years covered by each survey for an average 4.7 applications per firm, including those that did not patent. On a 5-point Likert scale, firms score an average 3.2 for the importance of an IP strategy, which seems relatively low for a domain for which patents are almost perfectly suited. The average firm is 10 years old, has 26 employees of which 17 are dedicated to biotechnology activities. Not surprisingly, the distribution of the type of tasks performed by these employees is highly skewed towards research as indicated by the high value of HHIEmpBio and of nbEmpRes. More than 40% of firms are spinoffs, 22% have reached their first initial public offer (IPO) stage, 13% have been merged and 11% are subsidiaries of foreign organisations. In the variables used to calculate the stage of product development of the firm, i.e. the number of products in R&D (nbProdRD), preclinical (nbProdPC) and clinical (nbProdRC) stages as well as on the market (nbProdPM), we find that the first and last have the most weight. On average, firms have 22 products in the lab and 15 products on the market, which yield an average advancement stage of 3, roughly equivalent to the „clinical research‟ stage. More than 55% of firms collaborate with other organisations, 32% with private firms and 31% with public institutions. On average, firms participate in 1.24 collaborative agreements with private firms and in 0.84 such agreements with public institutions. R&D expenditures are by far the largest expense, compared to the costs of contracting out and of acquiring IP. Part of these costs are compensated by R&D tax credits which compensate for less than a quarter of R&D expenditures on average. Part of these expenditures is obviously paid for by generous amounts of venture capital, and apparently from rather well off angels. Note however the large standard error of this last variable.. 9. It is important to note that the means presented here do not take into account that the same firms may have responded to more than one survey. What is calculated here are the means of the characteristics of firm-year combinations. For instance, a firm that became a public firm in 2003 would count as a non public firm for 1999 and 2001 and as a public firm in 2003 and 2005.. 12.
(16) Table 2 – Descriptive statistics Variable N Mean S.E. Without the natural log dAllColl 1005 0.5562 (0.0157) dCollPriv 1005 0.3174 (0.0147) dCollPub 1005 0.3114 (0.0146) nbAllColl 1005 2.0559 (0.1629) nbCollPriv 811 1.2377 (0.1603) nbCollPub 811 0.8426 (0.0740) nbEmpRes 1005 10.3967 (0.4075) nbEmpReg 1005 1.0348 (0.0928) nbEmpMngt 1005 1.7446 (0.1001) nbEmp 1005 26.2256 (0.9188) nbEmpBio 1005 17.0947 (0.6793) HHIEmpBio 1001 0.7359 (0.0232) Age 811 10.0814 (0.4151) dPub 811 0.2182 (0.0145) dMerg 811 0.1282 (0.0117) dSubsInt 811 0.1097 (0.0110) dSpinoff 1005 0.4030 (0.0155) ln(RDExp) 1005 6.2803 (0.0662) 2,804,132 (270,286) nbPat 1005 6.9241 (0.7576) nbPatApp 1005 4.6990 (0.5031) StratKnow 811 3.2022 (0.0350) StratIP 811 3.1973 (0.0436) nbProdRD 1005 21.8470 (7.6095) nbProdPC 1005 1.7787 (0.3214) nbProdRC 1005 2.6768 (1.1693) nbProdPM 1005 15.4642 (4.9632) ProdStage 1005 3.0229 (0.0271) ln(CostContOut) 1005 2.9542 (0.0979) 1,375,539 (574,418) ln(CostIPR) 811 0.6872 (0.0638) 234,775 (131,417) ln(RevContIn) 811 1.3514 (0.0912) 372,834 (77,492) ln(RevIPR) 811 0.4715 (0.0579) 129,676 (49,021) ln(RevSales) 811 4.8427 (0.1243) ln(Rev) 1005 5.3289 (0.1195) dExport 1005 0.2995 (0.0145) ln(FundGov) 1005 0.8997 (0.0940) 10,873,950 (2,424,651) ln(FundVC) 1005 1.9692 (0.1449) 107,527,100 (14,180,310) ln(FundDebt) 1005 0.5754 (0.0776) 7,434,544 (2,133,823) ln(FundAng) 1005 1.0801 (0.1031) 89,151,290 (79,927,910) dFiscInc 1005 0.7881 (0.0129) ln(FiscInc) 811 4.2301 (0.0952) 597,224 (56,436) Note: All monetary values are in constant dollars of 2002 (deflated by the CPI).. 3.4 Model specification Our first model, examines the propensity of firms to file patent applications. The basic equation on PatApp to be estimated includes the following set of independent variables:. 13.
(17) ìnbEmpBio, HHIEmp, dPub,dMerg, dSubsInt,dSpinoff , ü ïnbCollX, prodStage,nbPat,revContIn, revIPR,revSales, ï ï ï PatApp = í ý ïdExport, FundGov, FundVC, FundAng, FundDebt, ï ïî RDExp,CostContOut,StratIP ïþ. (1). A firm that invests in R&D is also likely to have a policy for the protection of the IP generated by this R&D, and may also contract out some of this R&D to other organizations for the tasks for which the firm does not have the capacity. Because of complementarity, these three variables are likely to be endogenous. To overcome this endogeneity problem, we use an instrumental variables estimation technique. We regress these variables on a set of assumed exogenous variables or instruments in a first step. Then, we use the predicted values of these variables as independent variables in the estimation of equation (1). The Stata procedure ivprobit allows for the second stage standard errors to be consistent. Each of the endogenous variables is estimated on a number of instruments. As specific instruments for R&D expenditures, we use the number of employees dedicated to research (including lab directors and technicians), nbEmpRes, which will represent an important part of these expenditures, FiscInc. We also include the amount of the fiscal incentives associated with these R&D expenditures10. Similarly to what Veugelers and Cassiman (2005) use in their regressions, we calculate an average value for each of the sub-domains of biotechnology, RDExpSD11. This sub-domain average is expected to account for any unobserved heterogeneity that might arise from the different realities of each sub-domain.. RDExp = {nbEmpres, FiscInc, RDExpSD}. (2). When instrumenting for StratPI, we include the mean score of three other strategies related to knowledge development, StratKnow. The questionnaire asks the firm to rank the importance of the following items: Captured and used knowledge obtained from other industry sources such as industry associations, competitors, clients and suppliers; Captured and used knowledge obtained from public research institutions including universities and government laboratories; Used and. 10. Generally, the vast majority of firms in biotechnology are innovative; this is the name of the game. As a consequence, we expect that the possible selection bias resulting from firms demanding R&D tax credits or grants is relatively small. We will therefore ignore for this paper, the potential selection bias. 11 The sub-domains are: human health, agriculture biotechnology, food processing, environment, natural resources, aquaculture and bioinformatics.. 14.
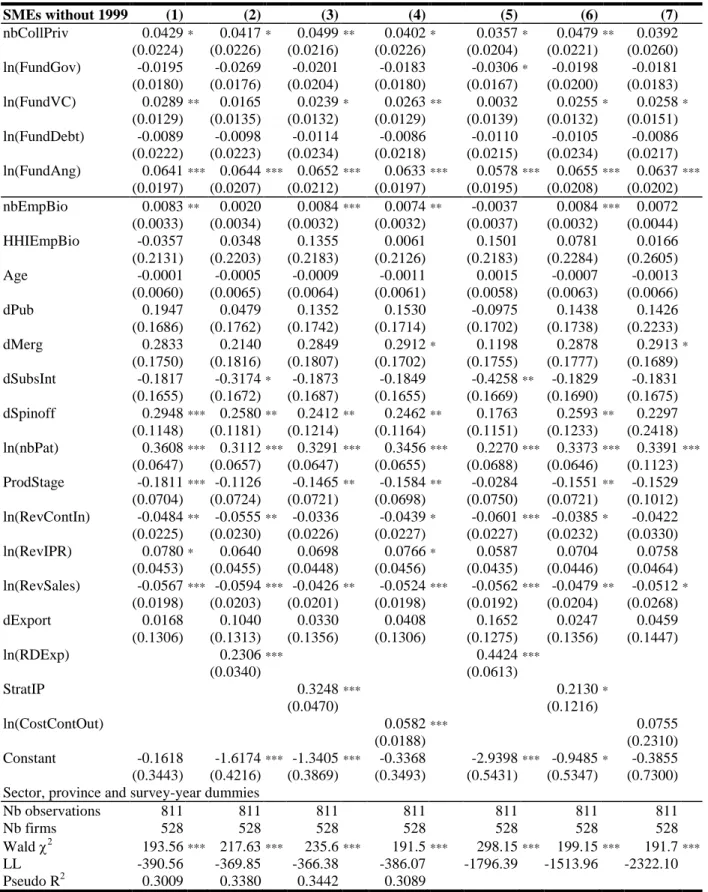
(18) updated databases of scientific information12. These questions relate to the capacity of the firm to turn into new knowledge, products or processes, the information obtained from other sources, private organizations, public institutions or basic science. If the firm aims to develop new intellectual property, it is hence more likely to want to protect it. We also include the number of employees dedicated to regulatory activities as an instrument, nbEmpReg. The more important is the protection of IP, the greater the need for such employees. This variable hence measures the capacity of the firm to protect its IP. Similarly to the previous endogenous variable, we also consider the sub-domain average of the instrumented variable, StratIPSD.. StratIP = {StratKnow, nbEmpreg, StratIPSD}. (3). Finally, the third endogenous variable, CostContOut, is instrumented by the number of collaborative agreements the firm has with public institutions, nbCollPub, the costs of the IP rights purchased or licensed from other organisations, CostIPR and the number of employees dedicated to management, nbEmpMngt. Firms that contract out research are more likely to benefit from collaboration with universities and government laboratories. This can lead to, or emanate from, contracting out research activities to these institutions. In contracting out research activities, the resulting IP may not necessarily belong entirely to the firm, or may also require the purchase of IP rights developed by the contractee, in which case, the costs of acquiring IP rights are likely to be related to the costs of contracting out. The coordination of external research activities makes extra managerial demands on the firm, hence the inclusion of the number of biotechnology employees dedicated to management. Negotiation of contracts as well as their subsequent monitoring are demanding tasks that if neglected may result in the failure of the partnership.. CostContOut = {nbCollPub,CostIPR, nbEmpMngt} 4.. (4). Regression results. Table 3 presents the results from the probit regressions on PatApp for the SME sample excluding the 1999 survey. The regressions were therefore estimated on a sample of 811 observations corresponding to 528 firms covering the 2001, 2003 and 2005 surveys. The results including the. 12. The Cronbach alpha of these three variables is 0.6626, which is acceptable for an exploratory study.. 15.
(19) 1999 survey are provided in appendix 3. Regression (1) shows the results for the model excluding the three endogenous variables. The number of collaborative agreements with private firms has a positive, nbCollPriv, but weakly significant impact on PatApp. As expected, collaboration hence does matter for innovation in this high technology domain, a result similar to that of Brouwer and Kleinknecht (1999). During the analysis, we have tried to add non linear effects, i.e. a quadratic term, for this variable as suggested by Deeds and Hill (1996) who showed that the relationship between the number of collaborative agreements and innovation performance suffers from diminishing marginal returns. This however did not improve the significance of the variable. In its dummy variable format, collaborative agreements with private firms yield a positive and highly significant coefficient for the regressions including the 1999 cohort (in appendix 3). Funding sources associated with the early beginnings of a firm, i.e., angels and venture capitalists (FundAng, FundVC), both have a positive effect on the propensity of a firm to file patent applications. Angel funding has a much more robust impact than venture capital on the propensity to patent. This should not be surprising; during the early days of the firm, when most spinoffs and newly founded firms are seeking financing for their research endeavours, seed capital is just about the only source available. Other sources of funding have no effect, in this first regression. The same results are found when we include the 1999 cohort (see appendix 3). The „biotech‟ size of the firm, nbEMPBio, has a positive and significant effect on the likelihood of filing a patent application, hence supporting the finding of Arundel (2001), Kortum and Lerner (1999) and Hussinger (2006). The diversity of employment, HHIEmpBio, within the firm does not however have any impact on the propensity to file patent applications. This result is attributable to the fact that research employment clearly dominates and that the standard deviation of this variable is very small. Alternative methods have to be investigated to find an appropriate measure of the fact that a firm has a complete team. Not surprisingly, spinoffs do have a positive and highly significant effect on the propensity to file patent applications, regardless of their origin. The common scenario in this domain is that university scientists generally patent their findings through the creation of new firms. In addition, if a firm has patented before and has a portfolio of patents it is highly probable that it will patent. 16.
(20) again. This result seems to suggest that firms are generally not one-patent firms that aim to commercialise one product. The results however show that the further along the commercialisation path the firm is, the less likely it is to apply for a patent, i.e., ProdStage has a negative and significant effect. A related variable is the revenues generated from sales, RevSales, which also yields a negative and significant effect on PatApp. Firms that already have sales revenues are generally further in the life cycle of the enterprise. This is also found in the regressions including the 1999 cohort, as the total amount of revenues has a negative and significant impact on the propensity to patent (see appendix 3). We would have expected that a firm that already exports has also reached a certain maturity. The coefficient of dExport is however not significant. Two effects may be at play here. First, for some firms, exportation is the ultimate goal and once they have reached it, they receive steady revenues from selling their products abroad. For some other firms, the fact of exporting products is a means by which they can generate revenues to finance the development of their main product. An important survival strategy in biotech consists in performing contract work for other organisations in order to use and maintain laboratories facilities and staff. A consequence of this strategy is that firms hence patent less, presumably because the IP developed belongs to the contractor organisation. The revenues generated by these contracts, RevContIn, have a negative and significant effect on the propensity to patent. In contrast, IP revenues have a weakly positive effect on the propensity to patent. In the next three regressions, (2), (3) and (4), we introduce in turn, the three variables that are instrumented in regressions (5), (6) and (7). Regression (2) introduces RDExp as a measure of the input necessary to generate patentable innovations. Confirming prior studies, R&D positively influences the likelihood that a firm will patent. The „biotech‟ size of the firm, nbEmpBio, loses its impact on the propensity to patent, and so does the stage of advancement of the products of the firm, ProdStage, and the amount raised from venture capital, FundVC. This suggest an interaction between these three variables and R&D. First, the amount of R&D expenditures depend on the size of the firm to some extent, especially for high technology SMEs. Second, the source of funding that is the most appropriate when the firm is still largely in its research phase is venture capital, hence the reduction in the value of the coefficient and its significance. Third,. 17.
(21) firms spending a great deal on R&D are most probably in the early stages of their product lifecycle, which contributes the explaining the increase in the value of the coefficient (less negative) and the loss of significance of ProdStage. When correcting for potential endogeneity (5), RDExp remains positive and strongly significant, but its coefficient almost doubles in value. Two of the instruments of RDExp are significant (as seen in Appendix 2), nbEmpres and FiscInc. In other words, firms who employ more research personnel dedicated to biotech spend more on R&D expenditures and benefit from larger R&D tax credits, i.e. fiscal incentives. The subdomain average of R&D does contribute to explaining the variations observed for RDExp. In retrospect, this is not surprising as we are after all studying a science-based domain and not comparing a number of industrial sectors across the economy as most studies that use industrial averages do. It is therefore expected that the costs and intensity of R&D are relatively similar across all subdomains of biotechnology. With the exception of dSpinoff, which loses its significance in the endogeneity-corrected regression, the other coefficients remain relatively similar between regressions (2) and (5). Regression (3) adds the IP strategies to the regression. The logic is simple, if a firm has a clear strategy towards the protection of its IP, then it is more likely to patent. This is what the results indeed show. In addition, this regression does not change much of the results obtained in regression (1), with the exception of the revenues obtained from contracts which looses its significance. Controlling for potential endogeneity yields a positive but weakly significant coefficient for StratIP in regression (6). That being said, the Wald test does not reject the null hypothesis that there is no endogeneity. It is nevertheless interesting to comment on the potential instruments for StratIP. The first stage regression (in Appendix 2) presents significant results for the three instruments of this variable. A firm‟s strategy towards knowledge development has a positive and strongly significant effect on having also a clear IP strategy. In this case, the subdomain average, StratIPSD, contributes to explaining the propensity to having an IP strategy, the coefficient is positive and strongly significant. Surprisingly, however, the coefficient on the number of employees dedicated to biotech regulation, nbEmpReg, has a negative but weakly significant impact on IP strategy. We would have expected the opposite, as any strategy requires employees to implement it.. 18.
(22) Table 3 – Probit regression results for PatApp – SMEs excluding the 1999 survey SMEs without 1999 (1) (2) (3) nbCollPriv 0.0429 * 0.0417 * 0.0499 ** (0.0224) (0.0226) (0.0216) ln(FundGov) -0.0195 -0.0269 -0.0201 (0.0180) (0.0176) (0.0204) ln(FundVC) 0.0289 ** 0.0165 0.0239 * (0.0129) (0.0135) (0.0132) ln(FundDebt) -0.0089 -0.0098 -0.0114 (0.0222) (0.0223) (0.0234) ln(FundAng) 0.0641 *** 0.0644 *** 0.0652 *** (0.0197) (0.0207) (0.0212) nbEmpBio 0.0083 ** 0.0020 0.0084 *** (0.0033) (0.0034) (0.0032) HHIEmpBio -0.0357 0.0348 0.1355 (0.2131) (0.2203) (0.2183) Age -0.0001 -0.0005 -0.0009 (0.0060) (0.0065) (0.0064) dPub 0.1947 0.0479 0.1352 (0.1686) (0.1762) (0.1742) dMerg 0.2833 0.2140 0.2849 (0.1750) (0.1816) (0.1807) dSubsInt -0.1817 -0.3174 * -0.1873 (0.1655) (0.1672) (0.1687) dSpinoff 0.2948 *** 0.2580 ** 0.2412 ** (0.1148) (0.1181) (0.1214) ln(nbPat) 0.3608 *** 0.3112 *** 0.3291 *** (0.0647) (0.0657) (0.0647) ProdStage -0.1811 *** -0.1126 -0.1465 ** (0.0704) (0.0724) (0.0721) ln(RevContIn) -0.0484 ** -0.0555 ** -0.0336 (0.0225) (0.0230) (0.0226) ln(RevIPR) 0.0780 * 0.0640 0.0698 (0.0453) (0.0455) (0.0448) ln(RevSales) -0.0567 *** -0.0594 *** -0.0426 ** (0.0198) (0.0203) (0.0201) dExport 0.0168 0.1040 0.0330 (0.1306) (0.1313) (0.1356) ln(RDExp) 0.2306 *** (0.0340) StratIP 0.3248 *** (0.0470) ln(CostContOut). (4) 0.0402 * (0.0226) -0.0183 (0.0180) 0.0263 ** (0.0129) -0.0086 (0.0218) 0.0633 *** (0.0197) 0.0074 ** (0.0032) 0.0061 (0.2126) -0.0011 (0.0061) 0.1530 (0.1714) 0.2912 * (0.1702) -0.1849 (0.1655) 0.2462 ** (0.1164) 0.3456 *** (0.0655) -0.1584 ** (0.0698) -0.0439 * (0.0227) 0.0766 * (0.0456) -0.0524 *** (0.0198) 0.0408 (0.1306). (5) 0.0357 * (0.0204) -0.0306 * (0.0167) 0.0032 (0.0139) -0.0110 (0.0215) 0.0578 *** (0.0195) -0.0037 (0.0037) 0.1501 (0.2183) 0.0015 (0.0058) -0.0975 (0.1702) 0.1198 (0.1755) -0.4258 ** (0.1669) 0.1763 (0.1151) 0.2270 *** (0.0688) -0.0284 (0.0750) -0.0601 *** (0.0227) 0.0587 (0.0435) -0.0562 *** (0.0192) 0.1652 (0.1275) 0.4424 *** (0.0613). (6) 0.0479 ** (0.0221) -0.0198 (0.0200) 0.0255 * (0.0132) -0.0105 (0.0234) 0.0655 *** (0.0208) 0.0084 *** (0.0032) 0.0781 (0.2284) -0.0007 (0.0063) 0.1438 (0.1738) 0.2878 (0.1777) -0.1829 (0.1690) 0.2593 ** (0.1233) 0.3373 *** (0.0646) -0.1551 ** (0.0721) -0.0385 * (0.0232) 0.0704 (0.0446) -0.0479 ** (0.0204) 0.0247 (0.1356). (7) 0.0392 (0.0260) -0.0181 (0.0183) 0.0258 * (0.0151) -0.0086 (0.0217) 0.0637 *** (0.0202) 0.0072 (0.0044) 0.0166 (0.2605) -0.0013 (0.0066) 0.1426 (0.2233) 0.2913 * (0.1689) -0.1831 (0.1675) 0.2297 (0.2418) 0.3391 *** (0.1123) -0.1529 (0.1012) -0.0422 (0.0330) 0.0758 (0.0464) -0.0512 * (0.0268) 0.0459 (0.1447). 0.2130 * (0.1216). 0.0582 *** 0.0755 (0.0188) (0.2310) Constant -0.1618 -1.6174 *** -1.3405 *** -0.3368 -2.9398 *** -0.9485 * -0.3855 (0.3443) (0.4216) (0.3869) (0.3493) (0.5431) (0.5347) (0.7300) Sector, province and survey-year dummies Nb observations 811 811 811 811 811 811 811 Nb firms 528 528 528 528 528 528 528 193.56 *** 217.63 *** 235.6 *** 191.5 *** 298.15 *** 199.15 *** 191.7 *** Wald 2 LL -390.56 -369.85 -366.38 -386.07 -1796.39 -1513.96 -2322.10 Pseudo R2 0.3009 0.3380 0.3442 0.3089 Notes: ***, **, * correspond to the 1%, 5% and 10% levels of significance, respectively. Standard errors in parentheses. LL = Log Pseudolikelihood.. 19.
(23) The last potentially endogenous variable to be considered is the cost related to contracting out research activities, CostContOut. If a firm contracts out research activities, it may want to retain ownership of the IP developed outside the firm. In addition, because it is sometimes difficult to clearly identify the boundaries between what is the IP of the firm and what is being contracted out, or because part of the IP of the firm has to be „leaked‟ to the contractee in order to ensure that the contract work is successful and that the firm can appropriate the results within its processes, a firm is more likely to want to protect its IP from potential unwanted spillovers towards the contractee. Once again, there are no notable variations between regressions (1) and (4). Examining now what happens if we control for endogeneity, we find that CostContOut loses its significance in regression (7). Contracting out research activities does not seem to affect the decision to apply for a patent, once we control for endogeneity. Similarly to regression (6), the Wald test for exogeneity is not significant and implies that regression (4) is probably more appropriate. We will nevertheless comment on the first stage regression, as the results are interesting. We find that the number of collaborative agreements with public institutions has a positive impact on the decision to contract out research activities. Two phenomena may be at play here. First, collaborating firms are generally more open to external research activities and are therefore more likely to enter into formal contracting agreements with partners. Second, we suspect that although the questionnaire specifically stipulates that collaborative agreements are not contracts, firms may misinterpret or confuse the two. Very rarely, firms will collaborate with universities without there being a formal contract, whether financial or regarding the ownership and transfer of IP rights. As such, collaboration with university may appear as both contracts and collaborative agreements. We therefore suspect that measurement error is enhancing the significance of this variable. If firms collaborate, they have to acquire IP rights of the partner in order to be able to use the research results. This variable has a positive effect on the decision to contract out, but it is weakly significant. Surprisingly, the increasing number of biotech management employees that would be needed to put in place and monitor such contracting arrangements is not significant. Again, two phenomena may be influencing this result. First, the management of contracts may be part of a firm-based strategy and would thus not be part of the biotech management team. Second, firms may well neglect to recruit for various reasons, lack of funds being the obvious one, the necessary staff to supervise contracts and collaborative. 20.
(24) activities as well. This may contribute to their demise, but that is another story that we do not address in this paper. 5.. Discussion and conclusion. This paper studies which firms are more likely to be patenting their innovations. We build an econometric model of the firm characteristics associated with the propensity to file patent applications using the four Biotechnology uses and development surveys that Statistics Canada conducted in 1999, 2001, 2003 and 2005. Merging the four surveys into one database allows the construction of a quasi-longitudinal analysis of the data. Earlier in the paper we set out to validate five hypotheses related to external linkages and to the funding of innovation. Our results show that firms that collaborate with other firms have a higher propensity to patent, hence validating our first hypothesis (H1). Contrarily to our expectations, however, firms which contract out R&D activities also have a higher likelihood of patenting, hence refuting hypothesis H2. Our intuition was that contracting out reduces absorptive capacity of the firm, which then in turn reduces its capacity to patent. The data available does not allows the distinction between the provenance of patents, whether they were contracted out or whether they originated from the firm‟s own R&D. Three hypotheses were formulated relating to private funding and public support of biotech firms. By and large, we find support for only one of the hypotheses proposed. Angel funding and venture capital do have a positive effect on the propensity of a firm to patent (H3), but public direct funding (H5), when its effect is significant, it is negative. In contrast, debt financing is not detrimental (H4) to the firm as its effect is never significant. To generate patents, a firm needs to raise funds from venture capital and angels. When we take into account the influence of R&D expenditures, however, the importance of venture capital disappears, even when we instrument for R&D expenditures. It is also interesting to report some of the results on the control variables. Our results generally suggest that size has a positive influence on the propensity to patent. This is supported by the literature that generally includes large firms in their sample. Our research shows that this result still holds for SMEs and for a particular category of employees, those dedicated to biotechnology. Out of the basic characteristics of the firm, the fact of being a spinoff has the. 21.
(25) most significant effect on the likelihood that a firm files patent applications. A history of patenting also has a positive effect on the propensity to patent. On the one hand, this result disproves the intuition that the prime aim of biotechnology firms, especially spinoffs, is to bring the product for which the firm was created to the market, either via an IPO, the sale of the IPR or commercialisation. On the other hand, once a firm has the majority of its products in production or on the market, or that it generates more sales revenues, its propensity to patent decreases considerably, hence going against the previous argument. There are important limitations to this study. First, the four surveys were not planned as a longitudinal study, which limits our ability to follow the firms through their life cycle and the life cycle of their products. This is a domain where it can take 10 years to bring a particular drug to the market. Second, there are important holes in the database due to the non-response of firms from one survey to the next. It is imperative that in such high technology domains, where the time-to-market are extremely long, think for instance of genomics where it is expected that 15 years will be the norm, systematic longitudinal studies are put in place to be able to investigate the long term impact of public policies, such as R&D tax credits, direct grants, etc. In addition, our analysis has not managed to completely deal with the potential endogeneity, particularly that caused by R&D expenditures. Part of the endogeneity could be solved by lagged variables, but in the current dataset this reduces the sample of firms considerably. More research is needed to find the appropriate specification that would completely correct the endogeneity problems.. 22.
(26) 6.. References. Arundel, A., 2001. The relative effectiveness of patents and secrecy for appropriation. Research Policy 30(4), 611–624. Audretsch, D. and Lehmann, E., 2004. Financing high-tech growth: the role of banks and venture capitalists. Schmalenbach Business Review 56(4), 340-357. Baum, J. A. C., Calabrese, T., Silverman, B. S., 2000. Don‟t go it alone: Alliance network composition and startups‟ performance in Canadian biotechnology, Strategic Management Journal 21(3), 267–294. Baum, J. A. C., Silverman B. S., 2004. Picking winners or building them? Alliance, intellectual, and human capital as selection criteria in venture financing and performance of biotechnology startups, Journal of Business Venturing 19(3), 411-436. Bérubé, C., Mohnen, P. 2009. Are firms that receive R&D subsidies more innovative? Canadian Journal of Economics 42(1), 206-225. Brouwer, E., Kleinknecht, A. 1999. Innovative output, and a firm's propensity to patent: An exploration of CIS micro data. Research Policy 28(6), 615-624. Cincera, M. 2005. The link between firms‟ R&D by type of activity and source of funding and the decision to patent. DULBEA Working paper No. 05-10.RS. Cohen and Levinthal, 1990. Absorptive capacity: a new perspective on learning and innovation. Administrative Sciences Quarterly 35, 128–152. Czarnitzki, D., Ebersberger, B., Fier, A., 2007. The relationship between R&D collaboration, subsidies and R&D performance: Empirical evidence from Finland and Germany. Journal of Applied Econometrics 22(7), 1347-1366. Czarnitzki, D., P. Hanel, Rosa, J. M., 2011. Evaluating the impact of R&D tax credits on innovation: A microeconometric study on Canadian firms. Research Policy 40(2), 217-229. David, P. A., Hall, B. H., Toole, A., 2000. Is public R&D a complement or a substitute for private R&D? A review of the econometric evidence, Research Policy 29, 497–520.. 23.
(27) Deeds, D. L., Hill, C. W., 1996. Strategic alliances and the rate of new product development: An empirical study of entrepreneurial biotechnology firms, Journal of Business Venturing 11(1), 41–55. Deeds, D. L., Rothaermel, F. T., 2003. Honeymoons and liabilities: The relationship between age and performance in research and development alliances, Journal of Product Innovation Management 20(6), 468–485. Engel, D., Keilbach, M., 2007. Firm-level implications of early stage venture capital investment - An empirical investigation. Journal of Empirical Finance 14(2), 150-167. Faems, D., Van Looy, B., Debackere, K., 2005. Interorganizational collaboration and innovation: Toward a portfolio approach, Journal of Product Innovation Management 22(3), 238-250. Gilsing, V., Nooteboom B., 2006. Exploration and exploitation in innovation systems: The case of pharmaceutical biotechnology. Research Policy 35(1), 1-23. Gompers, P., Lerner, J., 2001. The venture capital revolution. The Journal of Economic Perspectives 15(2), 145-168. Greis, N.P., Dibner, M.D., Bean, A.S., 1995. External partnering as a response to innovation barriers and global competition in biotechnology. Research Policy 24, 609–630. Hagedoorn J., Schakenraad, J., 1990a. Strategic partnering and technological cooperation, in B. Dankbaar, J. Groenewegen and H. Schenk (eds), Perspectives in Industrial Organization, Kluwer Academic Publishers, The Netherlands, pp. 171-191. Hagedoorn J., Schakenraad, J., 1990b. Inter-firm partnerships and co-operative strategies in core technologies, in Freeman, C., Soete, L. (eds), New Explorations in the Economics of Technical Change, Pinter, London. Hagedoorn, J. (2002). Inter-firm R&D partnerships: An overview of major trends and patterns since 1960, Research Policy 31(4), 477–492. Hall, B. H., Van Reenen, J., 2000. How effective are fiscal incentives for R&D? A review of the evidence, Research Policy 29, 449–469. Hall, B. H., 2002. The financing of research and development. Oxford Review of Economic Policy 18 (1), 35–51.. 24.
(28) Hall, L. A., Bagchi-Sen, S. 2002. A study of R&D, innovation, and business performance in the Canadian biotechnology industry. Technovation 22(4), 231-244. Hellmann, T., Puri, M., 2002. Venture capital and the professionalization of start-up firms: empirical evidence. The Journal of Finance LVII (1), 169–197. Hussinger, K., 2006. Is silence golden? Patents versus secrecy at the firm level. Economics of Innovation and New Technology 15(6), 735-752. Kortum, S., Lerner, J., 1999. What is behind the recent surge in patenting? Research Policy 28, 1–22. Pisano G., Shan, W., Teece, D., 1988. Joint ventures and collaboration in the biotechnology industry, in Mowery, D.C. (ed.), International Collaborative Ventures in U.S. Manufacturing, Ballinger, Cambridge, pp. 183-222. Pisano, G., 2002. Pharmaceutical biotechnology. In: Nelson, R.R., Victor, D.G., Steil, B. (Eds.), Technological Innovation and Economic Performance. Princeton University Press, Princeton, pp. 346–366. Levinthal, D.A., March, J.G., 1993. The myopia of learning. Strategic Management Journal 14, 95–112. Lerner J., Shane H., Tsai A., 2003. Do equity financing cycles matter? Evidence from biotechnology alliances. Journal of Financial Economics 67, 411–446. March, J. G., 1991. Exploration and exploitation in organizational learning, Organization Science 2(1), 71–88. Nooteboom, B., 2000. Learning and Innovation in Organizations and Economies. Oxford University Press, Oxford. Owen-Smith, J., Powell, W. W., 2004. Knowledge Networks as Channels and Conduits: The Effects of Spillovers in the Boston Biotechnology Community. Organization Science 15(1), 5-21. Rogers, M., 2004. Networks, firm size, and innovation, Small Business Economics 22(2), 141– 153.. 25.
(29) Rothaermel, F. T., 2001. Complementary assets, strategic alliances, and the incumbent's advantage: an empirical study of industry and firm effects in the biopharmaceutical industry. Research Policy 30(8), 1235-1251. Rothaermel, F. T., Deeds, D. L., 2004. Exploration and exploitation alliances in biotechnology: a system of new product development. Strategic Management Journal 25 (3), 201–221. Rothaermel, F. T., Thursby, M. 2007. The nanotech versus the biotech revolution: Sources of productivity in incumbent firm research. Research Policy 36(6), 832-849. Shan, W., Walker, G., Kogut, B., 1994. Interfirm cooperation and startup innovation in the biotechnology industry, Strategic Management Journal 15(5), 387–394. Stuart, T.E., 2000. Interorganizational alliances and the performance of firms: A study of growth and innovation rates in a high-technology industry, Strategic Management Journal 21(8), 791–811.. 26.
(30) Appendix 1 Correlation matrix Variable dAllColl dCollPriv dCollPub nbAllColl nbCollPriv nbCollPub nbEmpRes nbEmpReg nbEmpMngt nbEmpBio HHIEmpBio Age dPub dMerg dSubsInt dSpinoff ln(RDExp) nbPat StratKnow StratIP nbProdRD nbProdPC nbProdRC nbProdPM ProdStage ln(CostContOut) ln(CostIPR) ln(RevContIn) ln(RevIPR) ln(RevSales) dExport ln(FundGov) ln(FundVC) ln(FundDebt) ln(FundAng) dFiscInc ln(FiscInc). 1 2 3 4 5 6 7 8 9 10 11 12 13 14 15 16 17 18 19 20 21 22 23 24 25 26 27 28 29 30 31 32 33 34 35 36 37. 1 2 3 1 0.6091* 1 0.6007* 0.2661* 1 0.3559* 0.3808* 0.3908* 0.2547* 0.3905* 0.1919* 0.3754* 0.1746* 0.6471* 0.1474* 0.1387* 0.0769* 0.0358 0.0785* 0.0417 0.1116* 0.0522 0.0751* 0.1083* 0.1032* 0.0699* 0.0339 0.0037 -0.0059 -0.0444 -0.0917* -0.0381 0.1193* 0.0916* 0.0608 0.0645 0.0090 0.0435 -0.0419 -0.0419 -0.0492 0.1541* 0.1283* 0.0826* 0.2041* 0.1445* 0.1121* 0.1245* 0.1132* 0.0749* 0.1549* 0.1230* 0.1273* 0.1205* 0.1134* 0.0708* -0.0144 -0.0059 0.0102 0.0160 0.0522 0.0397 0.0157 0.0253 0.0447 0.0540 0.0578 0.0828* -0.0649* -0.0806* 0.0021 0.2080* 0.1445* 0.1699* 0.1625* 0.1534* 0.0842* 0.0696* 0.1020* -0.0246 0.0960* 0.1134* -0.005 -0.0448 -0.034 -0.0687 0.0419 0.0068 0.0153 0.0596 0.0378 0.0419 0.1382* 0.0976* 0.0565 0.0214 0.0122 0.0201 0.0815* 0.0339 0.0635* 0.1689* 0.1130* 0.1858* 0.1842* 0.1376* 0.1619*. 4. 5. 1 0.9341* 0.6346* 0.1645* 0.0911* 0.0701* 0.1655* -0.0210 -0.0202 0.0666 -0.0101 -0.0360 0.0914* 0.1450* 0.0734* 0.0036 0.0248 0.0294 0.0446 0.0337 0.0932* -0.0300 0.1465* 0.0348 0.0839* 0.1086* -0.0487 0.0304 0.0121 0.0259 0.0142 0.0054 0.0971* 0.1232*. 1 0.3169* 0.1567* 0.0869* 0.0578 0.1473* -0.0568 -0.0066 0.0502 -0.0064 -0.0287 0.0706* 0.1211* 0.0577 -0.0173 -0.0003 0.0286 0.0367 0.0263 0.0297 -0.0467 0.0857* 0.0173 0.1012* 0.1211* -0.0357 0.0143 -0.0149 0.0108 -0.0041 -0.0091 0.0547 0.0837*. 6. 7. 8. 9. 10. 11. 12. 13. 14. 1 0.0894* 1 0.0892* 0.3860* 1 0.0730* 0.4524* 0.4946* 1 0.1441* 0.8141* 0.6296* 0.6668* 1 -0.1121* -0.0238 -0.0950* -0.0912* -0.1537* 1 -0.0395 -0.0410 0.0232 -0.0200 0.0047 0.0383 1 0.0682 0.2166* 0.2003* 0.2676* 0.2402* -0.1442* 0.0446 1 -0.0129 0.0731* 0.0686 0.0686 0.0846* -0.0908* 0.1331* 0.2348* 1 -0.0337 0.0541 0.0990* -0.0073 0.1054* 0.0176 0.2397* -0.0136 0.1957* 0.1047* 0.1021* -0.0132 -0.0187 0.0054 -0.0078 -0.2472* -0.0004 -0.0012 0.1332* 0.5192* 0.3125* 0.3140* 0.4666* -0.0425 -0.1496* 0.3310* 0.1439* 0.0622 0.2810* 0.1013* 0.1388* 0.2225* -0.0081 -0.0398 0.1202* 0.0602 0.0469 0.1001* 0.0532 0.0071 0.0311 0.0176 -0.0947* -0.0084 -0.0038 0.0664 0.1862* 0.0614 0.0980* 0.1198* -0.1200* -0.1218* 0.1338* 0.0401 -0.0169 0.0170 0.0122 0.0298 0.0107 0.0181 0.0752* -0.0312 -0.0076 0.0029 0.0351 0.0683* 0.0688* 0.0479 -0.0133 0.0224 0.0007 -0.0081 -0.0146 0.0879* 0.0568 0.0912* 0.0751* 0.0076 0.0245 -0.0051 -0.0056 0.0227 0.0417 0.027 0.0504 0.056 -0.0109 0.0019 -0.0318 0.0817* 0.0156 -0.1344* -0.1066* -0.1075* -0.0749* -0.0031 0.2187* -0.1556* -0.0300 0.1848* 0.2260* 0.1875* 0.1923* 0.1932* 0.0196 -0.0968* 0.2280* 0.0534 0.0550 0.1387* 0.0988* 0.1472* 0.1477* -0.1215* -0.0204 0.1047* 0.0981* 0.0037 0.1622* 0.0375 0.03 0.1372* -0.0639 -0.0329 -0.0263 0.0241 0.0262 0.2684* 0.0922* 0.1674* 0.2270* -0.0466 -0.0006 0.1775* -0.0247 -0.0521 0.0366 0.1426* 0.1326* 0.2010* -0.1369* 0.3246* 0.0297 0.0804* 0.0105 -0.0382 0.0181 0.0303 0.0534 -0.0484 0.1305* -0.0337 0.0148 0.0702* 0.0193 0.0153 0.0059 0.0365 -0.0586 -0.0432 0.0001 -0.0323 -0.0119 0.1734* -0.0035 0.1000* 0.0840* 0.0304 -0.1395* 0.0827* 0.0491 0.0388 0.0410 0.0088 0.0440 0.0815* -0.0534 0.0166 -0.0120 -0.0059 0.0089 -0.0308 -0.0158 -0.0108 -0.0507 -0.0075 -0.1131* 0.0070 0.0102 0.1351* 0.2104* 0.1105* 0.1095* 0.1825* -0.0668* -0.0408 0.0098 0.0679 0.1460* 0.4241* 0.2466* 0.2159* 0.3844* -0.1272* -0.0783* 0.0909* 0.1039*. 27.
(31) Appendix 1 Correlation matrix (continued) Variable dSubsInt dSpinoff ln(RDExp) nbPat StratKnow StratIP nbProdRD nbProdPC nbProdRC nbProdPM ProdStage ln(CostContOut) ln(CostIPR) ln(RevContIn) ln(RevIPR) ln(RevSales) dExport ln(FundGov) ln(FundVC) ln(FundDebt) ln(FundAng) dFiscInc ln(FiscInc). 15 16 17 18 19 20 21 22 23 24 25 26 27 28 29 30 31 32 33 34 35 36 37. Variable ln(RevIPR) ln(RevSales) dExport ln(FundGov) ln(FundVC) ln(FundDebt) ln(FundAng) dFiscInc ln(FiscInc). 29 30 31 32 33 34 35 36 37. 15 16 17 18 19 1 -0.0906* 1 0.0945* 0.1676* 1 0.0533 0.0761* 0.2337* 1 -0.0343 0.1292* 0.1636* 0.0604 1 -0.0209 0.1844* 0.3483* 0.1202* 0.4230* -0.0140 -0.0392 0.0128 0.0006 0.0573 0.0024 -0.0267 0.0558 0.0296 0.0141 0.1001* -0.0428 0.0686* 0.0174 -0.0309 -0.0011 0.0271 0.0078 0.006 -0.0308 0.0261 -0.1568* -0.3054* -0.0842* -0.0656 -0.0084 0.2059* 0.4302* 0.1420* 0.1792* -0.0105 0.0623 0.1597* 0.0801* 0.0226 -0.0035 -0.0328 0.0609 -0.0264 0.0304 -0.0379 0.0258 0.1693* 0.032 0.0696* 0.1134* -0.2680* -0.0706* 0.0486 -0.1227* -0.0013 -0.1076* -0.1397* -0.0757* -0.0394 -0.0282 0.0248 0.0615 -0.0074 0.0143 -0.0505 0.1847* 0.2146* 0.1354* 0.0274 -0.0224 -0.0536 0.0354 0.0079 -0.0313 -0.0571 0.0914* 0.0368 0.0642* 0.0313 -0.0254 0.1183* 0.3233* 0.0295 0.0857* -0.0004 0.1575* 0.5417* 0.0998* 0.1223* 29 1 0.0472 -0.0079 -0.0089 0.0213 0.0144 -0.0229 0.0487 0.1263*. 30. 31. 1 0.3342* 1 -0.0715* 0.0284 -0.1655* -0.0911* 0.0159 0.0465 -0.1631* 0.0081 -0.0755* 0.0095 -0.0642 -0.0869*. 20. 21. 22. 23. 1 0.0383 -0.0396 0.0018 0.0032 -0.1866* 0.2407* 0.0972* -0.1022* 0.0578 -0.2009* -0.1004* 0.0480 0.1816* 0.0359 0.0779* 0.1718* 0.2536*. 1 0.3974* 0.4309* 0.1841* 0.0000 0.0058 0.0119 -0.0068 0.1259* 0.0371 0.0109 -0.0197 -0.0158 -0.0126 0.006 0.0281 0.0025. 1 0.6587* 0.1463* -0.0479 0.0694* 0.0014 0.0034 0.1306* 0.0230 0.0344 -0.002 -0.0112 0.0150 -0.0076 0.0327 0.0155. 1 0.2327* -0.0453 0.0793* 0.0039 -0.0074 0.0100 0.0512 0.0330 -0.0155 -0.0193 -0.0082 0.0170 0.0306 0.0597. 33. 34. 35. 36. 37. 1 0.1365* 1 0.3030* 0.0436 0.1518* 0.0624* 0.0392 0.0911* 0.032 0.1509*. 1 0.0823* 0.0446 0.0794*. 1 0.0453 1 -0.0066 0.8425*. 1. 32. 28. 24. 25. 26. 1 0.0915* 1 0.0121 -0.2547* 1 0.1498* -0.0596 0.1586* 0.1030* 0.0102 -0.0756* -0.0206 -0.0889* 0.1045* 0.0901* 0.2793* -0.1555* 0.1011* 0.2892* -0.1154* -0.0072 -0.0128 0.0236 0.0756* -0.1036* 0.1685* 0.0181 -0.0207 0.0072 0.0035 -0.0425 0.0704* 0.0353 -0.0543 0.1814* 0.0396 -0.1435* 0.3125*. 27. 28. 1 0.0199 1 0.0909* 0.0967* 0.0478 0.0014 -0.0158 0.1060* 0.0050 0.0230 0.1167* -0.0667 -0.0075 0.0258 0.0290 -0.0546 0.0725* 0.0191 0.1410* 0.0424.
Figure

Documents relatifs
The reasons are the following: (i) in the domain of terminology and translation, a term in a source language does not always have an equivalent in the target language, (ii)
To evaluate WatDiv queries, S2RDF always needs less than 200 seconds excepting F1 (Figure 1c) and the average response time is 140 seconds.. Figure 1d presents the S2RDF results
(a) If the object point source is in the Jbcal plane, the two image spots in the image plane completely overlap. The depth position and disparity 2b are uniquely related. If
- نمرثكأةيناسنلإاةغملا ةميسو ا لاصت يتلا رصانعلاو ،تاودلأاو ،يوغملا لصاوتلا ةيمىأ نأشب نيرصاعملا نييوغملا نيب تابراقتلا وتى لك عمو " تانئاك
3 - يرئازجلا عمتجملا يف ةيوهلا ةمزلأ ةمعفملا لماوعلا دحأ ةملوعلا : ؿدابتلاو يفاقثلا وزغلا تايممع يمانت ىلا تدأ ةريغص ةيرق ؿاصتلااو ـلاعلاا ؿئاسو ؿضفب ـلاعلا
Le terme générique de « compilation », utilisé jusqu’à présent pour évoquer la production d’un programme exécutable à partir d’un fichier source, recouvre en fait deux
L’archive ouverte pluridisciplinaire HAL, est destinée au dépôt et à la diffusion de documents scientifiques de niveau recherche, publiés ou non, émanant des
Sur le modèle au fond de la fiction des juristes « performant » l’Etat au moyen du droit public, il faut penser les « conditions sociales qui font que cette fiction
