Almost-common path interferometer using the
separation of polarization states for digital
phase-shifting shearography
Vanessa Rosso Yvon Renotte
Serge Habraken,MEMBER SPIE Yves Lion
Université de Liège
Department of Physics HOLOLAB Bat. B5a, B-4000 Liège, Belgium E-mail: vanessa.rosso@ulg.ac.be
Fabrice Michel,MEMBER SPIE Vincent Moreau,MEMBER SPIE Bernard Tilkens
DEIOS s.a.
Liège Science Park-Spatiopole rue des Chasseurs Ardennais共WSL兲 B-4031 Angleur, Belgium
Abstract. An original experimental setup for shearography with metro-logical applications is presented. The simplicity and the efficiency of the setup are provided by a shearing device, a prism that separates the TE and TM polarization modes with a coating and a thin glass plate placed on its face. The use of this shearing device enables an in-line and almost-common path configuration for the shearing interferometer, a path that leads to high stability and a low sensitivity to external distur-bances. Moreover, the sensitivity of the interferometer can be easily ad-justed for different applications by varying the shearing amount with glass plates of different thicknesses or by moving the shearing device between two lenses along the optical axis. The temporal phase-shifting method is applied through the use of a liquid crystal variable retarder. © 2007 Society of Photo-Optical Instrumentation Engineers. 关DOI: 10.1117/1.2795632兴 Subject terms: shearography; speckle interferometry; polarizing device; phase-shifting; liquid crystal retarder.
Paper 070099R received Feb. 6, 2007; revised manuscript received Apr. 19, 2007; accepted for publication Apr. 20, 2007; published online Oct. 19, 2007.
1 Introduction
Recently, optical techniques using temporal phase-shifting, involving techniques such as digital speckle pattern interferometry,1,2 digital shearography,3 and fringe projection,4 have emerged as new and efficient techniques with nondestructive metrological applications, e.g., 3-D shape measurement, surface displacement determination, and strain field and vibrational analysis. Shearography, or speckle shearing interferometry, is a full-field noncontact optical technique generally used for the measurement of the gradient of the displacement of a mechanically or thermally loaded surface.3,5–7 Shearography, as for any technique based on speckle interferometry, is used to have a better resolution on the measured strains8共10−5兲 than other tech-nique such as the image correlation 共10−2, 10−3兲. Recent studies have also demonstrated the value of shearography for surface slope and shape measurements.9,10 Extensive work has been reported in this area and, further, different devices for the adaptation to shearography of the different types of shear encountered in conventional interferometry have been reported.11,12Some cases are listed hereafter.
Shearing interferometers can be divided into two types: first, those with almost-common optical path interferom-eters, e.g., those with a glass edge or a Wollaston prism as a shearing device,6,9,13 and second, those that use a modi-fied Michelson interferometer.14 In the first group, the two arms corresponding to the object beam and the reference beam are collinear and thus superimposed in one arm. Such a configuration enables the use of a laser with a low coher-ence length. This feature also makes the almost-common path interferometer less sensitive to external disturbances
and, thus, more convenient for industrial uses. However, the sensitivity of typical almost-common path interferom-eters is limited by the shearing amount that may be im-posed by the shearing device, e.g., a birefringent crystal6,7 and, as a consequence, it may be suitable for only a few applications. This problem doesn’t appear with the Michelson-type interferometer because the shearing amount can be easily modified.14
In this paper, an original setup for digital phase-shifting shearography is presented. The key element of the experi-mental setup is the shearing device, a prism with a coating and a thin glass attached plate that separates the two TE and TM polarization modes. This shearing device yields an almost-common path and an in-line configuration of the shearing interferometer, an arrangement that leads to a compact device that is less sensitive to external distur-bances. The separation of the polarization states has been chosen because it is a convenient method that enables one to always distinguish each interfering beam when they are collinear simply by the rotation of a polarizer. In the same way, the intensity of each interfering beam can be easily adjusted to have a high modulation in the resulting inter-ferograms. Moreover, the sensitivity of the interferometer can be easily modified for different applications by varying the shearing amount with glass plates of different thick-nesses or simply by moving the shearing device along the optical axis, as proposed by Valera and Jones.15The phase-shifting method is accomplished by using a liquid crystal variable retarder, which enables an easy positioning and a good handiness in the experimental setup relative to other phase shifters such as a piezoelectric translator2,3or a tech-nique using a highly birefringent optical fiber.15,16
Finally, to demonstrate the efficiency of this shearing interferometer, an experiment consisting of centrally load-0091-3286/2007/$25.00 © 2007 SPIE
sheared, thanks to a shearing device; the resulting interfero-gram is called a shearointerfero-gram. By comparing the shearo-grams recorded before and after loading of the object, fringes sensitive to the displacement derivative relative to the shearing direction can be obtained. Phase-shifting2,3,17 and unwrapping18–20techniques are usually used to process the phase information from these fringes to determine quantitatively the desired metrological parameter. In this paper, the general four-buckets17algorithm and the growing region20method were used, respectively, for phase-shifting and phase unwrapping.
In shearography, the unwrapped phase map ⌬unwrapped共x,y兲 obtained thanks to the temporal phase-shifting technique is related to the first derivative of the displacement field relative to the shearing direction Xi of the object speckle wavefront and described in good ap-proximation, when the shearing amount␦xiis small, by the following relationship:3 ⌬unwrapped=
冋
共KeX兲 u xi +共KeY兲 v xi +共KeZ兲 w xi册
␦xi, 共1兲 where K is the sensitivity vector of the interferometer andeX, eY, and eZ are the unit vectors, respectively, along the
X, Y, and Z directions. In the orthogonal coordinate system XYZ, the X direction is horizontal and the Y direction is vertical. The Z direction is from the object to the camera, it is out-of-plane and normal to the surface of the object共see Fig. 5 in Sec. 3.3兲. Also, u, v, and w are the components of the displacement vector u, respectively, along the X, Y, and Z directions. In this paper, the efficiency of the experimen-tal approach is demonstrated for the case of a pure out-of-plane displacement derivative measurement, i.e., the sensi-tivity vector K is orthogonal to the object plane共X,Y兲. The resulting posttreatment of the phase distribution, ⌬unwrapped共x,y兲, is then summarized by
⌬unwrapped=共KeZ兲
w
xi
␦xi. 共2兲
The out-of-plane displacement derivative relative to the shearing direction can be determined from Eq.共2兲.
3 Experimental Details
3.1 Shearing Device
The shearing device used in digital shearography splits the light coming from one object point to give two image points in the image plane. A pair of laterally sheared images is thus received by the image sensor. In other words, the
by tuning the laser emission wavelength.
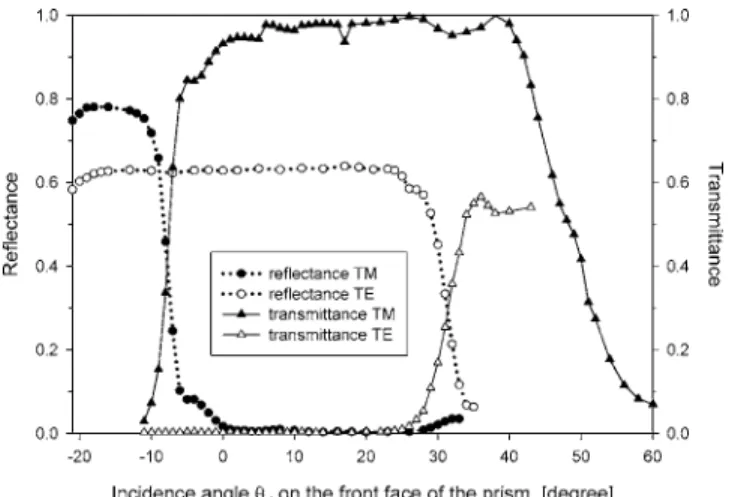
The key element of this shearing experiment is the shearing prism that separates the two polarization modes. The prism separates an incident wave into two orthogonal linearly polarized waves, a transverse electric 共TE兲 or s-wave and a transverse magnetic 共TM兲 or p-wave. The separation of the two polarization states is produced by a coating on the back face of a glass prism obtained from Edmund Optics. Theoretically the separation of the polar-ized states is optimal for a normal incidence on the front face of the prism. In this case, the emergent polarized TE and TM waves correspond, respectively, to the beams re-flected and transmitted by the coating, see Fig. 1共a兲. The behavior of the prism was checked by measuring the reflec-tance and transmitreflec-tance of the TE and TM polarized inci-dent waves共see Fig. 2兲. This figure indicates that at normal incidence, the separation of the two polarization modes can reach 93%. However, the separation is optimal for inci-dence angles ranging from 6 to 22 deg. To work in this optimal range, an incidence angle of 10 above 0 deg has been used herein关see Fig. 1共a兲兴.
To direct the TE and TM emergent waves in the same direction, a thin glass plate is attached on the coating of the prism with an oil of the same refractive index as the prism and the glass plate, n = 1.52, ensuring the continuity of the media. This glass plate directs by total reflection the TM polarized wave transmitted by the coating in the same di-rection as the reflected TE polarized wave. In this way, if the shearing is assumed to be parallel to the X axis, the TE and TM waves are separated by␦x, a distance that is pro-portional to the thickness of the glass plate关see Fig. 1共b兲兴. To produce interference between the two beams, a linear polarizer oriented between the TE and TM polarization di-rections must be introduced into the optical path of the parallel TE and TM beams. In practice, the orientation of the polarizer is chosen to equalize the intensities of the two interfering beams to have a high modulation in the resulting interferograms.
If the refraction through the coating and the thickness induced by the oil are neglected, we can follow the optical path of a ray of light with an incidence angleion the front face of the prism关see Fig. 1共c兲兴 in using the laws of refrac-tion共ris the refraction angle兲 and reflection. If the refrac-tive index of the prism follows the condition n艌
冑
2, the use of these laws enable the determination of the relation-ship between the shearing amount␦x, the thickness of the glass plate d, and the incidence anglei关see Figs. 1共c兲 and Fig. 3兴:␦x =
冑
2d cosi冉
1 +n sini
n2− sin2i
冊
. 共3兲
At normal incidence on the front face of the prism,i= 0. Equation 共3兲 is simplified and the shearing amount is ␦x =
冑
2d.3.2 Phase Modulator: A Liquid Crystal Variable Retarder
As with any interferometric technique that uses the tempo-ral phase-shifting method, it is necessary to record some interferograms that are phase shifted for comparison with others. To produce this phase shift, it is necessary to intro-duce a phase modulator into the experimental setup. In most of those experiments, a piezoelectric translator2,3 共PZT兲 is used for phase modulation. In contrast, for the interferometric experiments based on the separation of the TE and TM polarization states, the most reported phase
modulators2 are liquid crystal retarders21 or are based on highly birefringent optical fibers.15,16Contrary to the fiber-based phase modulator, the liquid crystal variable retarder presents the advantages of being very compact and so can be introduced in transmission anywhere in the experimental setup. Moreover, it is less temperature dependent.
In our experimental shearography setup, which is de-scribed in Sec. 3.3, a liquid crystal variable retarder from Meadowlark Optics共model LVR-200 with basic controller D3040, phase uncertainty:21 /28兲 is used to perform the phase-shifting technique. When combined with other opti-cal components, liquid crystal variable retarders produce electrically controllable attenuation, linear polarization ro-tation, or phase modulation. Pure phase modulation is ac-complished by aligning the optical axis of the liquid crystal
Fig. 1 共a兲 Schematic of the separation of an incident light beam into two TE and TM polarized beams
as a result of a coating on the back face of a prism and共b兲 schematic of the shearing prism. To direct the TE and TM emergent waves in the same direction, a thin glass plate is attached to the coating of the prism with an oil whose refractive index n is 1.52. The TE and TM polarized beams are sheared by
␦x, a distance that is proportional to the thickness of the glass.共c兲 Schematic of the optical path
followed through the shearing prism by a ray of light with an incidence angleion the front face and
giving rise to a shearing amount depending on the incidence angleiand the thickness d of the glass
plate.
Fig. 2 Transmittance and reflectance of the TE and TM waves
ob-tained at=532 nm as a function of the angle of incidence on the front face of the shearing prism. The sign of the angle of incidence is defined in Fig. 1共a兲.
Fig. 3 Evolution of the shearing amount,␦x as a function of both the
thickness d of the glass plate placed on the coating of the prism and the incidence anglei. The blackened area represents the usual
retarder parallel to a linearly polarized input beam. Such a phase modulator uses nematic liquid crystal materials to electrically control polarization. It provides tunable retarda-tion by changing the effective birefringence of the material with an applied voltage.
The calibration of the phase modulator is accomplished by determining the phase shift it induces versus the applied voltage. The liquid crystal variable retarder is well known for exhibiting a high nonlinearity versus the applied volt-age, and thus, it has been calibrated in situ, following the approach of Ochoa and Huntley.22This consists of record-ing two images, namely, one before and one after applyrecord-ing a known voltage step to the phase modulator. The mean square intensity difference between the two images, ob-tained by averaging over all of the pixels in the image, can then be plotted as a function of V, the voltage applied while recording the second image. Figure 4 shows the resulting calibration curve of the liquid crystal variable retarder ob-tained with the experimental setup of shearography that is described in Sec. 3.3.
3.3 Almost-Common Path Interferometer for Shearography
The design of the experimental setup, which uses a pure out-of-plane digital shearography arrangement is illustrated in Fig. 5. The 532 nm wavelength light comes from a Nd-YAG laser with a total output power of 30 mW. The object speckle pattern was produced by retroscattering of the in-cident light from a test object. The shearograms, recorded by a CMOS camera 共from Lumenera Corporation, model LU105C: 15 frames per second at full 1280⫻1024 resolu-tion兲, arise from the interference between the object speckle wavefront and the same speckle wavefront shifted spatially along the X axis by the shearing device. The behavior of the latter is explained in Sec. 3.1. A second prism was attached with oil with a refractive index n = 1.52 on the shearing device 共Fig. 5兲 to make the interferometer compact and in-line. The second prism is a traditional nonpolarizing
glass prism but is silver coated for better reflectivity; it has the same dimensions as the first shearing prism. To produce interference between the two emergent polarized beams, a linear polarizer oriented between the TE and TM polariza-tion direcpolariza-tions is introduced in front of the objective of the CMOS camera. A set of four shearograms, phase shifted with respect to one another, are recorded for a state of the studied object by varying the voltage applied to the liquid crystal variable retarder that was placed between the second prism and the polarizer. The slow and fast axes of the phase modulator are oriented, respectively, along the TE and TM polarization directions.
Finally, two identical lenses L1 and L2with an effective focal length of 6 cm were introduced into the experimental setup共see Fig. 5兲. The role of L1is to focus the TM speckle wavefront on the glass-air interface of the shearing device and, consequently, to avoid any variation in the shearing amount as the result of a nonuniform thickness of the thin glass plate. The second lens, L2, which defocuses the waves, also increases the shearing amount in proportion to its magnification Mlens, and thus, the shearing amount be-hind L2 is
␦xlens= Mlens␦x. 共4兲 To simplify the following notation, the value␦xlens of the shearing amount behind lens L2 will simply be referred to as␦x.
The shearing amount can be changed by replacing the thin glass plate attached to the coating of the prism by another with a different thickness d. On the other hand, according to Eq. 共4兲, the shearing amount varies with the magnification Mlens that can be modified by moving the shearing device between the two lenses L1 and L2, as pro-posed by Valera and Jones.15
The resulting experimental setup is an almost-common path interferometer, i.e., the object and reference beams follow almost the same geometric path before interference. Thus, because the two interfering beams would be equally disturbed, this interferometer has the advantage of being less sensitive to external disturbances than traditional digi-tal speckle interferometers. Moreover, this shearographic interferometer is compact and uses a CMOS camera, know-ing that CMOS technology is well recognized today to be implemented in low-cost commercial devices. It also uses a
Fig. 4 Calibration curve of the phase modulator, a liquid crystal
vari-able retarder, obtained with the experimental shearography setup. In the case of the four-buckets algorithm, the incremental phase␣ =/ 2 is obtained by applying, for example, successively 1500, 1890, 2166, and 2371 mV to the liquid crystal cell.
Fig. 5 Experimental setup of the out-of-plane almost-common path
liquid crystal variable retarder that does not present a hys-teresis effect, while a PZT must be compensated and thus makes it more expensive to eliminate the hysteresis effect,21 and that is almost 15 times faster than a PZT with almost the same resolution21共phase uncertainty ⬇/25兲.
3.4 Studied Object and the Loading System
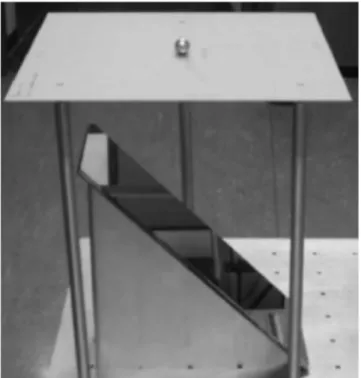
The object to be studied is a 300⫻300⫻1 mm3steel plate pierced by three holes in an isosceles triangle arrangement, holes that will become the three points supporting the plate. The steel plate was placed on three balls held by three steel posts screwed into an optical table, as shown in Fig. 6. A fourth smaller hole is placed at the center of gravity of the isosceles triangle to hold, in a reproducible fashion, a ball of known mass m. The plate is thus centrally loaded and the applied force F is equal to the weight of the ball, i.e., 0.118 N for a ball with a mass of 12 g. This horizontal object-loading system can be used thanks to a mirror at 45 deg placed under the steel plate共see Fig. 6兲 that reori-ents the light along the out-of-plane Z direction. However, to not complicate Fig. 5, a usual vertical object-loading system is represented in the共X,Z兲 plane.
Only a portion of the steel plate was scanned by the shearographic interferometer so, in the following, the stud-ied area of the steel plate is a square with a side of 87 mm centered on the load.
4 Results and Discussion
The wrapped phase map共see Fig. 7兲 was obtained with the four-buckets algorithm17 applied to the phase-shifted shearograms recorded for the steel plate before and after loading. The wrapped phase map of Fig. 7 was obtained with the experimental setup shown in Fig. 5 for a shearing of 8.4 mm, corresponding to a 0.35-mm-thick glass plate
and Mlens= 17, and the 12 g loading shown in Fig. 6. Before unwrapping the phase map, the noise was reduced by fil-tering with a convolution mask of dimension three applied at the sine/cosine18,23,24 level. The filtered wrapped phase map is shown in Fig. 8 and the corresponding phase un-wrapped by the region-growing technique in Fig. 9. Ac-cording to Eq.共2兲, the out-of-plane displacement derivative
Fig. 6 Photograph illustrating the central loading of a steel plate
with a 12 g ball.
Fig. 7 Wrapped phase map obtained with the shearographic
inter-ferometer illustrated in Fig. 5 and the loading illustrated in Fig. 6. The shearing amount␦x is 8.4 mm and the thickness of the glass
plate is d = 0.35 mm.
Fig. 8 Wrapped phase map of Fig. 7 filtered once at the sine/cosine
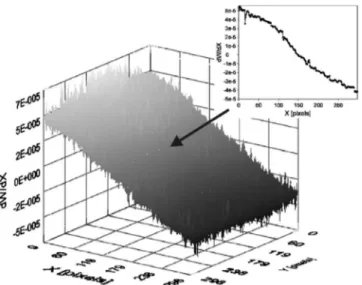
relative to the X direction,w /x, can be determined from the filtered and unwrapped phase map, Fig. 9; the quantita-tive results are presented in three dimensions in Fig. 10. A detailed error analysis yields to a relative uncertainty of 8% on the results shown in Fig. 10, due to the phase uncer-tainty and mainly to the relative unceruncer-tainty on the shearing amount共up to 8%兲.
If a heavier load is used, the number of fringes observed in the wrapped phase map naturally increases共see Fig. 11兲 until the contrast of the fringes suddenly decreases because of the high spatial frequency of the fringes and the noise present in the image. Contrary to most almost-common
path interferometers in which the shearing amount is fixed, in this interferometer, the sensitivity can be modified by varying the shearing amount. Figure 12 shows the wrapped phase maps obtained with the 12-g loading shown in Fig. 6 and the experimental design of Fig. 5, but with a thinner, 0.16 mm, and a thicker, 0.56 mm, glass plate, yielding shearings of 3.9 and 13.6 mm, respectively共Mlens= 17兲. As predicted by Eq.共2兲, a suitable number of fringes to main-tain a good contrast can be obmain-tained by using a short shear-ing amount, if the strain is important, and a longer amount, if the load is small.
Consequently, this interferometer maintains both the ad-vantages of the Michelson-type interferometer because it enables one to adjust its sensitivity for different
applica-Fig. 9 Phase map of applica-Fig. 8 unwrapped by the region-growing
technique.
Fig. 10 Out-of-plane displacement derivative relative to the X
direc-tion,w /x, determined from the unwrapped phase map of Fig. 9
and the corresponding profile along the shearing X direction, pass-ing by the loadpass-ing point.
Fig. 11 Filtered共mean mask of dimension 3兲 and wrapped phase
map obtained with the shearographic interferometer of Fig. 5 with
␦x = 8.4 mm and the loading system of Fig. 6, but with a ball with a
mass of 23 g.
Fig. 12 Filtered共mean mask of dimension 3兲 and wrapped phase
map obtained with the loading system of Fig. 6 and a 12-g ball and the shearographic interferometer of Fig. 5, but with different shear-ing amounts obtained with glass plates of different thicknesses:共a兲
tions by varying the shearing amount, and the advantage of an almost-common path interferometer, a compact in-line experimental setup with good stability to external disturbances.
5 Conclusions
An almost-common path shearographic interferometer for applications in temporal phase-shifting interferometry was developed and the behavior of the main elements constitut-ing the interferometer were studied. The shearconstitut-ing device, which is the key element of the interferometer, is a prism that separates the TE and TM polarization states with a coating and an attached thin glass plate.
This shearing device and the use of components such as a CMOS camera and a liquid crystal variable retarder en-able a compact, in-line, and low-cost almost-common path experimental setup that is less sensitive to external distur-bances and that enables one to adjust its sensitivity for dif-ferent applications by varying the shearing amount.
Finally, phase maps were presented that prove the effi-ciency of the experimental setup for the case of an out-of-plane displacement derivative measurement.
Acknowledgments
Fabrice Michel and Vincent Moreau were supported by a “FIRST” project grant by the Region Wallonne Govern-ment 共DGTRE兲. The authors thank both the Centre Eu-ropéen d’Archéométrie—University of Liège—and the Communauté Française for their support.
References
1. R. Jones and C. Wykes, Holographic and Speckle Interferometry Cambridge Univ. Press, Cambridge共1989兲.
2. P. K. Rastogi, Digital Speckle Pattern Interferometry and Related
Techniques, John Wiley & Sons, Chichester共2001兲.
3. W. Steinchen and L. Yang, Digital Shearography, SPIE Press, Bell-ingham, WA共2003兲.
4. C. A. Walker, Ed., Handbook of Moiré Measurement, Series in Optics and Optoelectronics, IOP Publishing Ltd., Bristol共2004兲.
5. Y. Y. Hung, “A speckle-shearing interferometer: A tool for measuring derivatives of surface displacements,” Opt. Commun. 11共2兲, 132–135 共1974兲.
6. V. M. Murukeshan, O. L. Seng, and A. Asundi, “Polarization phase shifting shearography for optical metrological applications,” Opt.
La-ser Technol. 30共8兲, 527–531 共1998兲.
7. Y. Y. Hung, “Applications of digital shearography for testing of com-posite structures,” Comcom-posites, Part B 30共7兲, 765–773 共1999兲. 8. G. Montay, M. François, M. Tourneix, B. Guelorget, C.
Vial-Edwards, and I. Lira, “Analysis of plastic strain localization by a combination of the speckle interferometry with the bulge test,” Opt.
Lasers Eng. 45共1兲, 222–228 共2007兲.
9. H. M. Shang, Y. Y. Hung, W. D. Luo, and F. Chen, “Surface profiling using shearography,” Opt. Eng. 39共1兲, 23–31 共2000兲.
10. R. M. Groves, S. W. James, and R. P. Tatam, “Shape and slope measurement by source displacement in shearography,” Opt. Lasers
Eng. 41共4兲, 621–634 共2004兲.
11. J. C. Wyant, “Double frequency grating lateral shear interferometer,”
Appl. Opt. 12共9兲, 2057–2060 共1973兲.
12. K. Matsuda and M. Namiki, “Holographic lateral shear interferom-eter for differential interference contrast method,” J. Opt. 11, 81–85 共1980兲.
13. Y. Y. Hung and C. E. Taylor, “Measurement of slopes of structural deflections by speckle-shearing interferometry,” Exp. Mech. 14共7兲, 281–285共1974兲.
14. A. R. Ganesan, D. K. Sharma, and M. P. Kothiyal, “Universal digital speckle shearing interferometer,” Appl. Opt. 27共22兲, 4731–4734 共1988兲.
15. J. D. Valera and J. D. C. Jones, “Phase stepping in fiber-based speckle shearing interferometry,” Opt. Lett. 19共15兲, 1161–1163 共1994兲. 16. R. M. Groves, S. W. James, and R. P. Tatam,
“Polarization-multiplexed and phase-stepped fibre optic shearography using laser wavelength modulation,” Meas. Sci. Technol. 11, 1389–1395共2000兲. 17. K. Creath, “Phase-shifting speckle interferometry,” Appl. Opt.
24共18兲, 3053–3058 共1985兲.
18. D. C. Ghiglia and M. D. Pritt, Two-Dimensional Phase Unwrapping:
Theory, Algorithms, and Software, Wiley, New York共1998兲.
19. T. J. Flynn, “Two-dimensional phase unwrapping with minimum weighted discontinuity,” J. Opt. Soc. Am. A 14共10兲, 2692–2701 共1997兲.
20. A. Baldi, “Phase unwrapping by region growing,” Appl. Opt. 42共14兲, 2498–2505共2003兲.
21. P. Slangen and B. Gautier, “Nematic liquid crystals light valve cali-bration and application to phase shifting speckle interferometry,” in
Speckle06: Speckles, From Grains to Flowers, P. Slangen and C.
Cerruti, Eds., Proc. SPIE 6341, 63410C共2006兲.
22. N. A. Ochoa and J. M. Huntley, “Convenient method for calibrating nonlinear phase modulators for use in phase-shifting interferometry,”
Opt. Eng. 37共9兲, 2501–2505 共1998兲.
23. V. Rosso, F. Michel, V. Moreau, Y. Renotte, B. Tilkens, and Y. Lion, “Highlighting properties of filters for their application in temporal phase shifting interferometry,” in Photonic Applications in
Biosens-ing and ImagBiosens-ing, W. C. Chan, K. Yu, U. J. Krull, R. I. Hornsey, B. C.
Wilson, and R. A. Weersink, Eds., Proc. SPIE 5969, 626–635共2005兲. 24. H. A. Aebischer and S. Waldner, “A simple and effective method for filtering speckle-interferometric phase fringe patterns,” Opt.
Com-mun. 162共4–6兲, 205–210 共1999兲.
Vanessa Rosso received her BSc and MSc
in physics from the University of Liège, Bel-gium, in 2002 and 2004, respectively. She joined the Laboratory of Holography 共HOLOLAB兲 in 2001 where she has studied nonlinear optical effects in nanoparticles doped xerogels. Currently she is working on her PhD thesis about metrological applica-tions of speckle interferometry and particu-larly shearography.
Yvon L. Renotte received his PhD in
phys-ics in 1973 from the State University of Liège, Belgium, where he taught optics to graduate and postgraduate students in the faculties of science and civil engineering. For many years, he worked on photographic processes in cooperation with Agfa-Gevaert Co., Antwerp, Belgium. He is currently in-volved in programs of holographic recording materials such as AgHal, dichromatedge-latine, photopolymers, and photoresists, op-tical metrology, and the study, fabrication, and testing of computer calculated holographic optical elements and guided-mode reso-nance filters. He is also a consultant for DEIOS, s.a., a spin-off developing 3D recording systems for archaeological and medical applications. He is a member of SPIE and ECO and is president of the Belgian Commission for Optics.
Serge Habraken received his PhD in
phys-ics in 1995 from the University of Liege, Bel-gium 共ULg兲, and he researched diffractive optics and holography. After completing his thesis, he joined the Space Center of Liege 共CSL兲 where he worked as project manager, then lead of a research and development group involved in microfabrication for optics. In 2005, he became a professor in the Physics Department of the ULg, sharing the direction of the HOLOLAB with Prof. Yves Lion. He is still attached to the CSL and manages the cross activities between both institutes.
and surface plasmon resonance. During the academic year 2004–2005, he supervised students from the Applied Sciences Faculty during their physics laboratories and he has begun to work on interferometry 共shearog-raphy兲. Since then, he has been simulta-neously working on his PhD thesis and in the research and development department of DEIOS, s.a. His research interests include non-destructive testing by shearography, thin-film optical systems, and optical engineering for industry.
physics in 1994, his MSc degree in opto-electronics in 1995, and his PhD in physics in 2003 from the University of Liège, Bel-gium. He also performed research in the HOLOLAB, Physics Institute of the Univer-sity of Liège. Since 2004, he has been the CEO of DEIOS, s.a., a company involved in optical metrology and the engineering of dedicated optical solutions.