Calibration
Validation
Criteria
Units
:\lIn-:\lax
:\Iean
SD
n
SEC
SD/SEC
n
SEP
SD/SEP
Vitamin C
mg/IOOg DM 0.17 - 75.0
13.5
12.4
800
3.4
3.7
295
4.9
2.0
POQ'phenol
J.lglg
276 - 7300
1186
720
2000
178
4.1
6"-
~J140
5.1
Brlx
0brix
7.2 - 20.9
12.3
1.6
1000
0.45
3.6
853
0.37
4.3
lASe
of
N IR
s;peckyos.c,lYpkj
fOY
tVie ~eteYV\A,tv\'/Attov\'
of
tV\,teYV\,/AL
q u/ALttkj of
eV\,ttye
/AppLes.
G. Sinnaeve', J.A. Fermindez Pierna', G. Lognay2, A. Rondia', P. Dupont', T. Donis', V. Baeten'", A. Mouteau', J-M Romn.;.,' and M Lateur'
IWaIloon Agricultural Research Centre (CRA-W), Quality of Agricultural products Departrnen~ Chaussee de Narnur 24, 5030; Gembloux, Belgium 2FUSAGx, Faculte Universitaire des Sciences agronomiques, Gembloux 5030. Belgium
*E-mail: [email protected]
t
~tyO~ uctw~
This work is perfonn in the framework of the HiDRAS program (High
-
Quality Disease Resistant Apples for a Sustainable agriculture). The aim is to build up a specific apple data base which should allow the breeders to make a much better use ofthe tremendous diversity conserved in many European Genetic Resources collections.The present work investigated the use of NIR to assess the internal quality of apples by detennining Vitamin C, total polyphenol and sugar contents (brix).
MClteriCll Cl~~ V1A.et~o~5
Samples
In this study, a large amount of
apple
samples
(n= 2500)
were
collected
to
cover
a
broad
variability
including
several
varieties and cultivars harvested
between
2004
and 2007. Figure I
presents the PCA analysis showing
the homogenous distribution of the
samples.
Data acquisition
The spectra were acquired
by a FOSS NIRSystems
6500
scanning
monochromator
(400-2500,
2 nm) with the DCA
module (Direct Contact Analysis) (figure 3). The instrument is
placed upside down in order to place the iTuit directly on the
detector's window. To integrate the variability of the iTuit, 4
measurements have been perfonned by rotating the apple.
'1.'11 1.18 I."~:'><,'::.,/~ UII UI tJ
'~
)
' ,,,-.
.
'
'-Figure 1 -Apple spectra: Principal Component Analysis
Wet chemistl.y
Concerning the reference values, the content of vitamin C was detennined by HPLC (figure 2), the total polyphenol content was obtained by the Folin-Ciocalteau method and the sugar content was obtained on the basis of a polarimetric Brix
determination.
i""
I.
t
Figure 3- FOSS-MIISystems 6500 with Direct ConJent AnalysisData teatlnent
The Winisi III package was used for preparing the spectra and for the exploratory analysis by Principal Component Analysis (PC A). Calibration models have been developed by using the Least Squares Support Vector Machine (LS-SVM) algorithm built in a Matlab environment (Matlab 7.5,0 R200Th). The database has been split into calibration and test sets. The LS-SVM models have been constructed using the calibration set and validated using the test set.
Figure 2 - DistribuJion of vitamin C
R.t5ults
CI~~ ~t5CU55W~
The best results have been obtained with a Savitsky-Golay first derivative (9,2,1) as preprocessing. The accuracy obtained with the LS
-
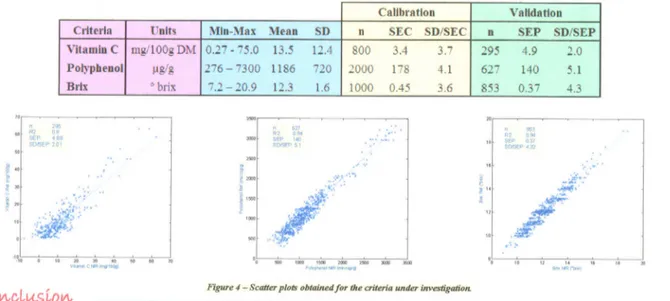
SVMregression technique (see table I) allows a good estimate of the internal quality of entire apples. Figure 4 shows the scatter plots obtained on
the validation sets for the criteria under investigation.
Table 1 - Characteristics of the apple doJa base and performances of the LS
-
SVM modelsn 295 60~ ~p ~:9 SOISEP201 n 671 RZ 0.94 SEP 140 SI:lISEP 51
...
nRZ 65309<1 SEP 1137 SDJSEP432 ~.ro~
J! 30 ~ ro~. ,
'.
/;jJP''''
""....
",." ~1OJOi
"8 j1~ ij' t ;f1( £ -$'.:' ...w,';.
:l1h:
.~.
. .~r:';'~'
.,~,
.:.'
..":--.1~1; °t 8i :HI 30 40 vn"""C"'R(m11(!.Oj)1000 1500 ]((I) :MOO bOO
Po""p"'r"(Ilf¥j(rm;"'~
1( _"'Rf'tm>
GO~clU5W~
Figure 4-
Scatter plots obtained for the criteria under investigatiolt- The
achieved results indicate that NIR could be used in breeding programs to assess the internal quality of entire apples.- Although the vitamin C content is rather low, as it is concentrated in the outer layer of the iTuits, NIR in reflectance mode can be used to have an estimate of low concentration levels of Vitamin C.
- The total polyphenols determined by the Folin-Ciocalteau method can be predicted by NIR