Objective: Posttraumatic amnesia is superior to the initial Glasgow
Coma Scale score for predicting traumatic brain injury recovery, but it takes days/weeks to assess. Here, we examined whether
return of visual fixation—a potential marker of higher cognitive function—within 24 hours of ICU admission could be used as an early predictor of traumatic brain injury recovery.
Design: Two-phase cohort study. Setting: Level-I trauma ICU.
Patients: Moderate-to-severe traumatic brain injury discharged
alive between 2010 and 2013.
Interventions: None.
Measurements and Main Results: Return of visual fixation was
assessed through standard behavioral assessments in 181 trau-matic brain injury patients who had lost the ability to fixate at ICU admission (phase 1) and compared with posttraumatic amnesia duration and the initial Glasgow Coma Scale score to predict perfor-mance on the Glasgow Outcome Scale-Extended 10–40 months after injury (n = 144; phase 2a). A subgroup also completed a visual attention task (n = 35; phase 2b) and a brain MRI after trau-matic brain injury (n = 23; phase 2c). With an area under the curve equal to 0.85, presence/absence of visual fixation at 24 hours of ICU admission was found as performant as posttraumatic amne-sia (area under the curve, 0.81; difference between area under the curve, 0.04; p = 0.28) for predicting patients' Glasgow Outcome Scale-Extended score. Conversely, the initial Glasgow Coma Scale score was not (area under the curve, 0.63). Even when controlling for age/medication/CT scan findings, fixation remained a significant predictor of Glasgow Outcome Scale-Extended scores (β, –0.29; p < 0.05). Poorer attention performances and greater regional brain volume deficits were also observed in patients who could not fixate at 24 hours of ICU admission versus those who could. Conclusions: Visual fixation within 24 hours of ICU admission could
be as performant as posttraumatic amnesia for predicting trau-matic brain injury recovery, introducing a new variable of interest in traumatic brain injury outcome research. (Crit Care Med 2016; 44:e1186–e1193) Key Words: Glasgow Coma Scale; outcome prediction; posttraumatic amnesia; traumatic brain injury; visual fixation Copyright © 2016 by the Society of Critical Care Medicine and Wolters Kluwer Health, Inc. All Rights Reserved. DOI: 10.1097/CCM.0000000000001960 *See also p. 2292. 1Hôpital du Sacré-Cœur de Montréal, Montreal, QC, Canada. 2Department of Psychology, Université de Montréal, Montreal, QC, Canada. 3Université de Montréal, Faculty of Medicine, Montreal, QC, Canada. 4Department of Psychology, Université du Québec à Montréal, Montreal, QC, Canada. 5Université de Montréal, Faculty of Dental Medicine, Montreal, QC, Canada. 6Coma Science Group, GIGA, Cyclotron Research Centre and Neurology Department, University and University Hospital of Liege, Liege, Belgium. This study was conducted in a level-I trauma ICU at Hôpital du Sacré-Coeur de Montréal, Montreal, QC, Canada. Supplemental digital content is available for this article. Direct URL cita-tions appear in the printed text and are provided in the HTML and PDF versions of this article on the journal's website (http://journals.lww.com/ ccmjournal).
Supported, in part, by the Canadian Institutes of Health Research (CIHR; operating grant to Dr. Gosselin and a postdoctoral fellowship to Dr. Arbour), Fonds de la Recherche du Québec—Santé (FRQ-S; Salary award to Dr. Gosselin), Quebec Rehabilitation Research Network post-doctoral fellowship and a trainee bursary from the Quebec Pain Research Network both awarded to Dr. Arbour. Dr. Arbour received funding from a Postdoctoral fellowship by the Canadian Institute of Health Research, Postdoctoral fellowship by the Quebec Rehabili-tation Research Network, and Trainee bursary from the Pain Quebec Research Network. Ms. Baril received funding and received support for article research from the Canadian Institutes of Health Research and Fonds de la recherche du Québec en Santé. Dr. Lavigne received support for article research from Canada Research Chair and Hospital research funds for Trauma. Dr. Desau-tels' institution received funding from a Research Grant from GlaxoSmithKline, Research Grant from Novartis, and Research Grant from Jazz Pharmaceuti-cals. Dr. Gosselin disclosed receiving other support and received support for article research from the Canadian Institutes of Health Research Fonds de la recherche du Québec–Santé. The remaining authors have disclosed that they do not have any potential conflicts of interest. For information regarding this article, E-mail: [email protected]
Visual Fixation in the ICU: A Strong Predictor of
Long-Term Recovery After Moderate-to-Severe
Traumatic Brain Injury*
Caroline Arbour, RN, PhD
1,2; Andrée-Ann Baril, BSc
1,3; Harrison J. Westwick, MD, MSc
1,3;
Marie-Julie Potvin, PhD
1,4; Danielle Gilbert, MD, FRCPC
1,3; Jean-François Giguère, PhD, MD
1;
Gilles J. Lavigne, DMD, PhD
1,5; Alex Desautels, MD, PhD, FRCPC
1,3; Francis Bernard, MD, FRCSC
1,3;
I
n the first hours after admission, the Glasgow Coma Scale (GCS) score is used by clinicians to estimate traumatic brain injury (TBI) severity and recovery (1). However, the GCS score is not a consistent predictor of long-term outcome after TBI (2, 3). Duration of posttraumatic amnesia (PTA) con-versely is considered by many experts as the most robust pre-dictor of TBI recovery, but it can only be established through repeated cognitive assessments and over many days/weeks (2–5). In recent years, several early predictors of TBI recovery have been identified including age, the GCS motor subscore, pupil reactivity, and CT (6, 7). Although these predictors were found useful for outcome estimation in large cohorts of TBI patients, they could have higher predictive value in milder TBI compared with severe ones (8). These predictors were also found less robust than PTA to estimate TBI outcome (9). Thus, there is a need to identify additional predictors of recovery in moderate-to-severe TBI to refine existing models and make them more performant at the individual level (10).In the ICU, examination of the integrity of the visual system through standard behavioral assessment can be used to screen and monitor TBI recovery (11, 12). Although the mechanisms of visual disruption after TBI are not fully understood, the princi-pal brain areas responsible for the exhibition of eye movements including the frontal eye field (FEF), parietal eye field (PEF), and supplementary eye field (SEF), as well as the midbrain and the pons, are vulnerable to brain trauma (13). In addition, acute and persistent impairments in voluntary-mediated eye move-ments such as intentional saccades and eye tracking were found to be a strong predictor of poor functional and attentional out-comes after mild TBI (14, 15). Unfortunately, assessment of sac-cades and eye tracking requires to be sustainably awake, which is not always possible in ICU TBI patients who are sedated and subjected to drowsiness (12). Visual fixation, which refers to the ability of maintaining an image of interest on the fovea, is an interesting alternative for this specific patient group as it involves cortical and subcortical structures but requires less complex coordination than saccades (16). Despite these advan-tages, the usefulness of visual fixation as a predictor of moder-ate-to-severe TBI recovery has never been explored.
This two-phase study examined whether return of visual fixation in the ICU (phase 1) could predict long-term recovery after TBI (phase 2). We hypothesized that the more rapid the recuperation of visual fixation in the ICU the less disabilities TBI patients would exhibit in the months after the injury. This study also aimed at testing whether the presence/absence of visual fixation within 24 hours of ICU admission could be as performant as PTA duration and the initial GCS score to pre-dict long-term recovery in TBI patients. A 24-hour period for the return of visual fixation was selected as it is generally suf-ficient for intoxicated patients to “sober up” and be more com-pliant to behavioral commands, yet not long enough for them to develop substance-withdrawal syndrome (17). Periodic cessation of sedation for neurologic examination is also regu-larly performed during that time frame. Finally, 24 hours was judged sufficient for ICU clinicians to detect any forced gaze deviation due to space-occupying lesions or stroke.
MATERIALS AND METHODS
TBI Participants
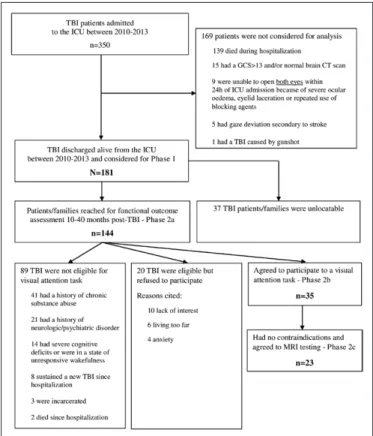
One hundred and eighty-one moderate-to-severe TBI patients (≥ 16 yr old) discharged alive from a level-I trauma ICU between 2010 and 2013 were included retrospectively in this cohort study (phase 1). Although most patients received a bolus of neuromus-cular blocking agent for intubation in the emergency department, those receiving repeated doses of blocking agents within the first 24 hours of ICU admission or with any other condition prevent-ing bilateral eyelid openprevent-ing or visual fixation were not considered for inclusion (details about eligibility screening are available in Fig. 1). Functional recovery was prospectively assessed through semistructured telephone interviews in 144 TBI patients or fami-lies 10–40 months after injury (phase 2a). Among patients found eligible for further testing during the interview, a subsample agreed to be submitted to a visual attention task (n = 35; phase 2b) and a MRI of the head (n = 23; phase 2c). This study was approved by the hospital research ethics committee. All participants in phase 2b and/or 2c were able to provide written inform consent. Sociodemographic and Clinical Variables
Participants' sociodemographic and clinical information including the cumulative doses of analgesics and sedatives received in the first 24 hours of ICU admission was gathered from the medical charts.
TBI Severity, PTA Assessment, and CT Scan Findings In all participants (n = 181), an alteration of consciousness extending 30 minutes and abnormal CT scan findings were
Figure 1. Flow diagram of screening and exclusion criteria for phase 1 and phase 2. GCS = Glasgow Coma Scale, TBI = traumatic brain injury.
documented (6). TBI severity was confirmed with the GCS score. The GCS is a 3- to 15-point scale used to assess patients' level of consciousness. Scoring is based on best motor response (6 points), best verbal response (5 points), and eye opening (4 points) (18). The initial GCS score (i.e., the lowest GCS score gathered in the first 24 hr after injury and before intubation) was used for TBI severity instead of the postresuscitation GCS score, as the latter was found to lack sensitivity for the discrimination of good versus poor TBI outcome when greater than 8 (19). Patients presenting an initial GCS score between 3 and 8 were considered patients with severe TBI, and those with a GCS score between 9 and 12 moderate TBI. ICU patients with an initial GCS of 13 and a positive CT scan were also considered moderate TBI, based on results from a recent large-scale study (20).
As per protocol in the study setting, PTA resorption was assessed daily by occupational therapists using the Galveston Orientation and Amnesia Test (GOAT) starting the day patients were able to communicate and exhibited a score of 6 on the GCS motor subscale (i.e., showing the patient has reached the minimum perceptivity level to be assessed for PTA). Duration of PTA was established when the ability to store new informa-tion was resumed, corresponding to a GOAT scores of 75 or above for two consecutive days (1, 21, 22).
The brain CT scan of each participant gathered during the first 24 hours of hospital admission was reviewed by a resident in neurosurgery (H.J.W.) who was blinded to patients' clini-cal information. Occurrence of any structural abnormalities including midline shift, hemorrhage, swelling, or periocular edema was documented. The Marshall and Rotterdam scores assessing for brain edema, midline shift, and also intraven-tricular, epidural, and/or arachnoid bleeding were computed (23, 24). For TBI patients who had an MRI, Firsching et al (25) grading of brainstem lesion was performed.
Phase 1—Return of Visual Fixation in the ICU
Information about presence/absence of visual fixation at 24 hours post-ICU admission was gathered in TBI patients' medical record (n = 181) as it was part of nurses' routine assessments in the study setting and was made every 4 hours in accordance with the standardized procedure of the Coma Recovery Scale–Revised (11). Briefly, nurses presented their face at the center of the patient's visual field (at 6–8 inch of distance) and gave him/her the instruction to look at them. Visual fixation was considered present in patients able to hold mutual eye contact with nurses for more than 2 seconds. In nonresponding patients, this procedure was repeated for up to two trials as nurses alternated between patients' cen-ter, right, and left visual fields to compensate for any loss of vision on one side. Although this procedure may also have triggered saccades in some patients, nurses only documented the capacity of the patients to hold mutual gaze, rather than any dynamic movement of the eyes. Assessment was per-formed sedation free whenever patients could tolerate it (i.e., not become agitated). It is also common practice for nurses in this setting to speak loud, call the patient by his/her name, and if needed, vigorously massage the shoulders/chest of
patients during assessment of fixation. For each patient, the amount of hours from ICU admission until visual fixation recovery was computed.
Consistency in assessment of visual fixation was tested after study completion as retrospective interrater reliability testing is recommended for medical records' review stud-ies assessing the usefulness of new outcome models (26). Although there is no standard recommendation for the proportion of raters or abstracted data that should be con-sidered for retrospective reliability, several studies report as few as 10% (26). In this study, interrater reliability was tested between 10 pairs of ICU nurses on six recovering TBI patients. Taken together, these nurses had contributed to the assessment of 40% of patients included in the study (i.e., 72/181). For each pair of nurses, one was asked to perform visual fixation assessment while the other stood near to wit-ness patient's reaction. Each nurse was asked to report the presence or absence of fixation individually. Cohen's κ coef-ficient for each pair of nurses was ranging between 0.66 and 0.96 and considered satisfactory (27).
Phase 2a—Long-Term Functional Recovery
Functional recovery was assessed with the Glasgow Outcome Scale–Extended (GOS-E) through semistructured telephone interviews 10–40 months after TBI. The GOS-E score ranges from 1 to 8 and classifies recovery based on patient's level of consciousness, independence, and work ability as death (score 1), unresponsive wakefulness syndrome (score 2), lower/ upper severe disability (scores 3 and 4), lower/upper moder-ate disability (scores 5 and 6), and lower/upper good recovery (scores 7 and 8) (28). Good functional recovery was defined as a GOS-E score greater than 5, showing return to preinjury functioning with no or little residual impairments.
Phase 2b—Visual Attention Performance
The unstructured symbol portion of the Mesulam and Wein-traub Cancellation Test (MWCT) was used to assess visual attention function in eligible TBI patients at 10–40 months after injury (29, 30). TBI patients were asked to circle target symbols as fast as they can while ignoring others. Perfor-mance was measured by the time (s) taken to perform the task.
Phase 2c—Regional Volume Deficits
Among patients who participated in the visual attention task, those without contraindications were submitted to a brain MRI using a Magnetom Trio TIM 3 Tesla MRI scanner (Siemens Healthcare, Erlangen, Germany) at the Institut universitaire de gériatrie de Montréal within the same month of GOS-E and visual attention assessments. Considering visual fixation recovery could be related to cerebral volume loss in areas involved in this ocu-lar activity, regional volumes of the FEF, PEF, SEF, midbrain, and the pons were extracted using voxel-based morphometry on seg-mented T1 images (for further details about image preprocessing, see Supplemental Digital Content I, http://links.lww.com/CCM/ B947) (31, 32).
Statistical Analysis
Receiver operating characteristic curve analysis was performed to test whether return of visual fixation in the ICU (hr), PTA duration (d), and the initial GCS score could predict a GOS-E score greater than 5. Positive likelihood ratio (PLR: sensitiv-ity/100 – specificity) and negative likelihood ratio (NLR: 100 – sensitivity/specificity) were also computed. Then, correcting for age, cumulative doses of analgesics and sedatives received within 24 hours of ICU admission, and also CT scan findings (Marshall and Rotterdam scores), multiple regression was used to examine whether return of visual fixation (hr), PTA duration (d), and the initial GCS score could predict participants’ GOS-E score. Because of the small number of participants who took part in phase 2b, a reduced regression model without potential
confounders (i.e., age/medication/CT scan findings) was used to test whether return of visual fixation in the ICU (hr), PTA duration, and the initial GCS score could predict participants' performance on MWCT. Finally, percentages of regional volume deficits in TBI participants (n = 23) compared with matched controls (n = 23) (for details about control selection and pair-ing, see Supplemental Digital Content II, http://links.lww. com/CCM/B948) were calculated using the formula {[(Control – TBI)/TBI] × 100} (33). This computation was performed in our five regions of interest (FEF, PEF, SEF, midbrain, and pons), for gray matter (GM) volumes, with a Bonferroni corrected
p value of 0.01. Statistics were computed using SPSS 22.0 (SPSS,
Chicago, IL) and MedCalc 15.4 (MedCalc Software bvba, Ostend, Belgium).
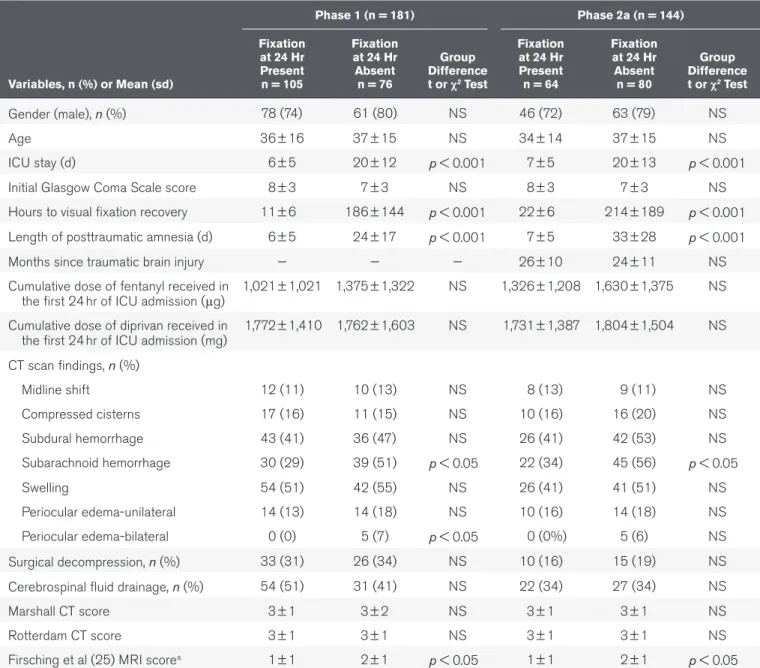
TABLE 1.
Participants’ Characteristics at Phase 1 and Phase 2a
Variables, n (%) or Mean (sd) Phase 1 (n = 181) Phase 2a (n = 144) Fixation at 24 Hr Present n = 105 Fixation at 24 Hr Absent n = 76 Group Difference t or χ2 Test Fixation at 24 Hr Present n = 64 Fixation at 24 Hr Absent n = 80 Group Difference t or χ2 Test Gender (male), n (%) 78 (74) 61 (80) NS 46 (72) 63 (79) NS Age 36 ± 16 37 ± 15 NS 34 ± 14 37 ± 15 NS ICU stay (d) 6 ± 5 20 ± 12 p < 0.001 7 ± 5 20 ± 13 p < 0.001
Initial Glasgow Coma Scale score 8 ± 3 7 ± 3 NS 8 ± 3 7 ± 3 NS
Hours to visual fixation recovery 11 ± 6 186 ± 144 p < 0.001 22 ± 6 214 ± 189 p < 0.001 Length of posttraumatic amnesia (d) 6 ± 5 24 ± 17 p < 0.001 7 ± 5 33 ± 28 p < 0.001
Months since traumatic brain injury — — — 26 ± 10 24 ± 11 NS
Cumulative dose of fentanyl received in
the first 24 hr of ICU admission (μg) 1,021 ± 1,021 1,375 ± 1,322 NS 1,326 ± 1,208 1,630 ± 1,375 NS Cumulative dose of diprivan received in
the first 24 hr of ICU admission (mg) 1,772 ± 1,410 1,762 ± 1,603 NS 1,731 ± 1,387 1,804 ± 1,504 NS CT scan findings, n (%) Midline shift 12 (11) 10 (13) NS 8 (13) 9 (11) NS Compressed cisterns 17 (16) 11 (15) NS 10 (16) 16 (20) NS Subdural hemorrhage 43 (41) 36 (47) NS 26 (41) 42 (53) NS Subarachnoid hemorrhage 30 (29) 39 (51) p < 0.05 22 (34) 45 (56) p < 0.05 Swelling 54 (51) 42 (55) NS 26 (41) 41 (51) NS Periocular edema-unilateral 14 (13) 14 (18) NS 10 (16) 14 (18) NS Periocular edema-bilateral 0 (0) 5 (7) p < 0.05 0 (0%) 5 (6) NS Surgical decompression, n (%) 33 (31) 26 (34) NS 10 (16) 15 (19) NS Cerebrospinal fluid drainage, n (%) 54 (51) 31 (41) NS 22 (34) 27 (34) NS
Marshall CT score 3 ± 1 3 ± 2 NS 3 ± 1 3 ± 1 NS
Rotterdam CT score 3 ± 1 3 ± 1 NS 3 ± 1 3 ± 1 NS
Firsching et al (25) MRI scorea 1 ± 1 2 ± 1 p < 0.05 1 ± 1 2 ± 1 p < 0.05 NS = non significant.
RESULTS
Sample
Our sample at phases 1 and 2a is consisted mostly of young to middle-aged males (Table 1). The ability to fixate was absent in all patients at time of ICU admission and recovered on aver-age 96 hours (ranging from 5 to 330 hr) later. Etiology of TBI included passenger in a motor vehicle collision (58%; n = 105), fall (25%; n = 45), hit or run over by a motor vehicle (11%;
n = 20), and assault (6%; n = 11). No differences in
sociode-mographic, initial GCS score, and cumulative doses of fentanyl (Baxter Healthcare, Deerfield, IL) or diprivan (Hospira, Lake Forest, IL) received in the first 24 hours of ICU admission were found between patients who could fixate and those who could not. Compared with patients who could fixate however, those who could not had higher incidence of subarachnoid hemor-rhage on CT scans and more extensive brainstem injuries as per
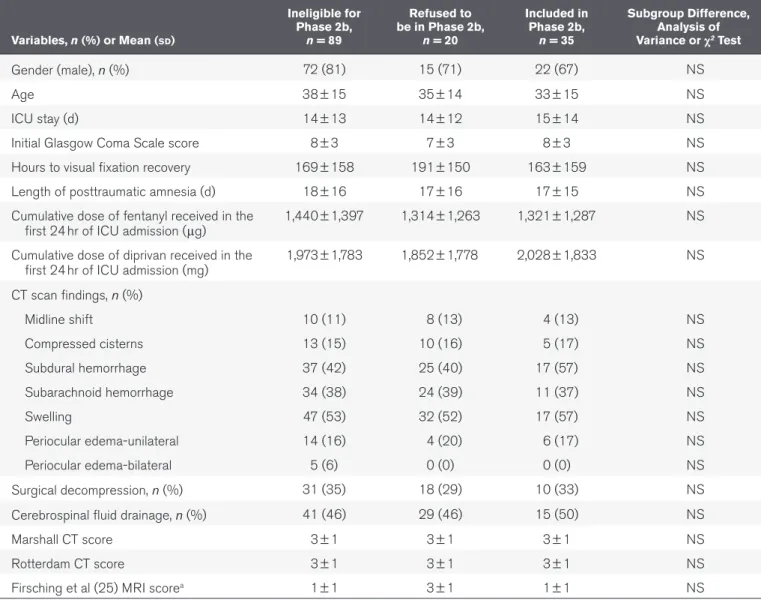
Firsching et al (25) grades. Five patients who could not fixate at 24 hours had bilateral periocular edema but were still kept in the study as they never lost the ability to open their eyes and had no gaze deviation/stroke according to their files. At phase 2b, our sample dropped to 35 as 89 patients were considered ineligible for further testing and 20 refused to participate, but no differences were found between these subgroups (Table 2). Prediction of Long-Term Recovery
(Phases 2a, 2b, and 2c)
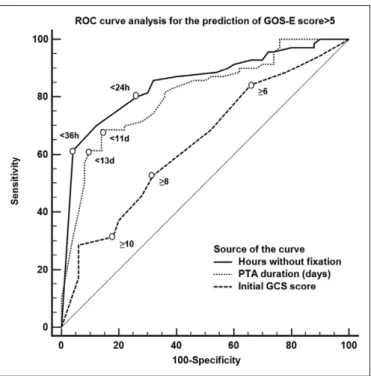
With an area under the curve (AUC) of 0.85 and 0.81, respec-tively, return of visual fixation at 24 hours of ICU admission (sensitivity, 80%; specificity, 73%; PLR, 3.0 [95% CI, 2.2–3.5]; NLR, 0.3 [95% CI, 0.1–0.6]) and PTA duration at 11 days (sen-sitivity, 68%; specificity, 85%; PLR, 4.5 [95% CI, 4.0–5.3]; NLR, 0.4 [95% CI, 0.3–1.1]) were found as performant for the predic-tion of a GOS-E score greater than 5 (difference between AUC, TABLE 2.
Traumatic Brain Injury Patients' Characteristics Based on Their Inclusion/
Exclusion Status in Phase 2b
Variables, n (%) or Mean (sd) Ineligible for Phase 2b, n = 89 Refused to be in Phase 2b, n = 20 Included in Phase 2b, n = 35 Subgroup Difference, Analysis of Variance or χ2 Test Gender (male), n (%) 72 (81) 15 (71) 22 (67) NS Age 38 ± 15 35 ± 14 33 ± 15 NS ICU stay (d) 14 ± 13 14 ± 12 15 ± 14 NS
Initial Glasgow Coma Scale score 8 ± 3 7 ± 3 8 ± 3 NS
Hours to visual fixation recovery 169 ± 158 191 ± 150 163 ± 159 NS
Length of posttraumatic amnesia (d) 18 ± 16 17 ± 16 17 ± 15 NS
Cumulative dose of fentanyl received in the
first 24 hr of ICU admission (μg) 1,440 ± 1,397 1,314 ± 1,263 1,321 ± 1,287 NS Cumulative dose of diprivan received in the
first 24 hr of ICU admission (mg) 1,973 ± 1,783 1,852 ± 1,778 2,028 ± 1,833 NS CT scan findings, n (%) Midline shift 10 (11) 8 (13) 4 (13) NS Compressed cisterns 13 (15) 10 (16) 5 (17) NS Subdural hemorrhage 37 (42) 25 (40) 17 (57) NS Subarachnoid hemorrhage 34 (38) 24 (39) 11 (37) NS Swelling 47 (53) 32 (52) 17 (57) NS Periocular edema-unilateral 14 (16) 4 (20) 6 (17) NS Periocular edema-bilateral 5 (6) 0 (0) 0 (0) NS Surgical decompression, n (%) 31 (35) 18 (29) 10 (33) NS
Cerebrospinal fluid drainage, n (%) 41 (46) 29 (46) 15 (50) NS
Marshall CT score 3 ± 1 3 ± 1 3 ± 1 NS
Rotterdam CT score 3 ± 1 3 ± 1 3 ± 1 NS
Firsching et al (25) MRI scorea 1 ± 1 3 ± 1 1 ± 1 NS
NS = non significant.
0.04; 95% CI, –0.03 to 0.12; p = 0.28) (Fig. 2). The initial GCS score conversely was a poor predictor of patients' functional outcome (AUC, 0.63). Even when correcting for age, medica-tion (fentanyl/diprivan), and CT scan findings (Marshall/Rot-terdam scores), return of visual fixation in the ICU (β, –0.29; p = 0.04) and PTA duration (β, –0.35; p = 0.01) remained
sig-nificant predictors of GOS-E scores. On a smaller scale, patients who could not fixate at 24 hours of ICU admission took sig-nificant longer time to complete the MWCT task in the months
after TBI, compared with those who could (104.13 ± 39.69 vs 72.42 ± 13.71 s; t, 2.89; p = 0.04). Again, in contrast to the GCS, return of fixation in the ICU (β, 0.26; p = 0.04) and PTA
dura-tion (β, 2.39; p = 0.01) were found to be significant predictors
of MWCT scores after TBI. Finally, when percentages of the dif-ference in regional GM volumes between each pair of TBI and matched control were considered (i.e., 23 pairs), patients who could not fixate at 24 hours of ICU admission (n = 13) had significant more pronounced GM volume deficits in the SEF, the midbrain, and the pons, compared with those who could (n = 10) (Fig. 3).
Prediction of Death Versus Survival
Although visual fixation seems a good predictor of TBI long-term recovery, it could also be useful for predicting intrahos-pital death/survival. To test this hypothesis, we proceeded to a post hoc review of the medical records of all TBI patients deceased in the ICU (n = 52) over a 12-month period (Janu-ary 2013 to December 2013). Of all patients who died dur-ing hospitalization, only one was able to fixate at 24 hours of ICU- admission. The others never recovered fixation ability. Causes of death included brain death (n = 20), brain hemor-rhage (n = 20), renal failure (n = 6), sepsis (n = 4), and cardiac arrest (n = 2). TBI patients recovering fixation ability during the first 24 hours of ICU admission could therefore have as little as a 2% chance of succumbing to their injuries during hospitalization.
DISCUSSION
This study is the first to show that presence/absence of visual fixation at 24 hours of ICU admission could be as perfor-mant as PTA for the prediction of TBI patients' long-term functional recovery. Fixation could also be useful to predict specific attention deficits and volume losses in specific brain regions after TBI. Altogether, our findings suggest that visual fixation is an important marker of neurologic recovery, and while further testing is needed, could be considered along-side other admission variables for inclusion in TBI prognosis models.
As opposed to the initial GCS score, return of visual fixation in the ICU and PTA duration were both found to be moderate-to-strong predictors of good functional recovery in our sample of TBI patients. Accordingly, patients who were able to fixate at 24 hours of ICU admission were found 3.0 times more likely to return (at least part-time) to their preinjury occupation in the months following TBI, compared with those who could not. At a descriptive level, 86% of patients who were able to fixate at 24 hours had a good functional recovery (based on a GOS-E score > 5), as opposed to 10% of patients who were not. In contrast, the GCS score's ability to predict TBI patients' PTA duration, as well as long-term functional recovery, was hardly better than chance with an AUC equal to 0.63. Even when we reconducted our analysis with the GCS motor subscore (as it could be more robust that the total score for outcome predic-tion), it was not performant enough (AUC, 0.68) to predict TBI patients' functional outcome (34).
Figure 2. Receiver operating characteristic (ROC) curves for the prediction of good functional recovery by visual fixation, posttraumatic Amnesia (PTA), and the initial Glasgow Coma Scale (GCS) score. Numbers adjacent to the curve indicate cut-off values for the area under the curve. GOS-E = Glasgow Outcome Scale-Extended.
Figure 3. Percentages of regional volume deficit between pairs of traumatic brain injury (TBI) and matched control according to the return of visual fixation in the ICU. The error bars represent 1 se mean. *Represents
significant group difference at a Bonferroni corrected p value of 0.01. FEF = frontal eye field, GM = gray matter, PEF = parietal eye field, SEF = supplementary eye field.
This study is not the first to highlight the limitations of the GCS score for the prediction of outcome in critically ill TBI patients (35, 36). Probably contributing to this phenomenon is the fact that although the GCS provides meaningful infor-mation about brainstem reflexes, it provides little about higher cognitive functioning in mechanically ventilated patients in whom the verbal subscale cannot be assessed (37). Visual fixa-tion on the other hand can be initiated reflexively (from the PEF via the superior colliculus of the midbrain) or intention-ally (from the FEF via the paramedian pontine reticular forma-tion) (31). Also important for the maintenance and duration of fixation is the activity of the omnipause neurons arising from the rostral pole of the midbrain, and to a lesser extend the FEF, the SEF, and the pons, reflecting the wide distribution of neural circuits within the brain that can influence fixation (32). In terms of functionality, we know that the fronto-pari-etal network involved in sustained attention is also involved in intentional visual fixation (38, 39). Based on this assumption, return of visual fixation after brain injury could be indicative of higher cognitive functioning and recovering consciousness (40). Supporting this hypothesis is the fact that patients who could not fixate at 24 hours of ICU admission had poorer per-formance in the months following TBI on the visual attention task, compared with those who could. However, there is also a possibility that visual fixation may simply be reflexive at this stage of TBI recovery as visual fixation was found useless for discriminating patients in unresponsive wakefulness syndrome from those in minimally conscious state (41, 42).
Although it may not always be a marker of consciousness, recovery of visual fixation in the ICU is at least indicative of preserved brainstem function. Indeed, among patients who were submitted to MRI testing, those who could not fixate at 24 hours of ICU admission had significant more pronounced GM deficits than those who could in the midbrain and the pons. Patients who could not fixate at 24 hours of ICU admis-sion also had more extensive brainstem leadmis-sions as per higher Firsching et al (25) scores. Unfortunately, MRI scans were available in only 11% of our sample limiting the extrapolation we can make on the subject. Aside from the brain injury itself, visual fixation recovery after TBI could be affected by several cooccurring factors (28). It is important to point out that although we controlled for the potential effects of analgesics and sedatives on our results, 82% of visual fixation assessments were performed during a periodic cessation of sedation. Also, 74% of our TBI participants were under preventive doses of anticonvulsant at the time of assessment, limiting the potential interference of seizure in our results. Furthermore, none of the patient showed clinical signs suggestive of simple or complex partial seizures.
This study is not without limitations. First, establishment of visual fixation in the ICU was made retrospectively based on nurses' documentation in medical files. Although this method is recommended in medical records' review stud-ies, inconsistencies in the assessment of fixation could still have interfered with the results. A second potential limita-tion relates to the type of stimulus employed to assess visual
fixation. The use of a mirror in particular could have resulted in higher positive response rate compared with faces (41, 42). Finally, circuitry of visual fixation is complex, and further studies with functional neuroimaging are critical for under-pinning the corticocortical and corticosubcortical connec-tions relevant to its utility as a surrogate marker of recovery in TBI. Till then, we cannot stress enough on the importance not to use visual fixation in isolation for the prediction of TBI outcome.
CONCLUSIONS
Working with reliable predictors of recovery in moderate-to-severe TBI is essential for ICU clinicians. In this study, recovery of visual fixation within 24 hours of ICU admission was found to be a strong predictor of PTA and TBI patients' long-term recovery. With further testing, visual fixation could eventually be considered alongside other admission variables for inclusion in TBI outcome algorithms, as well as for the stratification of severe and less-severe TBI in the reviewing process of randomized control trials (43).
ACKNOWLEDGMENTS
We thank Catherine Chapados-Noreau, Marjolaine Lafor-ture, and Pierre-Olivier Gaudreault for their participation in data collection. We also thank the technical staff at the Func-tional Neuroimaging Unit and Hélène Blais at the Center for Advanced Research in Sleep Medicine for their continuous support. A special thanks to Marie-Aurélie Bruno, PhD, and Jean Paquet, PhD (statistician), for their insightful comments on the article. Last but not least, we thank Virginie William (clinical research coordinator) and the bedside nurses of the ICU for supporting data collection.
REFERENCES
1. Zafonte RD, Mann NR, Millis SR, et al: Posttraumatic amnesia: Its relation to functional outcome. Arch Phys Med Rehabil 1997; 78:1103–1106
2. Stocchetti N, Pagan F, Calappi E, et al: Inaccurate early assess-ment of neurological severity in head injury. J Neurotrauma 2004; 21:1131–1140
3. Levin HS, O’Donnell VM, Grossman RG: The Galveston Orientation and Amnesia Test. A practical scale to assess cognition after head injury. J Nerv Ment Dis 1979; 167:675–684
4. Steyerberg EW, Mushkudiani N, Perel P, et al: Predicting outcome after traumatic brain injury: Development and international validation of prognostic scores based on admission characteristics. PLoS Med 2008; 5:1251–1265
5. Jacobs B, Beems T, van der Vliet TM, et al: Outcome prediction in moderate and severe traumatic brain injury: A focus on computed tomography variables. Neurocrit Care 2013; 19:79–89
6. Perel P, Arango M, Clayton T, et al; MRC CRASH Trial Collaborators: Predicting outcome after traumatic brain injury: Practical prognostic models based on large cohort of international patients. BMJ 2008; 336: 425–435
7. Steyerberg EW, Mushkudiani N, Perel P, et al: Predicting outcome after traumatic brain injury: Development and international validation of prognostic scores based on admission characteristics. PLoS Med 2008; 5:e165
8. Hukkelhoven CW, Steyerberg EW, Farace E, et al: Regional differ-ences in patient characteristics, case management, and outcomes in
traumatic brain injury: Experience from the tirilazad trials. J Neurosurg 2002; 97:549–557
9. Brown AW, Malec JF, McClelland RL, et al: Clinical elements that predict outcome after traumatic brain injury: A prospective multicenter recursive partitioning (decision-tree) analysis. J Neurotrauma 2005; 22:1040–1051
10. Menon D, Harrison D: Prognostic modelling in traumatic brain injury.
BMJ 2008; 336:397–398
11. Giacino JT, Kalmar K, Whyte J: The JFK Coma Recovery Scale-Revised: Measurement characteristics and diagnostic utility. Arch
Phys Med Rehabil 2004; 85:2020–2029
12. Dolce G, Lucca LF, Candelieri A, et al: Visual pursuit in the severe disorder of consciousness. J Neurotrauma 2011; 28:1149– 1154 13. Ventura RE, Balcer LJ, Galetta SL: The neuro-ophthalmology of head trauma. Lancet Neurol 2014; 13:1006–1016 14. Heitger MH, Anderson TJ, Jones RD, et al: Eye movement and visuo-motor arm movement deficits following mild closed head injury. Brain 2004; 127:575–590 15. Heitger MH, Jones RD, Macleod AD, et al: Impaired eye movements in post-concussion syndrome indicate suboptimal brain function beyond the influence of depression, malingering or intellectual ability.
Brain 2009; 132:2850–2870
16. Ramat S, Leigh RJ, Zee DS, et al: What clinical disorders tell us about the neural control of saccadic eye movements. Brain 2007; 130:10–35 17. American Psychiatric Association: Diagnostic and Statistical Manual of Mental Disorders. Fifth Edition. Washington, DC, 2013 18. Teasdale G, Jennett B: Assessment of coma and impaired conscious-ness. A practical scale. Lancet 1974; 2:81–84 19. Heather NL, Derraik JG, Beca J, et al: Glasgow Coma Scale and out-comes after structural traumatic head injury in early childhood. PLoS One 2013; 8:e82245
20. Mena JH, Sanchez AI, Rubiano AM, et al: Effect of the modified Glasgow Coma Scale score criteria for mild traumatic brain injury on mortality prediction: Comparing classic and modified Glasgow Coma Scale score model scores of 13. J Trauma 2011; 71:1185–1192; discussion 1193
21. Ellenberg JH, Levin HS, Saydjari C: Posttraumatic Amnesia as a predictor of outcome after severe closed head injury. Prospective assessment. Arch Neurol 1996; 53:782–791
22. Stuss DT, Binns MA, Carruth FG, et al: The acute period of recovery from traumatic brain injury: Posttraumatic amnesia or posttraumatic confusional state? J Neurosurg 1999; 90:635–643
23. Marshall LF, Eisenberg H, Jane JA, et al: A new classification of head injury based on computed tomography. J Neurosurg 1991; 75:S14–S20
24. Maas AI, Hukkelhoven CW, Marshall LF, et al: Prediction of outcome in traumatic brain injury with computed tomographic characteris-tics: A comparison between the computed tomographic classifi-cation and combinations of computed tomographic predictors.
Neurosurgery 2005; 57:1173–1182; discussion 1173
25. Firsching R, Woischneck D, Klein S, et al: Classification of severe head injury based on magnetic resonance imaging. Acta Neurochir
(Wien) 2001; 143:263–271
26. Yawn BP, Wollan P: Interrater reliability: Completing the methods description in medical records review studies. Am J Epidemiol 2005; 161:974–977
27. Streiner DL, Norman GR: Health Measurement Scales: A Practical Guide to Their Development and Use. Fourth Edition. Oxford, Oxford University Press, 2008
28. Wilson JT, Pettigrew LE, Teasdale GM: Structured interviews for the Glasgow Outcome Scale and the extended Glasgow Outcome Scale: Guidelines for their use. J Neurotrauma 1998; 15:573–585 29. Takahashi M, Iwamoto K, Fukatsu H, et al: White matter microstruc-ture of the cingulum and cerebellar peduncle is related to sustained attention and working memory: A diffusion tensor imaging study. Neu-rosci Lett 2010; 477:72–76 30. Nowrangi MA, Lyketsos C, Rao V, et al: Systematic review of neuroim-aging correlates of executive functioning: Converging evidence from different clinical populations. J Neuropsychiatry Clin Neurosci 2014; 26:114–125 31. Horn AK, Büttner-Ennever JA, Wahle P, et al: Neurotransmitter profile of saccadic omnipause neurons in nucleus raphe interpositus. J Neu-rosci 1994; 14:2032–2046 32. Leigh JR, Zee DS: The Neurology of Eye Movements. Fifth Edition. Oxford, Oxford University Press, 2015 33. Wilde EA, Bigler ED, Hunter JV, et al: Hippocampus, amygdala, and basal ganglia morphometrics in children after moderate-to-severe traumatic brain injury. Dev Med Child Neurol 2007; 49:294–299 34. Murray GD, Butcher I, McHugh GS, et al: Multivariable prognostic
analysis in traumatic brain injury: Results from the IMPACT study.
J Neurotrauma 2007; 24:329–337 35. Kehoe A, Rennie S, Smith JE: Glasgow Coma Scale is unreliable for the prediction of severe head injury in elderly trauma patients. Emerg Med J 2015; 32:613–615 36. Forslund MV, Roe C, Sigurdardottir S, et al: Predicting health-related quality of life 2 years after moderate-to-severe traumatic brain injury.
Acta Neurol Scand 2013; 128:220–227
37. Bruno MA, Ledoux D, Lambermont B, et al: Comparison of the Full Outline of UnResponsiveness and Glasgow Liege Scale/Glasgow Coma Scale in an intensive care unit population. Neurocrit Care 2011; 15:447–453
38. Sharp DJ, Scott G, Leech R: Network dysfunction after traumatic brain injury. Nat Rev Neurol 2014; 10:156–166
39. Granziera C, Schmahmann JD, Hadjikhani N, et al: Diffusion spectrum imaging shows the structural basis of functional cerebellar circuits in the human cerebellum in vivo. PLoS One 2009; 4:e5101 40. Rogers TD, McKimm E, Dickson PE, et al: Is autism a disease of the cerebellum? An integration of clinical and pre-clinical research. Front Syst Neurosci 2013; 7:15 41. Bruno MA, Vanhaudenhuyse A, Schnakers C, et al: Visual fixation in the vegetative state: An observational case series PET study. BMC Neurol 2010; 10:35 42. Di H, Nie Y, Hu X, et al: Assessment of visual fixation in vegetative and minimally conscious states. BMC Neurol 2014; 14:147 43. Lingsma HF, Roozenbeek B, Li B, et al: Large between-center differ-ences in outcome after moderate and severe traumatic brain injury in the international mission on prognosis and clinical trial design in trau-matic brain injury (IMPACT) study. Neurosurgery 2011; 68:601–607