ADVANCES IN VIRTUAL PROCESS CHAIN AND
CONNECTION
WITH
ON-LINE
MONITORING
METHODS
FOR
FIRST
TIME
RIGHT
MANUFACTURING OF THERMOSET LAMINATED
COMPOSITES
Dr. C. Brauner, Dr. A. Miene, Dr. R. Gaitzsch, Prof. Dr. A.S. Hermann (FASER Institute - FIBRE, Bremen University);
Dr. F. Pascon, Prof. Dr. M. Bruyneel (SAMTECH, A Siemens Company. 1. Introduction
In the current development of manufacturing processes for composite structures a high effort is made to find optimal cost efficient process parameters which achieve the required qualities. One common method is to use trial and error method. Especially if process parameters tolerances like fibre angle and patch position are large this could lead to a scattering process quality which is in general conflict to cost efficiency. Usually trial and error method starts with a parameter set which is based on experience and material provider specifications. Different variations are then performed unless time or funding is running out and best sets of parameters are chosen to achieve a robust process in the so called process window. Conservative parameter values are chosen to avoid that those variations of material and process parameters do not increase waste rate.
To enable a more cost efficient development strategy knowledge based approaches have been established for single process elements like draping, infusion/injection, curing, heat flow and warpage /residual stress analysis. Based on the fact that the composite process chain captures different multi physical disciplines analysis methods are most of the time highly sophisticated stand alone solutions. In the last years different research effort was spend to Built up a virtual process chain by integration or on one hand interpolation of data between different programs using mapping methods [1,2,3]. This trend to Built up the virtual process chain enables to analyse the effect of draping on the infusion time or on process induced deformation. A consistent simulation chain can support the development of the process by evaluation of the sensitivity of different process parameters and their impact on the quality [4].
Due to the nature of a composite process many variations are possible and there will be always two types of configurations. There will be always a so called “As-Planned” configuration and an “As-Built” configuration [5]. On the “As-Planned” condition all engineering analysis are performed for preliminary design and sometimes up to certification. The “As-Built” configuration is used for experimental test and sometimes if problems occur also analyse d in detail with process simulation methods.
For concurrent design feedback methods are necessary which can transfer data from the virtual process chain to the real process like layup definitions, parameter definitions etc. but also to transfer data from the real world into the virtual process chain and to study the effect of deviation from the “As-Planned” configuration in an early stage of the development phase.
One example for such an important feedback are deviations and variations during the draping or preforming of the textile plies. These deviations could be on the layup level like overlaps of similar plies, wrong patch position, wrong orientations of a ply and foreign objects. On the ply level these deviation could be fibre misalignments, gaps and undulations. The effects of these deviations are more or less critical because they change the infusion behaviour or create asymmetrical condition which will be visible as process induced deformations.
These effects are difficult to analyse because most of the time they appear late in the development phase and then updating of current virtual model is difficult. If they are neglected the virtual process chain will not give reliable results.
In the present study online process monitoring (OPM) methods like curing measurements and image analysis methods are presented which facilitate to measure deviations like patch position, thickness and orientation. A new developed mapping method between the image analysis and FE-model is presented which enables to perform simulation of the “As-Built” configurations with the real fibre orientations, ply position and thickness/fibre volume content. Using this approach combined with a cure dependent viscoelastic material model analysis is performed to analyse the effect on process induced deformations. The application test case is a ship propeller which highlights the advantages because it is a doubly curved part and this part is produced most of the time in single part production and therefore first time right aspects are highly important.
2. On-line process monitoring
In the following section two Online Process Monitoring (OPM) methods are applied to the ship propeller use case. First image analysis is used to measure patch position, thickness and orientation and second a cure monitoring system from Synthesis is used to measure resin arrival and curing.
Preforming monitoring
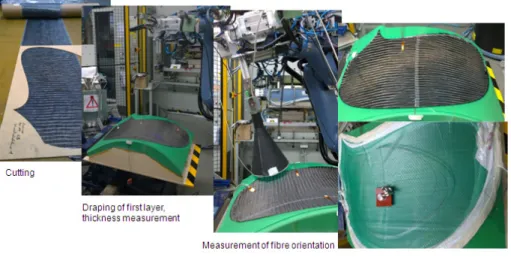
The Faserinstitut Bremen (FIBRE) has developed systems for the inspection of composite fibre material. FIBRE participated within several research projects – national as well as EU funded – and has developed image analysis algorithms to examine the surface of preforms to detect faults like gaps or foreign objects, patch position and to measure fibre orientation [6,7]. The priority of defects was defined to measure patch position and thickness and secondly fibre orientation. In the following figure the measuring strategy is shown.
Figure 1: Preforming step and image analysis using a laser line sensor for thickness and FIBRE light dome for fibre orientation
After cutting the plies to right shape the ply was placed on the mould and the binder was activated by a heater. Using a compaction roll preforming was done to ensure connection with the tool or the corresponding ply. After this step a measurement of the ply position/thickness was performed using a Keyence LJ-V7200 laser displacement sensor which was mounted to a KUKA robot system. The laser sensor was moved over the mould using the robot. The acquired height profiles were combined to a matrix of z values of the entire surface. This was done before and after draping of a ply. Using a
subtraction of measurement results the position and thickness of the ply were extracted. In Addition the fibre orientation was done on 4 defined positions using a CCD camera together with the FIBRE light dome. Using a statistical approach based on texture orientation histograms [14] the fibre orientation was measured within the images.
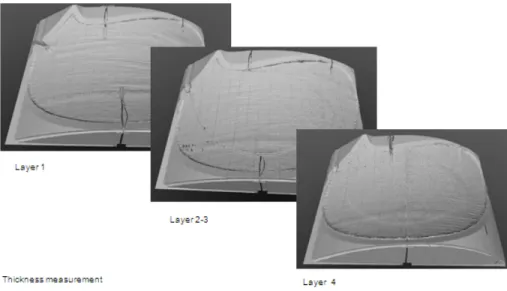
In the following figure the measurement of the ply position is shown. In the given case a generic layup was used which consists of four plies [0,0,0,90]. The middle plies do not cover the full area of the blade. At this stage some common deviation between Planned” and “As-Built” configuration have been introduced. These deviations are overlaps on the first and fourth ply because the width of the fabric raw material was limited. The second deviation is a mismatch of ply 2 and 3 by a small rotation.
Figure 2: Results of the laser displacement sensor
Using a subtraction of the measured values before and after draping of a ply the thickness of a preformed ply can be calculated. An average thickness value is calculated for single elements. In this case the finite element mesh which is later used for the analysis is used and the thickness values are evaluated for the single elements as shown in figure 3.
Figure 3: Post process results of the laser displacement sensor using subtraction of the single measurements and projection onto a FE Mesh
Especially a 100% inspection for large parts is a time consuming task. Therefore an important objective is to improve the performance of the image analysis algorithms to inspect large surfaces within a reasonable time. Another restriction is the component geometry since current systems are limited to surfaces with low gradient changes due to the geometry of the illumination source and the required short distances between illumination and surface. To improve the ability to inspect curved surfaces a special illumination source, the FIBRE Light Dome, was developed on pretests of illumination experiments carried out at the FIBRE image analysis laboratory. In the following figure 4 on the left side the blade is shown with the four measurement positions, on the right side the results of the image analysis is shown for point 1 and 4. On a grid the average fibre orientation is shown by a coloured bar. To extrapolate the results from these discrete points to the structure an algorithm is under development.
Figure 4: Measurement of the fibre orientation at four discrete points (left), results of the image analysis for point 1 and 4 (right)
Cure monitoring
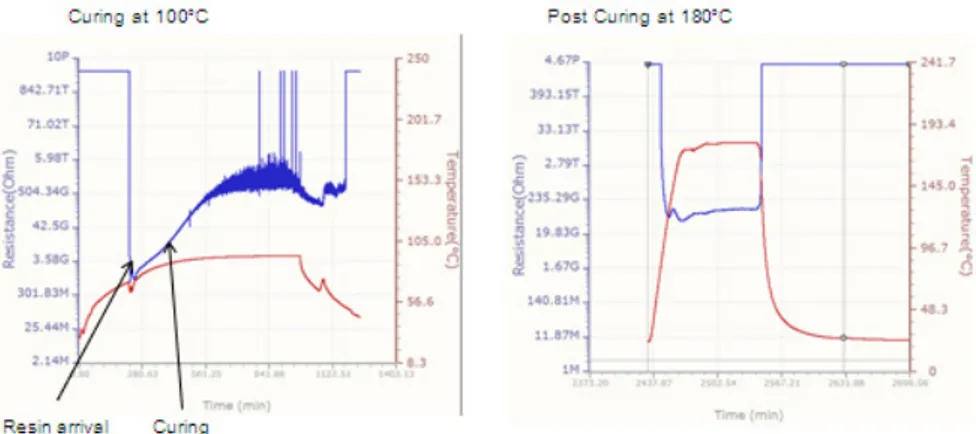
For the monitoring of composites manufacturing the correlation of the electrical properties of the resin with process milestones is widely accepted as the most mature tool. However the most popular are dielectric systems or systems based on electrical resistivity. The change of the resin properties during curing are taken as an indicator for resin arrival and development of curing. In this study a system called Optimold from Synthesites is used. The system has many advantages over the dielectric systems as it is faster, cheaper and more accurate at industrial conditions and can be combined with a wide range of sensors for measuring curing, viscosity, resin aging or mixing quality. A flexible sensor was embedded between layer 1 and 2. This sensor measures the temperature and the electrical resistivity and the measured values are shown in the following figure 5. The Optimold system was used in the curing step at 95°C and also in the post curing step at 180°C.
Figure 5: Results of the cure monitoring system for the curing phase and the post curing
3. Simulation method
In the following section the simulation approach is presented which will be used in the application test case section. A sequential coupled thermochemical – mechanical analysis was performed using SAMCEF. In the thermal model mould and composite part was modelled with 212116 volume elements. Using a transient implicit analysis the temperature was calculated and then mapped on mechanical models which consist of 3738 multilayer shell elements. This approach enables to implement layup changes and deviation resulting from the feedback measurement system easily without changing the geometrical topology by assuming that the effect on the thermal part of the analysis is small.
Figure 6: Simulation strategy and thermal and mechanical FE model
For both analysis steps cure depended material models are used. In the thermal part a cure kinetic model is used which was derived from Differential Scanning Calorimetry (DSC) experiments in isothermal and dynamic conditions. With this method, the exothermic heat flow is measured and interpreted while assuming that this heat flow is proportional to the degree of cure. The reaction kinetics is often used to describe a reaction of n-th order; p represents the conversion factor/degree of cure (varying from 0 to 1) and describes its development. The temperature dependence is described using the Arrhenius rate constant ki:
(1) The Arrhenius term is based on the material and process parameters with the thermal activation energy of the reaction Si, the universal gas constant R, and the temperature T. The kinetic reaction models available in the literature for different resin systems are diverse. In general, the model must accommodate different curing situations, particularly the variation in isothermal and dynamic temperature conditions. The figure 7 shows the fit between analytical model and DSC experimental results. n m p p p k dt dp ) ( max 1 − = (2)
While curing epoxy resin, three different morphologic states will be passed. The resin will be converting from liquid to rubbery and to solid states. These changes are not defined as points, but from the engineering perspective, they will be defined as points and connected to the glass transition temperature. The changes in the glass transition
temperature depend on the degree of cure. These changes can be accounted for using equations available in the literature:
p p T T T T Tg Tg g g g g ) 1 ( 1 0 1 0
λ
λ
− − = − − (3)Figure 1: DSC results and analytical fit
Using these two important parameters curing and glass transition the definition of the state of the material can be defined. As shown in figure 8 the resin converts from liquid (I) after reaching the gel point to a viscous (II) and then to a solid phase (III). The degree of cure and the glass transition can be used as state variables to identify the material behaviour from the process history.
Figure 2: Schematic curing process
Therefore different theories are used to describe the dependency on the degree of cure. In the thermal part the approach of Balvers [8] is used, the thermal conductivity is modelled using an approach of Johnston [9].
The mechanical part of the analysis is modelled using a viscoelastic approach. Based on the fact that residual stress based on chemical and thermal induced strain are effected at high temperature close to the glass transition temperature (Tg) by relaxation this effect has to be taken into account to represent the right process induced deformations and stresses. The material model has to be able to take into account orthotropic relaxation behaviour and therefore a calculation scheme was developed which calculates the degree of cure / Tg at a given time step, derives the resin modulus, calculates the homogenized ply properties, assembles the new stiffness matrix, calculates from the increment of degree of cure the chemical shrinkage, assembles the total strain from mechanical, thermal and chemical induced strain together, calculates the elastic stress and subtracts the effect of relaxation based on degree of cure, time and temperature on the stress. The advantage of this model is that input parameters are the separate composite properties and the fibre volume content. During the transient analysis homogenised ply properties are calculated based on the theory of Hashin/Hill and therefore the result of the simulation is not only the process induced deformation / stress but also the engineering values like Young’s modulus in different directions, coefficient of thermal expansion, degree of cure, glass transition temperature etc. In combination with the feedback method based on the image analysis results changes of thickness which affect the fibre volume content and therefore all material parameters can be taken into account.
This developed model is shown in detail in following references [10,11,12] and was demonstrated in an industrial test case [4]. In the following figure the material model and the calculation procedure is shown schematically.
4. Process simulation results
The objectives of the process simulation are process induced deformation and stresses. Therefore in this study only results of the sequential coupled thermo mechanical analysis are shown. The mechanical part of the simulation will be performed twice both on the “As-Planned” and the “As-Built” condition. In the following the result of the thermal analysis are shown. In this case the temperature, degree of cure and glass transition evolution at the sensor position against the process time is shown.
Figure 4: Results of the thermochemical analysis
The temperature in the part and mould are nearly uniform because the mould is made of epoxy material and therefore material properties are similar to the composite part. During the first curing phase a final degree of cure of 0.93 and a glass transition temperature of 144°C is archived. The vitrification point is reached after 821min. In the second post curing phase the degree of cure reaches nearly 1 and the final Tg is 155°C. The post curing is above the glass transition temperature and therefore again in a viscous material state. As already mentioned the mechanical part of the analysis is done on two different configurations. As mentioned the results of the process simulation are also the homogenized properties on the ply level. In the following table 1 these values are shown and the development of the Young’s modulus transverse to the fibre direction is shown in figure 11. The symbol I to III indicate the material state (I liquid, II viscous and III solid)
Figure 5: Development of the Young‘s modulus transverse to the fibre direction against process time
In the given case it was assumed that the fibre volume content is equally distributed. This assumption is valid for the Modified Vacuum Infusion process, for a RTM process the overlaps will increase fibre volume content significantly by over pressing.
In the following figure the process induced deformation is shown for both configurations.
As it can be seen the process induced deformation is increasing during the post curing step because higher temperatures are used. There is one additional effect visible in the deformation pattern. Sometimes especially if asymmetrical layups are used process induced deformations lead to bi-stable conditions with more deformation modes. In this case the higher thermal loads lead to a change of the deformation pattern. This effect was also discovered in previous studies related to highly asymmetrical layups [12, 13]
In comparison between the “As-Built” and “As-Planned” condition there is a change of absolute deformation after post curing from 162 mm to 188 mm by increasing the process induced deformation in this example around 13 %.
5. Conclusions
In this study, a sequential thermo mechanical approach including cure dependent material model was used to study the cure development and process-induced deformations in conjugation with Online Process Monitoring Methods.
A study was performed on the “As-Planned” and the “As-Built” configuration which incorporate deviation like overlaps. In summary this simulation method generates accurate values and represents the correct physical behaviour and demonstrates the effect of neglecting deviation on the manufacturing side.
6. Acknowledgement
The authors are grateful for the financial support provided by the European Commission within the framework FP7 of research project ECOMISE.
7. References
[1] M.Dix et al., Consistent Virtual CFRP Process Chain using a Modular CAE Interface, Nafems World Congress 2013, ISBN – 978 1 874376 91 0, 9-12.6.2013 Salzburg, Austria, page 53. [2] T. Wille et al., Development, implementation and Demonstration of
a Composite Tool Chain for Cuncurrent Engeneering, Nafems World Congress 2013, ISBN – 978 1 874376 91 0, 9-12.6.2013 Salzburg, Austria, page 85
[3] L. Kärger et al., Virtual process Chain for an Integrated Assessment of high- Performance Composite Structures, Nafems
World Congress 2013, ISBN – 978 1 874376 91 0, 9-12.6.2013 Salzburg, Austria, page 111
[4] C. Brauner et al., Analysing process-induced deformation and stresses using a simulated manufacturing process for composite multispar flaps, Journal of Composite Materials, published online before print February 6, 2014, doi, 10.1177/0021998313519281 [5] T. Wille et al., As-Built-Simulation within the Continues Composite
Process Chain, Mechanical response of composite ECCOMAS Conference, 21-23.9.2011 Hannover, Germany, page 19.
[6] O. Focke, A. Miene, et al.: Automated quality inspection in a continuous preforming process for Non Crimped Fabrics (NCF). The 11th International Symposium of Measurement Technology and Intelligent Instruments (ISMTII), Aachen, July 1-5, 2013. [7] Miene, et al.. Quality Assurance for Aircraft Structural Profile
Preforms. SAMPE Europe SETEC 11 LEIDEN – 06TH. INTERNATIONAL TECHNICAL CONFERENCE “Advanced Composites, The integrated System”, pp. 259-266, Sept. 14-16 2011, Leiden, NL.
[8] J.M. Balvers, H.E.N. Bersee, and A. Beukers (2008), Determination of Cure Dependent Properties for Curing Simulation of Thick-Walled Composites, 49th AIAA/ASME/ASCE/AHS/ASC Structures, Structural Dynamics, and Materials Conference, AIAA 2008-2035
[9] A. A. Johnston, An integrate model of the development of process-induced deformation in autoclave processing of composites structures, PhD thesis The University of British Columbia, 1996 [10] C. Brauner, T.Block, H. Purol, A.S. Herrmann, (2012), Microlevel
manufacturing process simulation of carbon fibre/epoxy composites to analyse the effect of chemical and thermal induced residual stresses, Journal of Composite Materials Volume 46 Issue 17, August 2012
[11] C. Brauner, P. Soprano, A. S. Herrmann, D. Meiners, Cure-dependent thermo-chemical modelling and analysis of the manufacturing process of an aircraft composite frame, Journal of Composite Materials, published online before print March 25, 2014, doi, 10.1177/00219983145277777
[12] C. Brauner, G.C. Pereira, A. S. Herrmann, Effects of fabric-based unbalances on process-induced distortions of composite materials, Journal of Composite Materials 0021998314533365, first published on May 16, 2014 doi:10.1177/002199831453336
[13] C. Brauner, Analysis of process induced distortions and residual stresses in composite structures, 2013, Herausgeber A. S. Herrmann, Logos Verlag Berlin, ISBN 978-3-8325-3528-5, Science Report Nr 8.
[14] A. Miene, A.S. Herrmann, M. Göttinger, Quality assurance by digital image analysis for the preforming and draping process of dry carbon fiber material. SAMPE Europe Conference, Paris, April 1-3, 2008