HAL Id: hal-01102477
https://hal-mines-paristech.archives-ouvertes.fr/hal-01102477
Submitted on 17 May 2019HAL is a multi-disciplinary open access archive for the deposit and dissemination of sci-entific research documents, whether they are pub-lished or not. The documents may come from teaching and research institutions in France or abroad, or from public or private research centers.
L’archive ouverte pluridisciplinaire HAL, est destinée au dépôt et à la diffusion de documents scientifiques de niveau recherche, publiés ou non, émanant des établissements d’enseignement et de recherche français ou étrangers, des laboratoires publics ou privés.
Surface graphitization of ozone-treated detonation
nanodiamonds
Jean-Charles Arnault, Tristan Petit, Hugues Girard, Céline Gesset, Mathilde
Combis-Schlumberger, Mohamed Sennour, Alex Koscheev, Andrei A.
Khomich, Olga Shenderova, Igor Vlasov
To cite this version:
Jean-Charles Arnault, Tristan Petit, Hugues Girard, Céline Gesset, Mathilde Combis-Schlumberger, et al.. Surface graphitization of ozone-treated detonation nanodiamonds. physica status solidi (a), Wiley, 2014, 211 (12), pp.2739-2743. �10.1002/pssa.201431397�. �hal-01102477�
Surface graphitization of ozone‐treated detonation nanodiamonds
Jean‐Charles Arnault
CEA, LIST, Diamond Sensors Laboratory, Gif‐sur‐Yvette, France, [email protected], Phone: +33 1 69 08 71 02, Fax: +33 1 69 08 78 19
Tristan Petit
CEA, LIST, Diamond Sensors Laboratory, Gif‐sur‐Yvette, France Helmholtz‐Zentrum Berlin für Materialien und Energie GmbH, Berlin, Germany
Hugues A. Girard
CEA, LIST, Diamond Sensors Laboratory, Gif‐sur‐Yvette, France Celine Gesset
CEA, LIST, Diamond Sensors Laboratory, Gif‐sur‐Yvette, France Mathilde Combis‐Schlumberger
CEA, LIST, Diamond Sensors Laboratory, Gif‐sur‐Yvette, France Mohammed Sennour
Mines Paris, Paristech, Paris, France Alex Koscheev
Karpov Institute of Physical Chemistry, Moscow, Russia Andrei A. Khomich
General Physics Institute, RAS, Moscow, Russia Igor Vlasov
General Physics Institute, RAS, Moscow, Russia Olga Shenderova
International Technology Center, Raleigh, North Carolina
Abstract
Bifunctional detonation nanodiamonds (NDs) were obtained by vacuum annealing at 750 °C of NDs previously oxidized in ozone (ND‐ozone). Raman investigations demonstrate a significantly higher amount of sp2 carbon compared to ND with polyfunctional surface (ND‐ NRI) annealed in vacuum under the same conditions. In addition to sp2 carbon caps, thermal desorption mass spectroscopy analysis revealed a higher oxygen concentration at the ND‐ozone surface with abundant carbonyl and carboxylic acid anhydride groups. The supernatant of ND‐ ozone annealed in vacuum exhibits a positive zeta potential (+50 mV at pH 6.5), while the starting sample has a high negative zeta potential (−60 mV). This supports the oxygen hole‐ doping model previously proposed to explain the positive zeta potential of NDs after vacuum annealing.
1 Introduction
After annealing under vacuum, detonation nanodiamonds (NDs) exhibiting graphitic caps or fullerene‐like reconstructions (FLRs) at their surface demonstrated excellent colloidal properties in water [1]. Their positive zeta potential (>30 mV), stable over a wide pH range (3– 8), was previously explained by an oxygen hole doping. The surface mechanism of charge
transfer was proposed to occur between adsorbed oxygen molecules and electron‐enriched FLRs via an electron transfer from the diamond core, comparable to the one taking place between graphene and its underlying substrate [2].
The possibility to tune the zeta potential of NDs from negative to positive and vice versa is essential to control their electrostatic interactions with biomolecules and to enable the loading of negatively (positively) charged drugs. Although NDs annealing under vacuum indeed convert the zeta potential to positive values, the formation of extensive sp2reconstructions may
potentially induce higher toxicity than that for the oxidized NDs [3]. Bifunctional NDs simultaneously covered by limited sp2 reconstructions and oxygen groups may offer a good
compromise for positively charged NDs toward biomedical applications.
Among the different reported oxidation treatments, ozone exposure appeared particularly powerful to provide clean NDs exhibiting a negative zeta potential [4]. Starting with negatively charged NDs, wet chemistry reduction reactions can be performed. Nevertheless, contamination with reactants and agglomeration of NDs were reported [5]. The ability to switch zeta potential from negative to positive using a vacuum treatment free of contamination would significantly simplify the treatment.
The present paper focuses on the combination of ozone treatment with annealing under vacuum. The nature of chemical surface groups as well as the colloidal stability of ozone‐treated detonation NDs graphitized under vacuum is investigated. The nature of surface groups and the density of FLRs on the graphitized ozone‐treated NDs are compared to those of graphitized NDs without preliminary ozone treatment. This combined approach constitutes a possible strategy to prepare bifunctional NDs.
2 Experimental
2.1 Characterization of initial NDs
Two sets of NDs were used in the present study. The first set underwent an ozone purification treatment (ND‐ozone) by New Technologies (Chelyabinsk) using experimental conditions previously reported [4]. Briefly, after acid treatments performed at ambient temperature to remove metallic impurities, detonation NDs were exposed to ozone environment over 72 h at a temperature range of 150–200 °C. Ozone mixed with dry air (4 vol% of ozone) was forced through a reactor while NDs were under constant stirring. The second set from a different origin consists in as‐received detonation NDs from Nanocarbon Research Institute (ND‐NRI) disaggregated to primary particles, used as comparison.
Both sets were characterized by X‐ray photoemission spectroscopy (XPS) using a monochromatized AlKα anode (hν = 1,486.6 eV). The spectrometer was equipped with an EA
125 hemispherical analyzer. The path energy was 20 eV, corresponding to an absolute energy resolution of 0.6 eV. Areas of XPS core levels were extracted after a Shirley correction of the background and atomic contents are calculated after correction by the photoionization cross‐ sections.
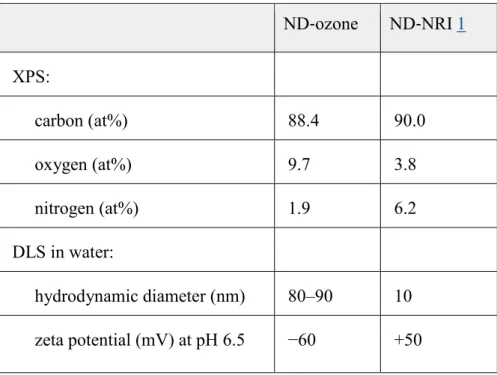
XPS analysis underlines an oxygen concentration 2.6 times higher for ND‐ozone compared to ND‐NRI (Table 1). This is expected after the surface oxidization occurring during ozone treatment [4]. Nevertheless, this difference could be partially related to the different origins of NDs. Moreover, the measured nitrogen concentration is three times lower for ND‐ozone
compared to ND‐NRI. This is most likely related to the different origins of the two detonation NDs. According to electrophoretic light scattering, both sets of as‐received NDs exhibit very different colloidal behaviors with opposite zeta potentials at pH 6.5 (Table 1). In addition, ND‐ ozone appears to be more aggregated than ND‐NRI with a mean size of 80–90 nm instead of 10 nm.
Table 1. Characterization of as‐received ND‐ozone and ND‐NRI
ND‐ozone ND‐NRI 1 XPS: carbon (at%) 88.4 90.0 oxygen (at%) 9.7 3.8 nitrogen (at%) 1.9 6.2 DLS in water: hydrodynamic diameter (nm) 80–90 10 zeta potential (mV) at pH 6.5 −60 +50
2.2 Annealing under vacuum
Both sets of NDs were simultaneously annealed during 1 h at 750 °C under a pressure of 3.7 × 10⁻⁶ Torr. These conditions were previously determined as optimal for FLRs formation
from an in situ UHV investigation [6]. It corresponds to the early stages of surface graphitization generating FLRs at ND surface without modification of the diamond core 1. The latter starts to graphitize for annealing temperatures higher than 900 °C. 80–100 mg of each ND powder was deposited in a closed aluminum oxide crucible for annealing treatments. Both crucibles were then introduced into a dedicated chamber furnace on a silicon carbide heating element. The crucible temperature was estimated using an FLIR SC300 infrared camera after calibration for the crucible emissivity.
To stop the annealing, the crucible was cooled down to room temperature under vacuum. A second set of ND‐ozone was prepared separately using the same annealing parameters.
2.3 Characterization of annealed NDs
After annealing under vacuum, the sp2/sp3 carbon ratio of both dry powders was investigated
by Raman spectroscopy, while surface groups present at NDs surface were identified using thermal desorption mass spectrometry (TDMS). The latter technique was particularly powerful to compare surface chemistries of NDs [7].
The Raman spectroscopy has been performed for blind layers of ND powders formed on the surface of Si substrates. Raman spectra of the NDs were obtained with a LABRAM HR800 spectrometer under 488 nm Ar+ laser excitation at room temperature. The laser beam of
∼0.1 mW power was focused into 2‐µm spots on the ND layers.
For TDMS measurements, a portion (6–7 mg) of ND powder was placed into the Ni envelope (precleaned ultrasonically in acetone and water and dried) and introduced into the high‐ temperature vacuum oven. The sample was then degassed under evacuation by an ion pump for some days at room temperature. The residual pressure at the end of degassing was in the range 10−7 Torr (MS chamber) and 10−8 Torr (pump chamber). TDMS analysis was performed by
measuring the mass spectra of gases released from the sample under programmed heating with a constant rate of 10 °C/min up to 1,100 °C. Mass spectrometer quadrupole MX7304 with electron multiplier. Mass range 10–110 amu (up to 700 °C) and 2–50 amu (700–1,100 °C). MS scan rate 1 min per scan (or 10 °C per scan). The evolved gases from the oven chamber were introduced through the calibrated valve into the MS chamber, which was pumped permanently with a high pumping rate. In this case, the measured partial pressures of gases were proportional to the desorption rates at every moment. The total pressures in the MS and pump chambers during heating were measured by ionization gauges. The pressure did not exceed 10−5 Torr in
MS chamber and 10−4 Torr in the oven chamber (control measurements) during measurements.
Blank measurements were performed under the same conditions using an empty Ni envelope without DND.
From the second ND‐ozone annealed set, a colloidal suspension was prepared: NDs were dispersed in ultrapure water by sonication (Hielscher UP400S, 300 W, 24 kHz) for 2 h under cooling. Large aggregates and NDs unstable in water were removed from the solution by 5 min of centrifugation at 14,800 rpm. The supernatant was characterized by DLS and zeta measurements. Finally, the crystalline structure and the graphitic caps covering NDs stable in water were investigated by high‐resolution transmission electron microscopy (HRTEM). HRTEM observations were carried out using a FEI Tecnai F20 field emission gun microscope operating at 200 kV and equipped with a Gatan imaging filter. A drop of NDs dispersed in methanol was deposited on a 3 mm diameter cooper grid covered with a holey carbon film. Images were taken near the Scherzer focalization (−63 nm) using a (1k × 1k) CCD camera.
3 Results
Surface chemistry and crystalline structure of both NDs sets were studied by Raman spectroscopy and TDMS.
3.1 Raman
The Raman spectra of ND‐ozone and ND‐NRI powders after the photoluminescence background subtraction are shown in Fig. 1. Strong G (around 1580 cm−1) and D (around
1350 cm−1) phonon modes of nanographite structures and the weak diamond mode at
1330 cm−1 observed in both Raman spectra reveal intense surface graphitization of analyzed
nanoparticles 1. The presence of a diamond mode shows a partial graphitization of both NDs preserving diamond cores. To compare the relative content of graphite in the two samples their Raman spectra were normalized to 1 in a maximum intensity of asymmetric G line proportional to graphite amount, and the intensities of fitted diamond lines were measured. The diamond lines were extracted from the spectra by fitting with Lorentzian profiles, with a linewidth of 25 cm−1 typical for detonation ND, as shown in Fig. 1. The ratio between the intensities of the
two obtained profiles in the normalized spectra provides information on the relative content of graphite in the two analyzed samples. The amount of nanographite in the ND‐ozone sample appeared to be three times larger than in ND‐NRI sample. Both raw NDs may have slightly different sp2 carbon content due to their different origins. Nevertheless, this cannot account for
the three times higher value obtained for ND‐ozone. This difference could be explained by a higher oxygen concentration in the as‐received ND‐ozone sample, as shown by XPS (Table 1). It is known that oxygen can stimulate surface graphitization of diamond [8, 9]. On heating in vacuum, oxygen bonded to the ND surface may act as the main catalyst for the surface graphitization.
Figure 1. Photoluminescence background‐subtracted and normalized Raman spectra of ND‐ ozone (red, lower curves) and ND‐NRI (black, upper curves) samples with Lorentzian profiles fitting the diamond lines.
3.2 TDMS
Both sets of NDs revealed a substantial amount of volatile species released below 700 °C (Fig. 2). Released H2O and H2 amounts are comparable for annealed ND‐ozone and ND‐NRI.
For both annealed NDs, the total amount of CO and CO2 species is 5–10 times lower than in
pristine ND‐ozone [3]. According to TDMS experiments, oxygen groups formed on reconstructed surface are more abundant in ND‐ozone than in ND‐NRI. The results of the deconvolution of the TDMS curves for CO and CO2 for the annealed NDs are illustrated in
Fig. 3. Possible assignments of the main peaks are as follows [4, 7]: peaks 200–400 °C (CO2only): carboxylic and lactone groups; peak near 550 °C (CO2 + CO): cyclic acid anhydride
species; peak near 690 °C (CO only): carbonyl‐type groups. The amounts of carbonyl and anhydride groups are increased by a factor between 2 and 3 compared to annealed ND‐NRI. Carbonyl groups are two times more abundant in ND‐ozone. These results also indicate that some of the carbonyl groups may be still stable at NDs surface after annealing under vacuum performed at 750 °C. This confirms the presence of oxygen groups covalently bonded to NDs coexisting with FLRs especially for annealed ND‐ozone.
Figure 2. Comparison of TDMS profiles of the main desorption products for annealed ND‐ ozone (black filled symbols) and annealed ND‐NRI (red open symbols). The samples had similar weights (6.5 and 7.0 mg, respectively).
Figure 3. Results of deconvolution of the TDMS curves for CO and CO2 using a multiple
Gaussian function for annealed ND‐ozone (left) and ND‐NRI (right). The measured profiles were corrected for the base lines.
The second set of annealed ND‐ozone was dispersed in water and the supernatant was extracted. The colloidal properties were measured by DLS and electrophoretic light scattering (Table 2). A stable suspension was achieved with a mean hydrodynamic diameter of 20 nm. The obtained zeta potential is highly positive (+50 mV) in contrast to the initial one (Table 1). Zeta‐potential values are comparable. HRTEM pictures show the high density of FLRs present for the supernatant of annealed ND‐ozone (Fig. 4).
Table 2. DLS and electrophoretic light scattering of annealed NDs supernatants in water
annealed ND‐ozone annealed ND‐NRI [1] hydrodynamic diameter (nm) 20 10
Figure 4. HRTEM picture of annealed ND‐ozone stable in water suspension. A high density of FLRs can be observed surrounding the diamond cores.
4 Discussion
Raman characterization of dry powders after annealing under vacuum demonstrates that sp2 content corresponding to the induced graphitization is three times higher for annealed ND‐
ozone than for ND‐NRI (Fig. 1). The different origins of both NDs can only partially explain this difference. This supports a more extended sp2 reconstructed surface area on ND‐ozone.
This graphitization may be promoted by the presence of oxygen at the ND surface. A previous report indicated that even a weak oxygen concentration can accelerate the graphitization kinetics of detonation NDs and affects the nature of sp2‐induced structures [9]. A similar
catalytic effect of oxygen was proposed for graphitization of diamond crystals [10, 11]. Oxygen may promote a new route for diamond conversion into sp2 forms [12]. In the present case,
according to the total pressure in the vacuum chamber during annealing, the partial pressure of O2 cannot exceed 8 × 10⁻⁷ Torr. The prior mechanism can then be neglected. However, the
pressure of gases inside the powdered sample may be much higher than in the vacuum chamber due to decomposition and desorption of surface groups during annealing. Reactions of solid phase with desorbed reactive gases are possibly causing the etching and deposition processes [12]. The higher graphitization of ND‐ozone may be caused by the higher abundance of surface groups in the pristine sample and hence the higher amounts of desorbed gases.
Note that the sample with larger sp2 reconstructed surface area again contains more abundant
oxygen at the surface, as follows from TDMS investigations (Fig. 2). One could suggest therefore that oxygen groups are also formed due to reaction of air oxygen/moisture with reconstructed (nondiamond structure) parts of the annealed sample surface at room temperature. Indeed, as the major part of these groups is decomposed in vacuum below 750 °C (annealing temperature) they can be formed only due to interaction of fresh annealed ND surface with oxygen and moisture during air exposure at room temperature. There is evidence that this type of interaction of vacuum‐annealed NDs is observed only if the annealing temperature is higher than 700 °C [13]. We previously reported a similar reactivity toward oxygen for ND‐NRI annealed under the same conditions [1]. This reactivity can be considered as a measure of the reconstruction level. The difference between TDMS data for annealed ND‐ozone and ND‐NRI can be explained by the higher reconstruction level of ND‐ozone in accordance with Raman data.
In addition, annealed ND‐ozone was revealed to be highly stable in water, exhibiting a high positive zeta potential at pH 6.5, +50 mV (Table 2). HRTEM observations of the supernatant collected from the stable suspension confirm the presence of a high density of FLRs surrounding ND‐ozone after vacuum annealing (Fig. 4). These observations are in fair agreement with the hole‐doping model already reported for annealed ND‐NRI 1. Indeed, the electron transfer occurring at the diamond/FLRs interface should be amplified as the FLRs density increases at the ND surface.
Another combination of surface treatments was previously studied starting with ND‐NRI 1. An annealing treatment in air was first performed at atmospheric pressure in a tubular furnace at 400 °C. This treatment is well known to clean the NDs surface from nondiamond carbon and to induce the formation of carboxyl groups at the surface. The XPS analysis of air‐annealed ND‐ NRI shows the presence of oxygen even after an annealing at 400 °C [14]. The noticeable modification of ND surface (increase in the concentration of CO2‐ and CO‐forming groups) was
observed by TDMS after air oxidation at temperatures as low as 300 °C [7]. This is confirmed by the negative zeta potential exhibited by this air‐annealed NDs sample. Then, air‐annealed NDs underwent a vacuum annealing at 750 °C for 1 h. The colloidal properties measured in water revealed an amphoteric behavior with a positive zeta potential at low pH [1]. Nevertheless, it does not exceed +15 mV. The FLR sizes and/or the defect concentration on FLRs, which depends on the initial ND surface chemistry and experimental conditions, therefore appear as crucial parameters for the presence and stability of positive surface charges on NDs.
5 Conclusions
The present study reports on a combined surface treatment of detonation NDs. Preliminary ozone‐treated NDs were annealed under vacuum to generate FLRs. According to Raman and TDMS results, a higher level of sp2 reconstruction has been achieved on ND‐ozone compared
to as‐received ND‐NRI simultaneously annealed. The different origins of both detonation NDs can only partially explain this difference. For annealed ND‐ozone supernatant, HRTEM characterization shows that most sp2 structures are FLRs as no onion‐like shells were detected.
This behavior is in line with the higher reactivity toward oxygen species evidenced after vacuum annealing for ND‐ozone. Aqueous suspensions of annealed ND‐ozone exhibits an excellent stability with a zeta potential of +50 mV at pH 6.5. This result strongly supports the oxygen hole doping model previously proposed to explain the origin of the positive zeta
potential of annealed ND‐NRI. Bifunctional NDs produced by successive ozone and vacuum annealing treatments are promising positively charged NDs toward biomedical applications.
Acknowledgements
The authors would like to thank Professor E. Osawa from NRI for providing the detonation nanodiamonds. The authors (I. I. V. and A. A. Kh.) acknowledge funding from the Russian Academy of Sciences, program no. 24. The TDMS studies were performed under financial support of Russian Foundation of Basic Research (grant # 13‐03‐01287).
References
[1]Petit, T., Arnault, J.‐C., Girard, H. A., Sennour, M., Kang, T.‐Y., Cheng, C.‐L., and
Bergonzo, P.,Nanoscale 21, 6792 ( 2012).
[2]Ryu, S., Liu, L., Berciaud, S., Yu, Y.‐J., Liu, H., Kim, P., Flynn, G. W., and Brus, L. E., Nano Lett. 10,4944 ( 2010).
[3]Sanchez, V. C., Jachak, A., Hurt, R. H., and Kane, A. B., Chem. Res.
Toxicol. 25, 15 ( 2012).
[4]Shenderova, O., Koscheev, A., Zaripov, N., Petrov, I., Skryabin, Y., Detkov, P., Turner, S., and Van Tendeloo, G., J. Phys. Chem. C 115, 9827 ( 2011).
[5]Krueger, A., Liang, Y. J., Jarre, G., and Stegk, J., J. Mater. Chem. 16, 2322 ( 2006).
[6]Petit, T., Arnault, J.‐C., Girard, H. A., Sennour, M., and Bergonzo, P., Phys. Rev.
B 84, 233407 ( 2011).
[7]Koscheev, A., Gas desorption from detonation nanodiamonds during temperature‐ programmed pyrolysis, in: Carbon Nanomaterials for Gas Adsorption, edited by M. L. Terranova, S. Orlanducci, and M. Rossi ( Pan Stanford Publishing, Singapore, 2012), pp. 219– 252.
[8]Evans, T., Changes produced by high temperature treatment of diamond, in: The Properties of Diamond, edited by J. E. Field ( Academic Press, London, 1979), pp. 403– 425.
[9]Kuznetsov, V. L., Butenko, Y. V., Zaikovskii, V. I., and Chuvilin, A. L., Carbon 42, 1057 ( 2004).
[10]Palosz, B., Grzanka, E., Pantea, C., Zerda, T. W., Wang, Y., and Gubicza, J., J. Appl.
Phys. 97,064316 ( 2005).
[11]Qian, J., Pantea, C., Voronin, G., and Zerda, T. W., J. Appl. Phys. 90, 1632 ( 2001).
[12]Kuznetsov, V. L. and Butenko, Y. V., Diamond phase transitions at nanoscale, in:Ultrananocrystalline Diamond: Syntheses, Properties, and Applications of UNCD, edited by O. Shenderova and D. M. Gruen, 2nd edn. ( Elsevier, Oxford, 2012).
[13]Koscheev, A. P., private communication.
[14]Michaelson, S., Akhvlediani, R., Petit, T., Girard, H. A., Arnault, J. C., and Hoffman, A., Appl. Surf. Sci. 305, 160 ( 2014).


![Table 2. DLS and electrophoretic light scattering of annealed NDs supernatants in water annealed ND ‐ ozone annealed ND ‐ NRI [1]](https://thumb-eu.123doks.com/thumbv2/123doknet/11513529.294323/8.892.113.703.817.967/table-electrophoretic-light-scattering-annealed-supernatants-annealed-annealed.webp)

