HAL Id: hal-01714948
https://hal.archives-ouvertes.fr/hal-01714948
Submitted on 6 Nov 2019
HAL is a multi-disciplinary open access archive for the deposit and dissemination of sci-entific research documents, whether they are pub-lished or not. The documents may come from teaching and research institutions in France or abroad, or from public or private research centers.
L’archive ouverte pluridisciplinaire HAL, est destinée au dépôt et à la diffusion de documents scientifiques de niveau recherche, publiés ou non, émanant des établissements d’enseignement et de recherche français ou étrangers, des laboratoires publics ou privés.
Elasticity of Si-C-O and C fibres at high temperature
Ml Bouchetou, Thierry Cutard, M Huger, C Gault
To cite this version:
Ml Bouchetou, Thierry Cutard, M Huger, C Gault. Elasticity of Si-C-O and C fibres at high tem-perature. Scripta Materialia, Elsevier, 1997, 37 (7), pp.1005-1010. �10.1016/S1359-6462(97)00214-5�. �hal-01714948�
EILASTICITY OF Si-C-O AND C FIBRES AT HIGH
TEMPERATURE
M.L. Bouchetou, T. Cutard’, M. Huger and C. Gault
Laboratoire Materiaux Cdramiques et Traitements de Surfaces ENSCI, 87065 Limoges, France
‘Ecole des Mines d’Albi Carmaux, 8 1013 Albi, France
Introduction
The knowledge of the evolution versus temperature of the elastic moduli of fibres used for making ceramic matrix composites (CMCs) is necessary to understand their behavior in service conditions, i.e. at high temperature. Some results have been obtained from tensile tests performed on retiactory fibres (i.e. carbon or ceramics), using specific equipments (l-4). However, the determination of Young’s modulus fr0m1 the slope at the origin of the stress-strain curve is difficult (in particular at high tem- perature and tmder controlled atmosphere) due to the thinness of the samples. Another way to deter- mine elastic c~onstants of.materials is to use non destructive ultrasonic pulse-echo techniques. This has been made in composites with matrix of known elastic properties (5-7) where the authors have calcu- lated the elasl:ic constants of the fibres from experimental results. Unfortunately this method has not been applied at elevated temperatures.
This paper reports on direct measurements of uniaxial Young’s modulus in refractory fibres using a particular ultrasonic pulse-echo technique in the 20°C-13OO’C temperature range. Amongst the most widely used fibres for CMCs industrial fabrication, we have tested two types: Nicalon NLM 202 (Si-C-O) from. Nippon Carbon and T300 (C) from Toray.
Experimental Procedure
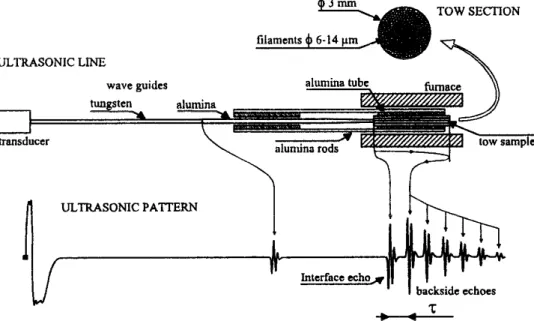
The technique, which has been described elsewhere (8), consists in measuring the velocity of ultra- sonic longitudinal waves in slender specimens via a refractory waveguide (“long bar” mode). The conditions for the propagation of this mode are D < h and L > h, where D is the sample diameter, L is the sample length and h is the wavelength. The technique works at a low frequency (300 kHz) which leads to a wavelength of some centimeters in solids. Then it is well suited for measurements into thin samples like fibres.
Samples 80 mm long have been cut from as-fabricated yarns made of 500 filaments of lo- 15 pm diameter for NLM202 and of 1000 filaments of 6-8 pm diameter for T300. The sample diameter was then inferior to 2 mm. It was glued to the end of an alumina waveguide by a refractory cement. In
order to maintain the straightness of the tibres, they were placed into an alumina tube with the waveguide as shown in Figure 1. The system was vertically fitted in a gastight tube into a furnace; it was able to work up to 1700°C in controlled atmosphere (free air, primary vacuum or argon).
Before starting the experiments, a first heating treatment of 30 min at 400°C in air for NLM202 and at 600°C in Ar for T300 has been made in order to remove the sizing on the fibres.
When complete desizing was achieved, it was assumed that the ultrasonic pulse propagated in the long bar mode along the isolated identical filaments with the velocity V related to the uniaxial Young’s modulus E of one filament and to density p by :
E=pV* (1)
V was evaluated from the measurement of the time z between successive echoes in the sample as reported in ref.@):
V=2L/z (2)
Results obtained during temperature runs at a constant rate of 5Wmin were plotted under the. form
(E - Eo)&= f(T), where Eo is the value corresponding to T = 20°C after removing the sizing.
Results and Discussion
The uniaxial Young’s moduli EQ along the axis of the fibres measured at 20°C after removing the sizing are given in Table 1.
They are in good agreement with results reported in the literature for similar fibres. Thermal expan- sion coefficients 01 along the fibre axis and density p which are used for the calculation of E by equations (1) and (2) are also listed in Table 1. For T300 there is some discrepancy between different authors about thermal expansion, in particular because of the anisotropic and nonlinear behavior versus temperature of the thermal expansion of carbon. Nevertheless for both fibres, a is lower than 5 10” and
ULTRASONIC LINE
TOW SECI-ION
* ULTRASONIC PATTERN
Figure 1. Details of sample/waveguide assembly for ultrasonic measurements at high temperature in fibres, and associated ultrasonic pattern.
TABLE 1
Young’s Modulus at 20°C (Eo), Thermal ExpansionCoefficient (a), and Density (p), for tbe Si-C-O (NLM202) and C (T300) Fibres
FIBRE a.lO’(K’) P (kg.m”) 215 +I- 2 (f) NLM 202 3.4 (WT. 12) 2550 (ref. 13) I SO-220 (W-.9- I I ) (2O”C- I 000°C) T300 221 +I- 2 (*) 220-230 (ref.4.6)
<4 (ref.4.12) I800 (ref.6)
(temp. dep.)
(*) Presem work
the length correction in equations (1) and (2) remains negligible compared to the experimental error (1%).
Evolutions of Young’s Modulus Versus Temperature for NLM202
The Si-C-O Nicalon NLM202 fibre is composed, in the as-processed state, of P-Sic nanocrystals (55wt.%) mixed with a SiOr.&o.~~ intergranular phase (40wt.%) and basic structural units (BSU) of free carbon (5wt.%) (10). This structure is stable up to 1000°C in non oxidizing atmosphere. At higher temperature, .the organization of BSU and the decomposition of the intergranular phase induce irre- versible modifications. Therefore 1000-I IOO’C is the highest temperature range for long time applica- tions of NLM202 based CMCs.
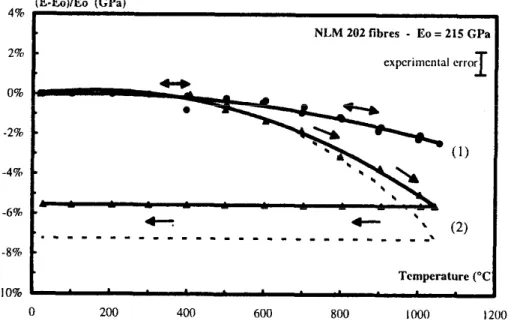
Curve (1) in Figure 2 reports the variations of E measured during a temperature run between 20°C and 1050°C in primary vacuum (5 IO** hPa), which can be considered as non oxidizing conditions for this tibre (14). A regular and reversible decrease versus temperature is observed. A second nm leads to a perfectly superimposed curve within the experimental error. This is characteristic of a stable structure of the material within the tested temperature range (15).
Compared to sintered Sic, Si-C-O tibres exhibit strong differences in elastic behavior :
- at room temperature EO = 2 15 GPa for NLM202 instead of 400GPa for sintered Sic;
- E linearly decreases with increasing temperature up to 1200°C with a slopel/T.dE/E of - 7.6 .lO-’ KS’ for sintered Sic (16). In the case of NLM202, E remains constant up to 5OO’C and then decreases with an increasing rate which becomes comparable to that of Sic at lOOO”C,
l/T.dE/E = -6 . IO-’ K-‘.
Curve (2) in Figure 2 shows the result of the same test performed in air at atmospheric pressure, without taking into account mass variations. In air, the curve drops for T > 600°C and the apparent Young’s modulus at 1000°C is 3% lower than E in non oxidizing atmosphere. Furthermore the curve is not reversible and after cooling to room temperature, it remains lower than Eo. This effect can be attributed to the formation of a silica layer around the fibres above 600°C (17): each filament is pro- gressively transformed into a Si-C-O/SiO2 microcomposite with a Young’s modulus lower than E for Si-C-O (E = ‘70 GPa for silica). Moreover, this oxidation is accompanied simultaneously by a volume expansion of the fibre and a mass increase, as it was previously shown by SEM observations and TGA measurements on the same tibre (17). Therefore density variations occur when the samples are oxi-
NLM202 fibres - Eo=215GPa
Temperature (“C
0 200 400 600 800 1000 1200
Figure 2. Relative variations of Young’s modulus in NLM 202 fibre during heating/cooling cycles up to 105O’C at SWmin: (1) primary vacuum; (2) air, atmospheric pressure without mass correction; the dotted curve corresponds to the lowest bound of curve (2) corrected for mass variations.
dized at high temperature and corrections have to be made in equ. (1) for the true evaluation of E(T). From results of reE( 17) the variation of density induced by oxidation can be calculated as follows:
Ap 1 p,, = -2.4 10” e (3)
where e is the thickness of the silica layer expressed in nm.
For aging lh at 1000°C in air, e was found to be approximately 70 nm. Therefore the variation of E coming from the decrease of p in equ. (1) remains lower than -1.7% at 1000°C. The dotted curve in Figure 2 gives the lowest bound for the variation of Young’s modulus in air.
Evolutions of Longitudinal Young’s Modulus Versus Temperature for T300
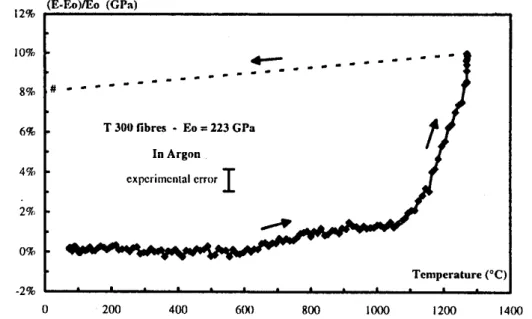
Figure 3 shows the variations of E during heating at a rate of 5Wmin. up to 1270°C under argon. After a dwell of OSh at 1270°C, the sample was cooled down to RT and a new coupling to the waveguide was made in order to determine the new value at 20°C. Two domains are observed on the (E-Eo)/E, = f(T) curve:
-for T<I lOO”C, E remains approximately constant;
-for T>l lOO”C, an increase of E is observed at a rate which increases with temperature. During the dwell, E increases with time.
This effect is irreversible even after cooling: the new value at 20°C is 8% higher than E. which exactly corresponds to the increase between 1100°C and the end of the dwell at 1270°C. It suggests that a structural transformation which induces an increase in elastic modulus along the axis occurred in the fibre above 1100°C.
The elastic properties of carbon-based crystallized materials cover a wide range because of the existence of numerous carbon types which are characterized by the order degree of the graphitic planes. The structure of ex-PAN tibres is generally described as crystals with a ribbon-like arrange-
8% 0% -2% T 300 fibrcs - Eo I 223 GPn In Argon t Temperature (“C
0 200 400 Goo 800 loco I200 14wl
Figure 3. Relative variations of longitudinal Young’s modulus in T300 fibre during heating under Ar up to 127OOC at SWmin. (#) value measured at 20°C after 2h at 127O’C.
ment of such planes, which are more or less oriented with respect to the tibre axis and separeted by nanopores. This structure strongly depends on the heat treatment used for processing: pyrolysis at 1000°C leads to porous unorganized structures and subsequent heat treatments at higher temperatures improve graphitization (l&19). The higher the temperature, the better is the ordering of graphitic planes, the higher the elastic modulus and the lower the ultimate strenght of the tibre (20). T300 are “high strength tibres” treated at a temperature inferior to 15OO’C which leads to incomplete graphitiza- tion. Therefore the irreversible increase of longitudinal Young’s modulus above 1lOO’C is a conse- quence of the improvement of graphitization.
Furthermore, it is expected that graphitization should be accompanied by densitication due to the decrease of porosity. Consequently, the measured Young’s modulus should be corrected at T > 1100°C. The values of E and p reported in literature range from 230 GPa, 1750 kg.ni3 for low graphitic tibres, up to 700 GPa, 2050 kg.m” for high graphitic tibres, respectively, and the variation of E versus p is approximately linear (19). Data interpolation shows that graphitization which induces an increase of 10% in E, involves an increase of p of less than 1%. This correction is negligible because it is of the same order of magnitude than the experimental error.
Conclusion
Ultrasonic measurements of Young’s modulus allow us to know the temperature range of structural stability of refractory tibres which are used for CMCs fabrication. In particular, it has been found that the oxidation of Nicalon NLM 202 in air above 600°C induces a decrease of elastic properties, and that heating T300 in Ar above 1100°C improves the longitudinal Young’s modulus because of graphitiza- tion. Such a technique can be used to investigate the effect of numerous structural changes at high temperature on the elastic behavior of fibres. It is obviously of practical interest for life time predic- tion of CMCs parts in service.
References
1. A.R. Bunsell, J.W.S. Hearle, R.D. Hunter, J. Phys. E Sci. Instr., 4, 868, (1971).
2. R.E. Tressler, J.A. Di Carlo, in High-Temperature Ceramic-Matrix Composites, R. Naslain, J. Lamon & D. Doumeingts eds., Woodhead publ. ltd., 33 (1993).
3. A.R. Bunsell, M.H. Berger, N. Hochet, in High-Temperature Ceramic-Matrix Composites II, A. Evans & R. Naslain eds., Ceramic Trans. ~01.58, Amer. Ceram. Sot. publ., 85 (1995).
4. S. Marion, Thesis, Paris XIII Univ., France (1993). 5. R.E. Smith, J. Appl. Phys., 43,6,2555 (1972).
6. T. Ishakawa, K. Koyama, S. Kobayashi, Jour. of Comp. Mater., 11,332 (1977). 7. H.M. Ledbetter, SK. Datta, T. Kyono, J. Appl. Phys., 65,9,3411 (1989). 8. T. Cutard, D. Fargeot, C. Gault, M. Huger, J. Appl. Phys., 75,4, 1909 (1994).
9. M. Takeda, J. Sakamoto, A. Saeki, Y. Imai, H. Ichikawa, Ceram. Engn. & Sci. Proc. 16,4,37 (1995). 10. P. Le Coustumer, M. Monthioux, A. Oberlin, Jour. Eur. Ceram. Sot., 11,95 (1995).
11. A.S. Fareed, P. Fang, M.J. Koczack, F.M. Ko, Ceram. Bull., 66,2,353 (1987).
12. J.F. Villeneuve, R. Naslain, J. Sevely, R. Fourmeaux, Compos. Sci. & Technol., 49,89 (1993). 13. C. Aubin, C. Lesniewsky, Jour. de Microscopic et Spectra. Electr., 12,471 (1987).
14. M. Huger, Thesis, Limoges University, France (1992).
15. C. Gault, in_h&&s. Sot. a., eds. Mater. Res. Sot., vol. 142,263 (1989). 16. R.L. Mehan, Jour. Mater. Sci., 13,358 (1978).
17. M. Huger, S. Souchard, C. Gault, Jour. Mater. Sci. Let., 12,414 (1993).
18. M. Guigon, A. Oberlin, G. Desarmot, Fibre Science and Technol., 20,55 & 177 (1984). 19. M.L. Bouchetou, Thesis, Limoges University, France (1996).