HAL Id: hal-01612001
https://hal.archives-ouvertes.fr/hal-01612001
Submitted on 7 Nov 2018
HAL is a multi-disciplinary open access
archive for the deposit and dissemination of
sci-entific research documents, whether they are
pub-lished or not. The documents may come from
teaching and research institutions in France or
abroad, or from public or private research centers.
L’archive ouverte pluridisciplinaire HAL, est
destinée au dépôt et à la diffusion de documents
scientifiques de niveau recherche, publiés ou non,
émanant des établissements d’enseignement et de
recherche français ou étrangers, des laboratoires
publics ou privés.
A crack propagation criterion based on Delta CTOD
measured with 2D-digital image correlation technique
A. Ktari, M. Baccar, M. Shah, N. Haddar, H. F. Ayedi, Farhad Rezai-Aria
To cite this version:
A. Ktari, M. Baccar, M. Shah, N. Haddar, H. F. Ayedi, et al.. A crack propagation criterion based on
Delta CTOD measured with 2D-digital image correlation technique. Fatigue & Fracture of Engineering
Materials & Structures, Wiley-Blackwell, 2014, 37 (6), p. 682-694. �10.1111/ffe.12153�. �hal-01612001�
A crack propagation criterion based on ΔCTOD measured with 2D-digital
image correlation technique
A. KTARI1,2, M. BACCAR1, M. SHAH1, N. HADDAR2, H. F. AYEDI2and F. REZAI-ARIA1
1Université de Toulouse; INSA, UPS, Mines Albi, ISAE; ICA (Institut Clément Ader) Route de Tiellet, Campus Jarlard, Albi, France,2Laboratoire de
Génie des Matériaux et Environnement (LGME), ENIS, Université de Sfax BP 1173-3038, Tunisia
A B S T R A C T The fatigue cracks growth rate of a forged HSLA steel (AISI 4130) was investigated using thin single edge notch tensile specimen to simulate the crack development on a diesel train crankshafts. The effect of load ratio, R, was investigated at room temperature. Fatigue fracture surfaces were examined by scanning electron microscopy. An approach based on the crack tip opening displacement range (ΔCTOD) was proposed as fatigue crack propagation criterion. ΔCTOD measurements were carried out using 2D-digital image correlation techniques. J-integral values were estimated using ΔCTOD. Under test conditions investigated, it was found that the use of ΔCTOD as a fatigue crack growth driving force parameter is relevant and could describe the crack propagation be-haviour, under different load ratio R.
Keywords forged steel; crack propagation; digital image correlation; CTOD; J-integral.
N O M E N C L A T U R E a = Crack length
COD (or δ ) = crack opening displacement CTOD (or δt) = crack tip opening displacement
dn = constant depending on materials properties DIC = digital image correlation
E = young modulus FCG = fatigue crack growth FCGR = fatigue crack growth rate
J = J-integral
Jmax = J-integral at maximal load Jmin = J-integral at minimum load
K = stress intensity factor
Kop = stress intensity factor at the crack opening load Kmax = stress intensity factor at maximal load
Kmin = stress intensity factor at minimum load n = strain hardening exponent
N = the number of cycles R = fatigue load ratio
SENT = single edge notch specimen SSY = small scale yielding
W = specimen width α = material constant δσmax
t = crack tip opening displacement at maximal load δσmin
t = crack tip opening displacement at minimum load ΔCOD (or Δδ ) = crack opening displacement range
ΔCTOD (or Δδt) = crack tip opening displacement range ΔJ = variation of the J-integral = Jmax! Jmin
ΔJδt = variation of the J-integral calculated from experimental Δδt
ΔK = Kmax! Kmin = stress intensity factor range
ΔKeff= Kmax! Kop = effective stress intensity factor range εp = plastic strain
σ0 = yield stress
I N T R O D U C T I O N
The crankshaft is an engine component that converts the linear piston movement into rotary motion while the force connecting rod is transformed to torque. It contains geo-metrical discontinuities or singularities, from which cracks can initiate and propagate until final fracture.1–9To predict the fatigue crack growth rate (FCGR) under different load-ing conditions, several models are proposed.10–13 Never-theless, the most simple and well known model to predict FCGR rate da/dN is a power law described by Paris and Erdogan14using stress intensity factor (SIF) range ( K) as in Eq. (1):
da
dN ¼C ΔKð Þm (1) where C and m are constants dependent on the materials and the environmental factors. This model can be quite useful in engineering applications. But it does address their physical phenomena that occur during crack propagation especially near the crack tip fields. Measuring changes in the compliance of cracked thin sheets 2024-T3 aluminium alloy, Elber, in 1971 has shown15the fatigue closure phe-nomenon at a remotely applied tensile stress. They attrib-uted it to the formation of a residual compressive stress behind the crack tip. This implies that only the load range between the opening load Popand the maximum load Pmax can affect the damage of the crack tip during the load cycle. Hence, they proposed to modify Paris relationship using only the portion of the stress intensity range above the crack opening load, as presented in Eq. (2):
da
dN ¼C ΔKef f
! "m (2)
where ΔKeff is the effective SIF range. Most of the re-searchers consider the concept of crack closure as a crucial mechanism regarding its relationship with load ratio effects on the crack propagation in metallic materials.16–21 To measure this crack closure, a number of techniques such as the electrical potential drop, the ultrasonic methods and the eddy current methods22were developed. Never-theless, there are still significant difficulties to correlate the crack closure measurements with the crack growth be-haviour in a consistent way.23–26
Several models exist in literature to predict the FCGR within structures. These models are based on the linear elastic fracture mechanics approach that assumes that
crack propagates in the small scale yielding (SSY) condi-tions (i.e. the crack length is much larger than the crack tip plastic zone). Nevertheless, this assumption is not usually prevailed especially at high temperature or even at ambient temperature when the material presents a ductile behaviour (i.e. the crack propagates with considerable plastic deformation in the vicinity of the crack tip). Hence, the FCG should be studied under elastic plastic fracture mechanics approach. Indeed, an energy criterion based on the J-integral, defined by Rice,27is suggested. In order to achieve this, the crack tip opening displacement range (ΔCTOD) is considered as an FCGR criterion. The use of this parameter is interesting in the way that it allows to establish experimentally the cyclic J-integral values.28,29 The ΔCTOD values are estimated from ΔCOD measure-ments, which are carried out using 2D-digital image corre-lation (DIC) methods.30,31 The latter are non contact methods that can remove the errors introduced due to probing. Also because it is a ‘post test’ measurement sys-tem, the data can be analysed with different parameters. Multiple points of local measurements by ‘virtual strain gauges’ can be applied along the crack line. The data from these points are extrapolated up to the crack tip to obtain the CTOD values.32,33 The full-field DIC displacement measurements have been the subject of many research over the past few decades. Dawicke and Sutton34have used the DIC method to measure the CTOA during the fracture tests of thin-sheet material (i.e. The CTOA is defined as the angle made by two straight lines: one line contained a point on the upper crack surface and the crack tip and the other line contained the crack tip and a point on the lower crack surface). Yusof and Withers35have used also the DIC to determine the crack tip position and stress intensity variations (KI and KII) for a pre-cracked aluminium CT specimen. Lopez-Crespo et al.36have applied a generalized approach to determine the SIFs KIand KIIfor any mixed mode (i.e. the complete range of mixed mode loading from pure mode I to pure mode II) measured directly from DIC displacement fields. This approach is presen-ted using a centre fatigue cracked heat-treapresen-ted 7010 T7651 aluminium plate. Roux and Hild37 have also applied DIC to study the crack propagation in ceramic as a brittle material. Becker et al.38 have presented a new methodology for evaluation of the J-integral domain based on DIC full-field displacement measure-ment. This methodology is tested and validated on three different specimen geometries for elastic, elastic–plastic and quasibrittle materials.
This paper aims to (i) study the fatigue crack behaviour of AISI 4130 forged steel used in train crankshafts under different load ratio, R, and (ii) apply ΔCTOD as crack propagation criterion micro scale 2D-DIC measurements.
E X P E R I E N C E S
Material and specimen preparation
The experiments were carried out on single edge notched tensile (SENT) specimens machined from AISI 4130 forged steel and were taken from the counterweights of fractured train crankshaft. The chemical analysis of the crankshaft material was carried out using a spectroscopic metal analyzer (Jobin Yvon JY 48®), and the chemical composition is given in Table 1.
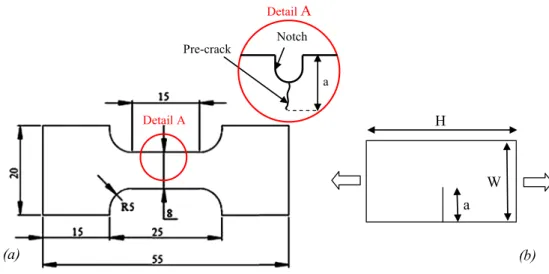
As mentioned earlier, fatigue experiments were carried out on SENT specimens (Fig. 1). All of these specimens were machined by a wire electrical discharge machining. Then, they were quenched from austenitizing temperature (900 °C) and subsequently tempered at 595 °C for 1 h to achieve a hardness of 235 HV1 and a R0.2of 540 MPa at room temperature. The heat-treated steel (Fig. 2) presents a fine ferritic–perlitic microstructure, in which the grain size is in a range of 3–9 μm and some bainitic lathes. The heat-treated plates were electro-discharged and ground to form specimens’ flat with a thickness of 1 mm. Then, the specimens were polished parallel to the loading axe down
to 1 μm diamond pastes. Finally, these specimens were notched by a wire saw with a wire diameter of 0.3mm and pre-cracked under high-frequency cyclic loading until an initial crack length ranged from 0.8 to 1 mm.
Fatigue crack growth tests
The fatigue crack propagation tests were carried out on a servo-hydraulic universal testing machine ‘WALTER +BAI LFV 40’. Specimens were cycled under purely
Table 1 Chemical analysis of the crankshaft forged steel (AISI 4130)
Elements C Si Mn P S Cr Mo Ni
Weight % 0.263 0.236 0.55 0.01 0.006 1.02 0.176 0.196
Fig. 1 Dimensions of SENT specimen (in mm). (a) Modified specimen and (b) normalized specimen.
Fig. 2 Material microstructure (3% Nital etching) observed after heat treatment with optical microscope.
tensile loading at room temperature using a sine wave-form at a frequency of 10 Hz. In addition, two load ratios, R(R = Pmin/Pmax) of 0.1 and 0.7 were applied and held constant for each experiment, to study the effect of R on the FCGR. The maximum applied loads (Pmax) ranged from 1.2 to 3.4 kN. This corresponds to a crack length and ΔK values ranges of 0.96–4.16 mm and 8–38 MPa√m, respectively. Under these loading conditions, the radius of the cyclic plastic zone around the crack tip is ranged from 0.047 to 0.495 mm (R = 0.1) and from 0.022 to 0.08 mm (R = 0.7) respectively in the beginning and end of each experiment. These values are calculated using Bathias and Pelloux model39as given:
rpc ¼ 0:1 ΔKσ0 # $2
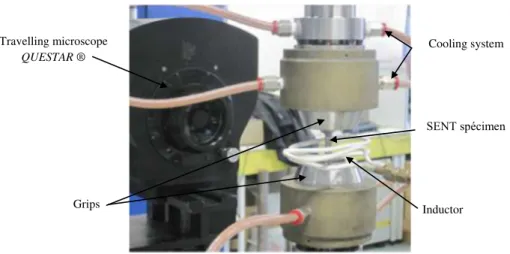
The length of the crack was optically observed, in situ using a ‘QUESTAR®’ long distance travelling micro-scope, which was installed in front of the specimen as shown in Fig. 3.
Fracture surface examination
Fracture surfaces were prepared for examination using scanning electron microscopy (SEM) ‘Nova nano SEM 450’ operated at 20 keV. Several observations were made to characterize the fractography over the whole range of ΔK for each tested specimen.
ΔCTOD measurements
The crack length was observed at different prescribed lengths. A magnification of 1000 with a maximum optical resolution of 1.1 μm/pixel could be achieved. The field of view, depending on zoom, was between 0.375 and 8 mm. The microscope is connected to a CCD camera ‘Sony
EXWAVE HAD’ with a resolution of 470 × 300 pixels to capture images throughout measurement cycles. The combination between the microscope and the camera provided 0.4 mm field of view and 400 horizontal lines on the CCD sensor. Theoretically, this configuration allows us to take an image resolution of 1 μm/pixel. Prac-tically, the resolution does not exceed 1.54 μm/pixel. This might principally be due to the errors induced by machine vibrations.
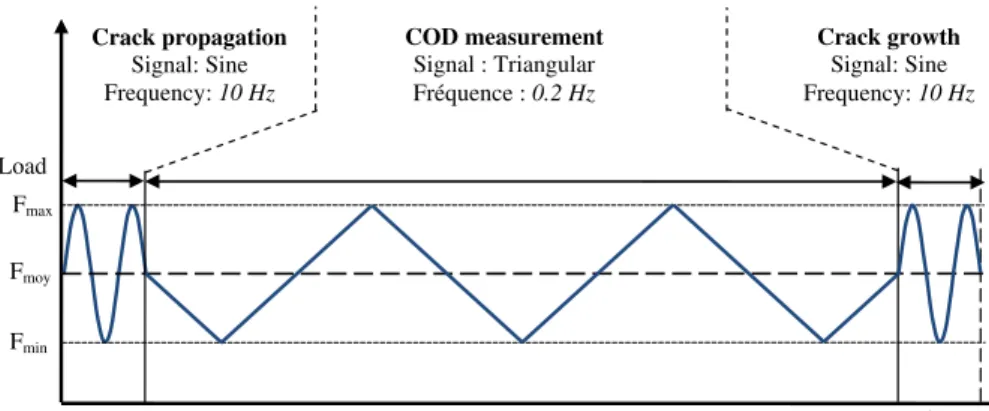
The maximum number of pictures taken with a CCD camera is 25 per second. Indeed, it is impossible to have all details around the crack field under 10 Hz frequency. As a consequence, to record the video of crack while cy-cling, the frequency was decreased to 0.2 Hz, and loading signal was changed from sine to triangular (Fig. 4). Then, videos were downloaded and transformed into images using image analysis software iMovie HD®. Finally, the DIC was performed on images for each measurement using a commercially image correlation software ‘VIC 2D® ’.40The first measured image in any cycle was used as the reference image. Then, virtual gauges were placed at different distances behind the crack tip using two-subsets DIC displacement gauges (Fig. 5). Mostafavi and Marrow41have revealed that the size of the virtual gauges and their distance from the crack can noticeably change the COD values. Carrol et al.30 have introduced and compared two full-field DIC method to a DIC based on displacement gauge method (i.e. each gauge consists of two subsets, one on each of the crack flanks) at relatively low, medium and high K experiments. They showed that crack opening levels calculated from the full-field effective K method is in agreement with displacement gauge closure levels far from the crack tip in the constant opening level region. Indeed, in this study, we supposed that subset size and their distance from the crack have no noticeable effect on the COD values. Subset size of 29 by 29 pixels square
Travelling microscope
QUESTAR®
Inductor Grips
Cooling system
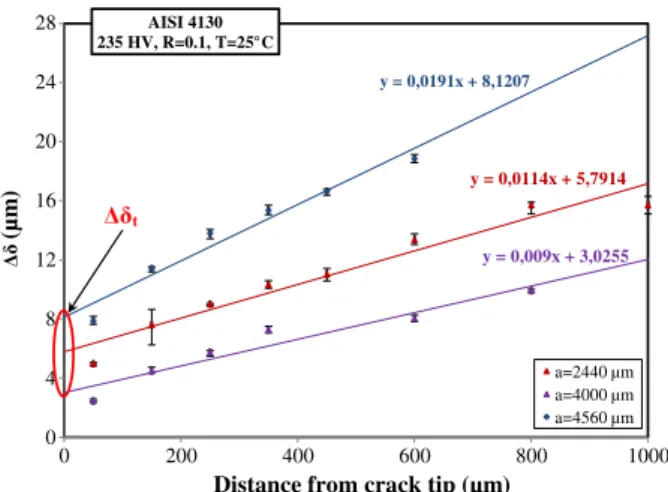
was used, corresponding to a gauge width of 45 μm and a typical length of 100 μm. Also, a step size of 5 was chosen42 (i.e. the step size controls the spacing of the points that are analysed during correlation). The accuracy of the subset displacement was fixed at 0.1 pixels that corresponds to a precision of 0.154 μm. Figure 6 shows an example of mea-sured ΔCOD (Δδ) at six different crack length (a) during a cycle. These ΔCODs versus a was extrapolated to a = 0 to obtain ΔCTOD (Δδt) that is considered as the opening of the crack tip for a given crack length.43The complete de-scription of ΔCTOD calculation is described in Section 3.3.
R E S U L T S A N D D I S C U S S I O N S
Effect of load ratio, R
The crack length evolutions versus number of cycle curves were plotted. Then the FCGR (da/dN) for each
curve were presented as a function of the nominal ΔK or ΔpffiffiffiffiffiffiffiffiffiffiffiJI:E% in log–log scale to present Paris’s law according to Eqs (3)–(5): ΔKI ¼ Δσpffiffiffiffiffiπa:f a W & ' (3) f a W & ' ¼ 1:0869 þ 0:2383& 'Wa þ 1:9830& '2Wa !2:8373& '3Wa þ 2:5771& '4Wa (4) KI ¼pffiffiffiffiffiffiffiffiffiffiffiJI:E%⇒ΔKI ¼ ΔpffiffiffiffiffiffiffiffiffiffiffiJI:E% (5) where ‘a’ is the crack length and ‘W’ is the specimen width. The expression of the correction factor (4) was de-veloped and verified by Shah et al.44using finite element analysis for elastic and/or an elastoplastic behaviour at room temperature. E* is apparent elastic modulus that is
Gauges
Crack tip
100 100 50
Notch
45
Note: all dimensions in µm
Fig. 5 Placement of virtual gauges behind crack tip in reference image (crack length = 800 μm, R = 0.1).
Crack propagation Signal: Sine Frequency: 10 Hz Load Time Fmax Fmin Fmoy COD measurement Signal : Triangular Fréquence : 0.2 Hz Crack growth Signal: Sine Frequency: 10 Hz
equal to E and E/(1 ! ν2) for plane stress and plane strain conditions, respectively, and J is the energy release rate. The effect of the load ratio on the conducted tests is shown in Fig. 7. The increasing of load ratio shows that threshold value decreases from 11 MPa√m at R = 0.1 to 8 MPa√m at R = 0.7. This result is in agreement with previous works conducted on ferrous and non ferrous metal.45,46 The slope of the Paris law ‘m’ is constant and about 3.8. As expected, the increase of the R ratio in-creases da/dN for a given ΔpffiffiffiffiffiffiffiffiffiffiffiJI:E%. It is obvious that the FCGR curve obtained at load ratio R = 0.7 is twice higher than that obtained at R = 0.1. This is usually explained by the presence of a crack closure effect at lower R ratio, which decreases the crack driving force.
Observation of fatigue fracture surfaces
The SEM fractographs of the tested specimens at load ratio R = 0.1 and 0.7 are investigated at different ΔpffiffiffiffiffiffiffiffiffiffiffiJI:E%values. For the first one, Fig. 8a shows that the fractured surface is flat for relatively low (11–16 MPa
ffiffiffiffi m
p ) and medium values (16–30 MPa ffiffiffiffimp ) of Δ ffiffiffiffiffiffiffiffiffiffiffipJI:E% and presents several beach marks characteristics of the progressive propagation of the crack front during an experiment. In general, the presence of beach marks on fatigue fracture surface reveals a change in crack growth conditions. However, their presence in this case can be attributed to the frequency changes during the experi-ment (i.e. when we pass from sine to triangular signal to take video). The SEM observations of the crack front are linear and perpendicular on loading direction. This proves that this specimen is probably tested under plane strain condition at low and medium ΔpffiffiffiffiffiffiffiffiffiffiffiJI:E% values, which corresponds approximately to a crack length less than 3.6 mm. Additional observations carried out at the specimen crack profile with optical microscope show branching and decohesion of grain boundaries (Fig. 8d), which proves that crack propagation is mostly inter-granular in this stage.
For long crack length (i.e. near ΔKI max¼ ΔpffiffiffiffiffiffiffiffiffiffiffiJI:E%max), the fractured surface presents several ratchet marks indicat-ing the boundary between adjacent crack planes (Fig. 8b). Also, Fig. 8b shows the presence of river marks that is fre-quently a characteristic of a relatively fast-growing fatigue crack zone as well as an increase in shearing plane forma-tions due to the large plastic zone size. Relying on the aforementioned information, it is clear that the condition of the crack propagation was changed from SSY to large
1,00E-08 1,00E-07 1,00E-06 1,00E-05 1 10 100 da/dN (m /cycle)
Fig. 7 Effect of load ratio R, on da/dN versus Δ ffiffiffiffiffiffiffiffiffiffiffiJI'E%
p
on FCRG of forged steel at room temperature (room temperature, f = 10 Hz).
-2 2 6 10 14 18 22 0 2 4 6 8 10 12 14 16 18 20 CO D (µm ) Time (s) 50 µm 150 µm 250 µm 350 µm 450 µm 600 µm
Fig. 6 Variation of COD as a function of a number of images during fatigue cycles on a specimen of 1 mm tested under a load ratio (crack length = 4560 μm, R = 0.1).
scale yielding for approximately high ΔpffiffiffiffiffiffiffiffiffiffiffiJI:E%values rang-ing from 30 to 38 MPa ffiffiffiffip , which corresponds to them fatigue fracture toughness value.
It is to be noted that fatigue striations were observed in all propagation stages (i.e. all ΔpffiffiffiffiffiffiffiffiffiffiffiJI:E% range values), which proves the ductile behaviour of the material. Figure 8c shows fatigue striations near the end of the crack propagation where each striation measures approx-imately 0.92 μm corresponding to a local FCGR of 9.2 × 10!7m/cycle (Δ ffiffiffiffiffiffiffiffiffiffiffiJ
I:E%
p ≃25–30 MPa ffiffiffiffi m p ).
For the second one (i.e. the fatigue fracture surface of the tested specimen at R = 0.7), Fig. 9a shows that the fa-tigue fracture surface was also flat in the beginning of crack propagation (i.e. low ΔpffiffiffiffiffiffiffiffiffiffiffiJI:E% values) with transgranular fracture mode. This fracture mechanism can be explained, in this stage, by the fact that the grain size, and the cyclic plastic zone size are in the same order. The increase of the crack length and subsequently the value of ΔpffiffiffiffiffiffiffiffiffiffiffiJI:E%changes the propagation mode to mixed intergranular and transgranular with the presence of some beach marks (Fig. 9b). The fatigue fracture surface shows also that the crack front is linear and perpendicular on loading direction in all stages of the
fatigue crack propagation. This proves that the specimen is probably tested under plane strain condition. Figure 9c shows intense localized deformation in slip bands near the crack tip that leads to the creation of new crack surfaces by shear decohesion and to create the ‘zig-zag’ crack path. This mechanism is dominant when cyclic plastic zone size is sufficiently large compared to the grain dimension.47,48
Application of CTOD as a fatigue crack propagation criterion
The J-integral approach presumes deformation plastic-ity and treats elastic–plastic materials as a nonlinear elastic material. This cause problems when using the cy-clic J-integral (ΔJ) approach proposed by Dowling,29 because the material unloads has to follow the same path as the loading curve. However, this is not the case because common materials show an elastoplastic behav-iour, which while unloading simply follows a linear elastic path. Chow49 has performed a detailed critical analysis of ΔJ parameters. Despite this critical analysis, ΔJ has been successfully applied to elastic–plastic fatigue crack growth.50–53
(c) (a) Beach marks (b) Ratchet marks River marks (d)
Fig. 8 Fatigue fractured surface of tested specimen R = 0.1 observed with SEM. (a) Low and medium Δ ffiffiffiffiffiffiffiffiffiffiffiJI'E%
p
values, (b) high Δ ffiffiffiffiffiffiffiffiffiffiffiJI'E%
p
values, (c) fatigue striation and micro-cracks (shear planes) and (d) crack branching and grain boundary decohesion.
The relationship between J and CTOD is proposed by Rice27 and extensively reviewed by Shih28 among others, principally Hutchinson, Tracey, McMeeking and McClintock.54–57 The calculations are based on monotonic loading of the crack tip. The monotonic plas-tic strain is related to the stress in power law hardening material relationship given in Eq. (6):
εp¼ α σ0σ # $n!1σ
E (6)
where E, α, n and σ0represent Young’s modulus, a mate-rial constant, the hardening exponent and the yield stress of the material, respectively.
Based on the power low description, Hutchinson,54 Rice and Rosengren58 (HRR) showed that the stress and strain field in the vicinity of the crack are
σij¼ σ0 JE ασ2 0Inr # $1= nþ1ð Þ σijðθ; nÞ (7) εij¼ασE0 ασJE2 0Inr # $n= nþ1ð Þ εijðθ; nÞ (8)
where r, θ are polar coordinates centred at crack tip, Inis an integration constant and σij(θ,n) and εij(θ,n) are
dimensionless functions of the hardening exponent n. Equations (7) and (8) are valid for both plane stress or plane strain conditions. The J-integral represents the amplitude of HRR singularity described by Eq. (9). The crack opening profile δt may be presented in a similar form (Fig. 10a). Thus, the edge of the crack (θ = ± π) are given by δ 2 ¼ ασ0 E JE ασ2 0In # $n= nþ1ð Þ r1= nþ1ð Þuyð Þn ux¼ασE0 ασJE2 0In # $n= nþ1ð Þ r1= nþ1ð Þuxð Þn (9)
where uxand uyare displacement in the x and y direc-tions respectively, while δ = 2uy. The definition of δt suggested by Rice27and reviewed by Tracey53(Fig. 10b) defines δtas the opening distance between the intercept of two 45° lines drawn back from the crack tip with the deformed profile. At the intercept,
r ! ux¼2δ (10)
Under linear elastic conditions, the value of δ that satisfies Eqs (9) and (10) is given by Shih28(Eq. (11)):
Beach marks (b) 200 µm (c) Crack tip Principal crack Slip bands (a)
Fig. 9 Fatigue fracture surface of tested specimen at R = 0.7. (a) Near threshold fatigue crack growth, (b) high ΔpffiffiffiffiffiffiffiffiffiffiffiJI'E%values and (c) profile of
δt¼ dn J
σ0 (11)
This expression is valid for both plane stress and plane strain condition. The coefficient dn is a function of the material properties. It varies slightly with σ0/E but signif-icantly with n. For elastic-perfectly plastic materials and under plain strain condition, the value of dn approaches 0.78 when n → ∞. The complete evolution of dn with respect to n and σ0/E is shown in Fig. 11.
The model presented earlier is basically used for the monotonic loading of the cracked specimen. However, in this study, the model should be adapted in such a way to be coherent with the cyclic loading of the cracked SENT specimen. Indeed, some assumptions that have been made regarding to the state of stress and strain in SENT specimens are (i) specimen is loading under plane strain condition according to SEM fractured surfaces ob-servation and (ii) all used material properties are obtained from cyclic tests (i.e. LCF total strain (Rε= !1)); control tests are conducted on a 250 kN servo-hydraulic machine ‘Schenck Hydropuls PSB®’ at room temperature for variable total strain range (ε = ± 0.3–1%). Shih’s model28 has been modified in such a way that we can calcu-late the crack driven force from Δδt as presented in Eq. (12):49
Δδt¼ dnΔJIσ0 with Δδt¼ δσmax
t ! δσtmin (12) Eq: 5ð Þ K! I2¼ JI:E%"and Eq: 12ð Þ⇒ δσmax t ¼ dnJI max σ0 ¼ dn K2 I max E%σ0 ! δσmin t ¼ dnJI min σ0 ¼ dn K2 I min E%σ0 ! 8 > > > > > < > > > > > : (13) Eq: 13ð Þ ⇒ Δδt¼ dn K 2 I max E%σ0 ! ! dn K 2 I min E%σ0 ! (14)
Equation (14) shows that ΔKIdepends on the square root of the Δδt. The load ratio is also taken into account to present a coherent fatigue crack propagation law:
R ¼KKI min
I max (15)
All mathematical treatment from Eqs (16) to (21) are formulated by Shah59 Eqs 14ð Þ and 15ð Þ⇒Δδt¼ dn K 2 I max E%σ0 ! !Edn%σ0ðR'KI maxÞ 2 (16) ⇒Δδt¼Edn%σ0K2Imax!1 ! R2" (17) Equation (17) may be used to calculate the SIF range from ΔCTOD denoted ΔKδt
Imax: Kδt I max¼ ffiffiffiffiffiffiffiffiffiffiffiffiffiffiffiffiffiffiffiffiffiffi E%σ0Δδt dn!1 ! R2" s (18) ΔKδt
I ¼ KδtImax! KδtImin¼ 1 ! R! app"
ffiffiffiffiffiffiffiffiffiffiffiffiffiffiffiffiffiffiffiffiffiffi E%σ0Δδt dn!1 ! R2" s
(19)
where R is used to calculate Kδt
Imax parameter and Rappis any value of the applied load ratio. In the case where Fig. 11 Variation of dnwith and σ0/E for plane strain condition.28
x
y
45°
(b) Deformed profile
(a) Sharp crack
r
the plasticity at the crack tip cannot be ignored, we replace K2 Imax=E%by JImax: Jδt Imax¼ σ0Δδt dn!1 ! R2" (20) ΔJIδt¼ 1 ! R2 app & ' σ0Δδt dn!1 ! R2" (21) The ΔJδt is calculated from optical measurements of ΔCTOD (or Δδt). Taking the crack tip as the origin, a number of virtual extensometers at specified distances are placed in the order behind the crack tip. Each exten-someter gives a Δδ (or ΔCOD) values. Obviously the ex-tensometer that is further away will show higher ΔCOD values (Fig. 6). Thus all the Δδ values are plotted against the position of the extensometer and extrapolated to the crack tip as shown in Figs 12 and 13. The evolution of Δδt versus the crack length is presented in Fig. 14. It
appears that the difference between these curves is rela-tively small at short crack length and increases continu-ously with the crack length. The FCGR criterion based on J-integral is defined as:
da dN ¼A ffiffiffiffiffiffiffiffiffiffiffiffiffiffiffiffi ΔJIδtE% q # $m (22)
The evolution ofpffiffiffiffiffiffiffiffiffiffiffiffiffiffiffiffiΔJIδtE%measured by using Δδtat room temperature and for two conditions of crack prop-agation of R = 0.1 and 0.7 are compared in the Fig. 15. The values of thepffiffiffiffiffiffiffiffiffiffiffiffiffiffiffiffiΔJIδtE%are higher for the specimen tested at R = 0.1. The FCGR curves based on this crite-rion are plotted in Fig. 16. It is clear that curves are su-perposed and can generate a master FCGR curve in which crack closure phenomena is ignored in a greater part. The advantage of this approach, based on the calcu-lation of ΔCTOD with optical techniques, is that ΔJIδtis a macroscopic parameter that does not need any other de-tailed quantitative microscopic models to describe FCGR.
y = 0,0048x + 1,5146 y = 0,0057x + 1,7275 y = 0,0057x + 2,0792 y = 0,0082x + 2,1087 0 2 4 6 8 10 0 200 400 600 800 1000 (µm )
Distance from the crack tip (µm) AISI 4130 235 HV, R=0.7, T=25°C a=1480µm a=1930µm a=2380µm a=2830µm
Fig. 13 Evolution of Δδ as a function of extensometer position be-hind the crack tip (R = 0.7)
0 4 8 12 16 20 24 28 0 200 400 600 800 1000 (µm )
Distance from crack tip (µm) AISI 4130
235 HV, R=0.1, T=25 C
a=2440 µm a=4000 µm a=4560 µm
Fig. 12 Evolution of Δδ as a function of extensometer position be-hind the crack tip (R = 0.1).
y = 0,9875e y = 1,0586e 0 2 4 6 8 10 1 2 3 4 5 (µm ) Crack length (mm) AISI 4130 235 HV, T=25 C R01T25F10 R07T25F10 R = 0.1 R = 0.7
Fig. 14 ΔCTOD variation law as a function of crack length (R = 0.1 and 0.7) (room temperature, f = 10 Hz).
0 5 10 15 20 25 30 35 40 45 50 0 0,5 1 1,5 2 2,5 3 3,5 4 Crack length (mm) AISI 4130 235 HV, T=25 C R01T25F10 R07T25F10 R = 0.1 R = 0.7
Fig. 15 Evolution of pffiffiffiffiffiffiffiffiffiffiffiffiffiffiffiffiΔJδt'E% versus Crack length for different
C O N C L U S I O N
The FCG behaviour of AISI 4130 forged steel used in train crankshaft applications was studied for two different load ratio (R = 0.1 and 0.7) at room temperature. It was found that FCGR at load ratio, R = 0.7 was twice higher than that obtained at R = 0.1. The increase of FCGR was mostly explained by the presence of the crack closure phenomenon at R = 0.1, which can decrease the crack tip driven force.
The cyclic J-Integral as fatigue crack propagation criterion was used. It was determined from the experi-mental ΔCTOD (Δδt) measured using direct optical ob-servation of the fatigue crack propagation. It was found that the use of ΔCTOD as a crack driving force param-eter, under tested parameter is interesting and presents
an R independent alternative to the simulated ΔK parameter. This method, which is based on an optical measurement, can be a very interesting technique to predict the structures lifetime especially when SSY condition is not respected (i.e. when plasticity around the crack tip becomes important). However, it will be interesting to check the validity of this presented methodology for other experimental conditions, espe-cially at high temperature.
R E F E R E N C E S
1 Ktari, A., Haddar, N. and Ayedi, H. F. (2011) Fatigue fracture expertise of train engine crankshafts. Engineering Failure Analysis, 18, 1085–1093.
2 Espadafor, F. J., Villanueva, J. B. and Garcia, M. T. (2009) Anal-ysis of a diesel generator crankshaft failure. Engineering Failure Analysis, 16, 2333–2341.
3 Fonte, M. and de Freitas, M. (2009) Marine main engine crank-shaft failure analysis: a case study. Engineering Failure Analysis., 16, 1940–1947.
4 Bayrakçeken, H., Tasgetiren, S. and Aksoy, F. (2007) Failure of a single cylinder engines crank shafts. Eng Fail Anal, 14, 725–30.
5 Asi, O. (2006) Failure analysis of a crankshaft made from ductile cast iron. Engineering Failure Analysis, 13, 1260–1267. 6 Wang, C., Zhao, C. and Wang, D. (2004) Analysis of an unusual
crankshaft failure. Engineering Failure Analysis, 12, 465–473. 7 Pandey, R. K. (2003) Failure of diesel-engine crankshaft.
Engineering Failure Analysis, 10, 165–175.
8 Silva, F. S. (2003) Analysis of vehicle crankshaft failure. Engineering Failure Analysis, 10, 605–616.
9 Bhaumik, S. K., Rangaragu, R., Venkataswamy, M. A., Bhaskaran, T. A. and Parameswara, M. A. (2001) Fatigue fracture of crankshaft of an aircraft engine. Engineering Failure Analysis, 9, 255–263.
10 Walker, E. K. (1970) The effect of stress ratio during crack propagation and fatigue for 2024-T3 and 7076-T6 aluminum. In: Effect of environment and complex load history on fatigue life, ASTM STP 462. American Society for Testing and Materials, Philadelphia, 1–14.
11 Forman, R. G. (1972) Study of fatigue crack initiation from flaws using fracture mechanics theory. Engineering Fracture Mechanics, 4(2), 333–345.
12 Collipriest, J. E. (1972) An experimentalist’s view of the surface flaw problem. The Surface Crack: Physical Problems and Computational Solutions. American Society of Mechanical Engineers, New York, 43–62.
13 McEvily, A. J. (1974) Phenomenological and microstructural aspects of fatigue. Presented at the Third International Confer-ence on the Strength of Metals and Alloys, Cambridge, England, published by The Institute and The Iron and Steel Institutes, Publication, W36, 204–213.
14 Paris, P. C. and Erdogan, F. (1960) A critical analysis of crack propagation laws. Journal of Basic Engineering, 85, 528–534. 15 Elber, W. (1971) The significance of fatigue crack closure.
ASTM STP 415, 230–242.
16 Antunesa, F. V., Rodriguesa, D. M. and Brancob, R. (2010) An analytical model of plasticity induced crack closure. Procedia Engineering, 2, 1005–1014.
17 de Matos, P. F. P. and Nowell, D. (2008) Numerical simulation of plasticity induced fatigue crack closure with emphasis on the crack growth scheme: 2D and 3D analyses. Engineering Fracture Mechanics, (75), 2087–2114.
18 Andersson, M., Persson, C. and Melin, S. (2006) Experimental and numerical investigation of crack closure measurements with electrical potential drop technique. International Journal of Fatigue, 28, 1059–1068.
19 David, T. (1992) The definition and measurement of crack closure. Engineering Fracture Mechanics, 43, 109–115.
20 Shaw, D. and May, I. (1979) Crack closure during fatigue crack propagation, ASTM STP34916S, 233–241.
21 Clark, C. K. and Cassatt, G. C. (1977) A study of fatigue crack closure using electric potential and compliance techniques. Engineering Fracture Mechanics, 9, 671–688.
22 Schijve, J. Fatigue crack closure: observation and technical sig-nificance, ASTM – STP 982; 5–34.
23 Josefson, B. L., Svensson, T., Ringgsberg, J. W., Gustafsson, T. and De Mare, J. (2000) Fatigue life and crack closure in
specimens subjected to variable amplitude loads under plain strain conditions. Engineering fracture mechanics, 66, 587–600. 24 James, M. N. (1997) Some unresolved issues with fatigue crack
closure measurement, mechanism and interpretation problems, advances in fracture research. Proceedings of the Ninth Interna-tional Conference on Fracture, Sydney, (eds. B. L. Karihaloo et al), Australia, April 1997, Pergamon Press, 5, 2403–2414, ISBN 008 042820 7.
25 Macha, D. E., Corby, D. M., Jones, J. W. (1979) On the variation of fatigue crack-opening load with measurement location, Proc Soc Exp Stress Analysis 36, 207–213.
26 Shin, C. S., Smith, R. A. (1985) Fatigue crack growth from sharp notches. International Journal of Fatigue 7, 87–93.
27 Rice, J. R. (1968) A path independent integral and the approxi-mate analysis of strain concentration by notches and cracks. Journal of applied mechanics, 35, 379–386.
28 Shih, C. F. (1981) Relationship between the J-integral and the crack opening displacement for stationary and extending cracks. J. Mech. Phys. Solids, 29, 305–326.
29 Dowling, N. E. and Begley, J. A. (1976) Fatigue Crack Growth During Gross Plasticity and the J-integral in Mechanics of Crack Growth, STP 590, ASTM, Philadelphia, 82–102. 30 Carroll, J., Efstathiou, C., Lambros, J., Sehitoglu, H., Hauber,
B., Spottswood, S. and Chona, R. (2009) Investigation of fatigue crack closure using multiscale image correlation experiments. Engineering Fracture Mechanics, 76, 2384–2398.
31 Nowell, D., Kartal, M. E. and DE Matos P. F. P. (2013) Digital image correlation measurement of near-tip fatigue crack displacement fields: constant amplitude loading and load history effects. Fatigue Fract Engng Mater Struct, 36, 3–13.
32 Carrol, J. D., Abuzaid, W., Lambros, J. and Sehitoglu, H. (2013) High resolution digital image correlation measurements of strain accumulation in fatigue crack growth. International Journal of Fatigue, 57, 140–150.
33 Sutton, M. A., Zhao, W., McNeill, S. R., Helm, J. D., Piascik, R. S. and Riddell, W. T. (1999) Local crack closure measurement: development of a measurement system using computer vision and a far-field microscope, ASTM - STP, 145–156.
34 Dawicke, D. S. and Sutton, M. A. (1994) CTOA and crack-tunneling measurements in thin sheet 2024-T3 aluminum alloy. Exp. Mech., 34(4), 357–368
35 Yusof, F. and Withers, P. J. (2009) Real-time acquisition of fatigue crack images for monitoring crack-tip stress intensity variations within fatigue cycles. J. Strain Anal. Eng. Des., 44(2), 149–158.
36 López-Crespo, P., Shterenlikht, A., Patterson, E. A., Withers, P. J. and Yates, J. R. (2008) The stress intensity of mixed mode cracks determined by digital image correlation. J. Strain Anal., 43, 769–780.
37 Roux, S. and Hild, F. (2006) Stress intensity factor measure-ments from digital image correlation: post processing and integrated approach. Int. J. Fract., 140, 141–157.
38 Becker, T. H., Mostafavi, M., Tait, R. B. and Marrow, T. J. (2012) An approach to calculate the J-integral by digital image correlation displacement field measurement. Fatigue Fract. Eng. Mater. Struct., 35, 971–984.
39 Ould, C. B., Imad A. and Benguediab, M. Influence of the cyclic plastic zone size on the propagation of the fatigue crack in case of 12NC6 steel. Comput. Mater. Sci., 43(2008), 1010–1017. 40 Vic-2D reference Manuel, correlated solution (2009). 41 Mostafavi, M. and Marrow T. J. (2011) In situ observation of
crack nuclei in poly-granular graphite under ring-on-ring equi-biaxial and flexural loading. Eng. Fract. Mech., 78(8), 1756–1770.
42 Sutton, M. A., Yan, J. H., Tiwari, V., Schreier, H. W. and Orteu, J. J. (2008) The effect of out-of-plane motion on 2D and 3D digital image correlation measurements. Opt. Lasers Eng., 46, 746–757.
43 Baccar, M., Shah, M., Velay, V., Mabru, C. and Rézaï-Aria, F. (2012) Analysis of crack propagation and crack tip opening displacements by measurements 2-D digital image correlation in a hot working tool steel. In proceed-ings of the 9th international tooling conference 2012, leoben.
44 Shah, M., Mabru, C. and Rézaï-Aria, F. (2010) Investigation of crack propagation in X38CrMoV5 (AISI H11) tool steel at ele-vated temperatures. Procedia Eng., 2, 2045–2054.
45 El-Shabasy, A. B. and Lewandowski, J. J. (2004) Effects of load ratio, R, and test temperature on fatigue crack growth of fully pearlitic eutectoid steel (fatigue crack growth of pearlitic steel). Int. J. Fatigue, 26, 305–309.
46 Ding, J., Hall, R. and Byrn, J. (2005) Effects of stress ratio and temperature on fatigue crack growth in a Ti-6Al-4V alloy. Int. J. Fatigue 27, 1551–1558.
47 Pelloux, R. M. N. (1969) Mechanisms of formation of ductile fatigue striations. Trans ASM, 62, 281–285.
48 Neumann, P. (1969) Coarse slip model in fatigue. Acta Metall., 17, 1219–1225.
49 Chow, C. L. and Lu T. J. (1991) Cyclic J-integral in relation to fatigue crack initiation and propagation. Eng. Fract. Mech., 39(1), 1–20.
50 Ktari, A., Haddar, N., Köster, A. and Marie-Louise Toure, A. (2011) Numerical computation of thermal fatigue crack growth of cast iron. Fatigue Fract. Eng. Mater. Struct., 34, 498–509. 51 Gasiak, G. and Rozumek, D. (2004). ΔJ-integral range
estima-tion for fatigue crack growth rate descripestima-tion. Int. J. Fatigue, 26, 135–140.
52 Banks-Sills, L. and Volpert, Y. (1991) Application of cyclic J-integral to fatigue crack propagation of Al 2024-T351. Eng. Fract. Mech., 40(2), 355–370.
53 Chow, C. L. and Lu, T. J. (1989) On the cyclic J-integral applied to fatigue cracking. Int. J. Fract., 40, 53–59.
54 Hutchinson, J. W. (1968) Plastic stress and strain fields at crack tip. J. Mech. Phys. Solids, 16, 337–342.
55 Tracey, D. M. (1976) Finite element solutions for crack-tip behav-ior in small-scale yielding. (American Society of Mechanical Engi-neers), ASME, Trans., Ser. H-J. Eng. Mater. Technol., 98, 146–151. 56 McMeeking, R. M. (1977) Finite deformation analysis of crack-tip opening in elastic–plastic materials and implications for frac-ture. J. Mech. Phys. Solids, 25(5), 357–381.
57 McClintock, F. A. (1971) Plasticity aspects of fracture. Fract. adv. treatise, 3, 47–225.
58 Rice, J. and Rosengren, G. F. (1968) Plane strain deformation near a crack tip in a power-law hardening material. J. Mech. Phys. Solids, 16, 1–12.
59 Shah, M. (2010) Investigation of crack propagation in X38CrMoV5 tool steel at room temperature and 600 °C on small scale specimens. PhD thesis, Ecole des Mines d’Albi (France).