HAL Id: hal-00800488
https://hal.archives-ouvertes.fr/hal-00800488
Submitted on 18 Mar 2013
Demonstration Of A Monitoring Lamp To Visualize The
Energy Consumption In Houses
Christophe Gisler, Grazia Barchi, Gérôme Bovet, Elena Mugellini, Jean
Hennebert
To cite this version:
Christophe Gisler, Grazia Barchi, Gérôme Bovet, Elena Mugellini, Jean Hennebert. Demonstration
Of A Monitoring Lamp To Visualize The Energy Consumption In Houses. The 10th International
Conference on Pervasive Computing (Pervasive2012), Jun 2012, United Kingdom. �hal-00800488�
Visualize The Energy Consumption In Houses
Christophe Gisler1,2, Grazia Barchi1,3, G´erˆome Bovet1,
Elena Mugellini1,2
, and Jean Hennebert1,2
1
ICT Institute, HES-SO//Fribourg, Bd. de P´erolles 80, CH-1705 Fribourg
2
Dpt of Informatics, University of Fribourg, Bd. de P´erolles 90, CH-1700 Fribourg
3
Dpt of Electronic and Information Eng., University of Perugia Via G. Duranti 93, I-06125 Perugia, Italy
christophe.gisler@hefr.ch
http://www.eia-fr.ch, http://www.unifr.ch, http://www.unipg.it
Abstract. We report on the development of a wireless lamp dedicated to the feedback of energy consumption. The principle is to provide a simple and intuitive feedback to residents through color variations of the lamp depending on the amount of energy consumed in a house. Our system is demonstrated on the basis of inexpensive components piloted by a gateway storing and processing the energy data in a WoT framework. Different versions of the color choosing algorithm are also presented. Keywords: Web of Things, energy feedback, Green Computing
1
Introduction and motivations
Citizens are more and more sensitive to the environmental dimension linked to their behaviours. Beyond the current ecological trends, interests are also eco-nomical due to the raising prices of energy. It is reported in the literature that energy feedback is a good solution to make people gain awareness of their energy consumption and hence reduce it [1]. An efficient feedback should be grounded in real consumption, provided with a short delay and include opportunities for historical and/or social comparison [2]. Unfortunately, nowadays the unique feed-back that most of the people have is their monthly electricity bill, which provides few information to interpret the sources of consumption. Automated monitoring of the electricity consumption in a house is quite a recent topic. The planned introduction of smart meters in our homes and the availability of plug-based en-ergy monitoring devices are pushing in this direction. Recent publications in the domain report on several mobile and web-based energy monitoring systems [3, 4]. The major disadvantages of such kinds of systems are a strong dependence to web connections and an active user implication in order to use them.
We describe here a simple and intuitive system able to give feedbacks on energy consumption in habitations. The system is based on a wireless Energy
Monitory Lamp that provides visual feedback to residents through variations of
2 Energy Monitoring Lamp
in the house allowing the residents to immediately adapt their use of appliances in order to save energy and money. There are various kinds of feedbacks. Our approach belongs to the class of ambient feedbacks which rely on pre-attentive processing of information (i.e. the human ability to process rich information without cognitive effort). Such devices do not show text or numbers, but simply alert residents that something relevant to their electricity consumption is chang-ing. Our proposal is actually very similar to the commercial device Orb which changes colour according to the current price of electricity [5]. We differentiate ourselves by documenting different versions of the algorithms to chose the color of the lamp and by using open and inexpensive electronic components piloted by a gateway storing and processing the energy data in a Web of Things framework.
2
System description
2.1 Architecture
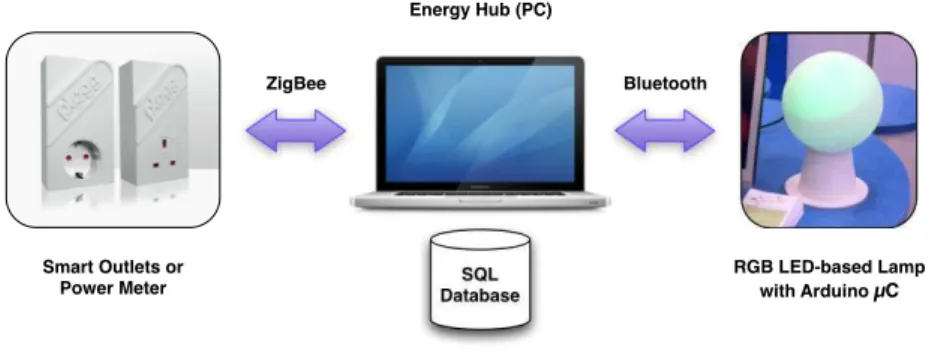
Our system is actually composed of three communicating parts (see Figure 1): an RGB LED-based lamp, a small-footprint gateway for the acquisition and processing of the data and smart outlets measuring the electricity consumed by various appliances in a building.
!"# $%&%'%() !*%+&,-.&/)&(,0+ 102)+,3)&)+ 456,#7$8'%()9,#%*: 2;&<,=+9.;>0,?@ 7>)+AB,C.',D1@E F;A6)) 6/.)&00&<
Fig. 1.Schema of the system
RGB LED-based lamp. The lamp is controlled by an Arduino micro-controller which is an open-source electronics prototyping platform. Such a card can receive inputs from various sensors and is usually used to control lights, mo-tors and actuamo-tors. It can also store information into a small EEPROM mem-ory. The Arduino technology simplifies the process of working with a micro-controller and presents some advantages, as it is cheap, multi-platform, exten-sible, in an open software and hardware paradigm. Its hardware is based on Atmel’s A TMEGA8 and A TMEGA168 micro-controllers. Among the available model cards, we chose the ArduinoBT which has an integrated Bluetooth mod-ule. The second electronic part of the lamp is a set of four RBG LEDs. For the
micro-controller to handle the RGB LEDs and make them show suitable color transitions and intensity variations, we used a Pulse Width Modulation (PWM) technique.
Smart gateway. The lamp communicates via Bluetooth with a small foot-print PC called Energy Hub. This energy hub acts as a smart gateway between the lamp and the sensors by getting the consumption data from the sensors, storing them into a MySQL database. The hub is implemented using an open-source platform called Watt-ICT that offers a WoT access to different brands of smart outlets and building sensors/actuators (http://wattict.com/).
Smart outlets. As sensors, we used PLOGGs smart outlets that transmit the measured electric consumption values to the energy hub via the Zigbee wire-less protocol (http://www.plogg.co.uk).
2.2 Algorithms
Our objective here is to find a mathematical function for mapping the electricity consumption at an instant t to a convenient color between green and red which intuitively represents a low and high consumption. Consumption levels are con-text dependent, i.e. what is high for a household may be low for another one. For this reason, two approaches can be followed. The first approach, that we named intrinsic, only relies on internal measurements coming from the installed system. The second one, that we named extrinsic, uses external data such as the number of residents, the type of building, the current weather or national statistics about consumption. The best way to proceed is probably the combi-nation of both approaches. In this paper and as initial work, we chose to focus on intrinsic approaches in order to have a functional autonomous system. Two algorithms have been implemented.
The first algorithm is based on the momentary power consumption P (t) com-puted as the average of the instantaneous consumption over a sliding window. The length ∆t of the window is user settable with a reasonable default equals to 30 seconds. The momentary power P (t) is then compared to the min and max values that are set either automatically from measured extrema or manually by the user. The output color for P (t) is chosen relatively to these extrema. Figure 2 illustrates the concept.
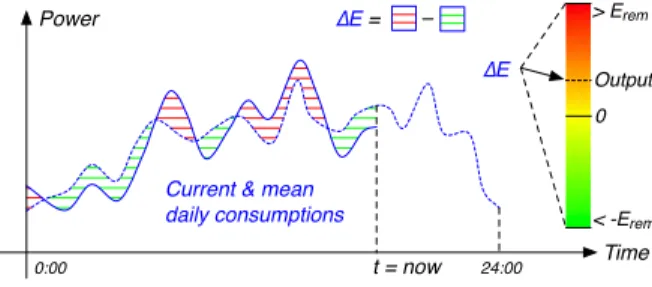
The second algorithm is based on the accumulated daily energy consumed
E(t) until time t and compared to the previous average ¯E(t) over the last n days.
The difference ∆E(t) = E(t) − ¯E(t) is then computed and if ∆E(t) = 0, we can
assume that the energy consumed is stable, leading to a neutral lamp color, i.e. yellow as the mean between green and red in the HSV scale. We then compare
∆E to Erem(t) = ¯Etot− E(t), the remaining energy quota to reach the total
daily average energy ¯Etot. If ∆E ≥ Erem(t), then the energy consumed until the
current time t has already exceeded what was observed during the previous days
and the lamp color is red. If ∆E ≤ −Erem(t), then we can expect that we will
reach a lower consumption in comparison to the other days, leading to a green color of the lamp. Figure 3 illustrates this concept.
4 Energy Monitoring Lamp !"#"$%& !'(! )*+, -%&,. /0!10! 2013 4$53 6,7$ (! 80..,$!"97*:; <%$=0+1!*%$ >?@AA A@AA
Fig. 2.Feedback algorithm 1 - Ouput color computed from current momentary con-sumption !"#$ %&'$( )*+*,&' -.)/.) 0*1!"# 2*31!"# 41 41*+ 5 6.(($,)*7*#$8, 98":;*<&,=.#/)"&,= >?@55 5@55
Fig. 3.Algorithm 2 based on the difference between current and mean consumptions
3
Conclusion
The purpose of the energy monitoring lamp presented in this paper is to pro-vide users with an intuitive and ambient feedback about their current energy consumption. We detailed the three components of the system, namely an RGB LED-based lamp piloted by an Arduino microcontroller, an energy hub process-ing data and smart sensors measurprocess-ing the electricity consumption. We presented two algorithms used to model the household energy consumption and make the lamp color vary from green to red accordingly.
References
1. S. Darby, The Effectiveness Of Feedback On Energy Consumption - A review for DEFRA of the literature on metering, billing, and direct displays, Environmental Change Institute, University Of Oxford, April 2006
2. C. Fischer, Feedback on household electricity consumption: a tool for saving energy?, Energy Efficiency, Springer Science + Business Media B.V., 2008
3. M. Weiss, eMeter : An interactive energy monitor, Higher Education, 2009, pp. 3-4 4. D. Guinard, M. Weiss, and V. Trifa, Are you Energy-Efficient : Sense it on the
Web!, International Journal, pp. 3-6
5. M. S. Martinez and C. R. Geltz, Utilizing a pre-attentive technology for modifying customer energy usage, Proc. EU Council for an Energy-Efficient Economy, 2005