DOCTORAT DE L'UNIVERSITÉ DE TOULOUSE
Délivré par :Institut National Polytechnique de Toulouse (Toulouse INP) Discipline ou spécialité :
Génie des Procédés et de l'Environnement
Présentée et soutenue par :
Mme NICOLE VORHAUER le mardi 18 septembre 2018Titre :
Unité de recherche : Ecole doctorale :
Experiment based development of a non-isothermal pore network model
with secondary capillary invasion
Mécanique, Energétique, Génie civil, Procédés (MEGeP)
Institut de Mécanique des Fluides de Toulouse (I.M.F.T.) Directeur(s) de Thèse :
M. MARC PRAT M. EVANGELOS TSOTSAS
Rapporteurs :
M. ANDREAS BUCK, UNIVERSITE D'ERLANGEN-NUREMBERG M. FABRICE GOLFIER, UNIVERSITÉ LORRAINE
Membre(s) du jury :
Mme FRANZISKA SCHEFFLER, UNIVERSITE OTTO VON GUERICKE MAGDEBURG, Président M. EVANGELOS TSOTSAS, UNIVERSITE OTTO VON GUERICKE MAGDEBURG, Membre
M. MARC PRAT, CNRS TOULOUSE, Membre
Mme PETRA FORST, TECHNISCHE UNIVERSITAT MUNICH, Membre
Declaration
I hereby declare that I prepared the work submitted without inadmissible assistance and without the use of any aids other than those indicated. Facts or ideas taken from other sources, either directly or indirectly have been marked as such.
In particular, I did not use the services of a commercial graduation consultation. Further I have not made payments to third parties either directly or indirectly for any work connected with the contents of the submitted dissertation. The work has not been submitted as a dissertation either in Germany or abroad in the same or similar form and has also not been published as a whole. Magdeburg, June 19, 2018 Nicole Vorhauer
i
Acknowledgements
First of all, I would like to express my deepest gratitude for Dr.-Ing. habil. Thomas Metzger, Dr. Marc Prat and Prof. Dr.-Ing. habil. Evangelos Tsotsas, for their guidance, advice and inspiration. It was and still is a great privilege to work with you, which I appreciate more than you might imagine.
Dear Thomas, thank you for your trust in me, when you offered me to work in the pore network group in Magdeburg and thank you for the uncomplicated and very efficient teamwork. You helped me to get started with pore network modeling and also allowed me to change my direction more towards experimental investigations after we had realized the importance of the validation of the pore network models before continuing to work on parameterization of macroscopic models.
Dear Marc, thank you for giving me the chance to work with one of the greatest experts in pore network modeling. Thank you for taking your time for (sometimes very long) discussions and for sharing your insider knowledge with me. The research stays in Toulouse were always a boost for my work and of course a lot of fun. I hope that we can continue our collaboration in future.
Dear Prof. Tsotsas, thank you for your support, for your clear advices and for giving me the freedom to follow my own ideas. You forced me to try more than my best: ‘You're still young, that's your fault. There's so much you have to know.’ (to cite Cat Stevens). During the years under your supervision I learned many practical things, which will be useful for a lifetime. I wish that I could pay back some of the things.
I would like to thank everybody who helped me to build the experimental set-up: Manuel Marcoux for giving me an insight into the experimental work in Toulouse, Marc-Peter Schmidt for producing the very accurate microfluidic pore network, Diethard Kürschner for being readily available in the lab and helping me to build up experimental set-ups and the people from the workshop of our institute, namely Ernst-Albert Gehrke, Hans-Jürgen Ritzmann, Mike Rusche and Dirk Blanke for their ideas and very precise work.
ii
very good friends, especially Lothar Mörl, Nicolle Degen, Andreas Bück, Fabian Weigler, Antje Rossau/Stresing, Thi Thu Hang Tran, Muhammad Usman Farid and many more.
I would like to thank the students who did their research work under my supervision and who contributed in discussions and forced me to recapitulate my ideas and concepts with different perspectives: Quoc Tiep Tran, Nguyen Xuan Duong, Yasen Trayanov, Jeanine Benecke, Sebastian Graner, Adnan Shabbir Najmi, Pan Yue, Shuai Huang, Sheshadri Eswar Iyer, Unaiz Ahmed Khan, Faeez Ahmad, Bilal Zulfiqar, Niloofar Mirsadraee, Christin Velten, Markus Vondran, Debraj Ghosh, Aiham Adi, Alaa Zwaid.
I would like to thank Benoît Fond for helping me with the translation of the abstract into French.
Last but not least, I would like to thank my beloved family, Nico, Mathilda and Julius, who
forced me to find a very efficient work-life-balance and who gave me the freedom to study, travel and work late or on weekends. Thank you Opa, for putting pressure on me. You and Oma always gave me the feeling that nothing else matters but family and that every little thing that we can achieve apart from this must be done with love and passion. I also thank my very good friends for keeping in contact, although I did not very often take the time, Maria Schmidt, Daniela Adolf, Anika Schlünz, Wiebke Süthoff and Katrin Zscheppang.
iii
Prolegomenon
This PhD thesis was written in the frame of a cotutelle de thése in cooperation of the Otto-von-Guericke University Magdeburg and the Institut National Polytechnique de Toulouse, starting in November 2010. The presented experimental and simulation results were obtained by studies at both institutes. Structure and contents of this PhD thesis are based on the standards of the two institutes.
The main objective of this work is the experiment based development of a pore network model for drying in presence of imposed thermal gradients. This problem did arise from the study and development of macroscopic drying models based on parameter extraction from pore network simulation. It was one of the main questions, if the pore network models applied for estimation of effective parameters used in macroscopic continuum models, can realistically reproduce the drying behavior of microfluidic pore networks. This central question initiated the development of a quasi 2-dimensional microfluidic pore network and experimental set-up with which the mathematical pore network model could be validated. The presentation and discussion of this work is one of the main parts of this thesis. It shows that drying of the microfluidic pore network, although seemingly simple in structure, is influenced by several pore scale processes which occur simultaneously, overlap or counteract each other. The capillary film effect is highlighted as one prominent example, where the governing pore scale effects are usually overseen with macroscopic continuum models. It is shown and discussed that the consideration of structural peculiarities can lead to a significantly better agreement of the overall comparison of simulations and experiments. In addition to that, the situation drastically changes if temperature gradients are imposed on the pore network. Exemplarily, vapor can diffuse through partially liquid saturated zones and lead to the re-saturation of the pore network. Consideration of this effect in the pore network model leads to the disclosure of the dependency of liquid phase distribution and drying performance on the interrelation of thermal gradient, pore size distribution and overall drying rate in presence of liquid films which are usually also anticipated in drying of porous media.
Abstract
Drying of capillary porous media is a process of gradual receding of the liquid phase inside the porous medium and simultaneous invasion of the void space with gas. The phase patterns that evolve during the drying process depend on the capillary number, Bond number as well as the temperature profile along the porous medium. If the drying process is slow and capillarity controlled, invasion of the pore space by the gas phase can be assumed as quasi‐steady. The evolving distributions of gas and liquid phase resemble invasion percolation patterns, with penetrating gas branches and numerous disconnected liquid clusters. Understandably, the discrete pore‐level events that can lead to such ramified phase distributions cannot be captured by macroscopic continuum models that average the volume elements of the porous medium. Instead, due to the conformity of drying and invasion percolation patterns, pore network models (PNMs) are applied to model capillarity driven drying of porous media. PNMs are discrete mathematical models that originate from hydrology and the oil‐recovery related research. In this, the void space of the porous medium is represented by a network of interconnected pores and pore throats. Liquid and gas phase mass transfer equations are expressed in each pore throat and the boundary conditions are given by the state of neighboring pores. Consequently, the number of mass balances to be solved is consistent with the number of pores inside the pore network (PN), usually restricting the computable size of PNs. Current studies cover a wide range of drying processes from drying of inorganic matrices to drying of biological materials, from drying regular 2‐dimensional PNs to drying of irregular particle packings, from removal of non‐ viscous liquid to salt solutions and particle suspensions, i.a.; further application of PN modelling aims at the estimation of parameters to be used in continuous drying models. Common strength of all PNMs is the discrete character which allows study of temporally and spatially discretized pore‐level phenomena, such as the simultaneous evaporation and condensation, local structure of liquid films or crystallization. This is useful for the investigation of the relation between pore level events and macroscopic drying behavior.
conditions with the aim to identify governing physical pore scale effects. Gravity and viscous effects are disregarded in this thesis. Instead drying with slight local temperature variation and drying with imposed thermal gradients are studied. Based on this investigation, a powerful non‐isothermal PNM is developed. This model incorporates i) the phenomena associated with the temperature dependency of pore scale invasion, namely thermally affected capillary invasion and vapor flow as well as ii) the secondary effects induced by wetting liquid films of different morphology.
This study clearly evidences that the macroscopic drying behavior is fundamentally dictated by the temperature gradient imposed on the PN and moreover by the secondary capillary invasion as well. In agreement with literature, invasion patterns as in invasion percolation with progressive evaporation of single clusters are observed in drying with negligible local temperature variation; gradients with temperature decreasing from the surface (negative temperature gradient) can stabilize the drying front, evolving between the invading gas phase and the receding liquid phase, whereas temperature increasing from the surface (positive temperature gradient) leads to destabilization of the liquid phase with early breakthrough of a gas branch and initiation of a second invasion front migrating in opposite direction to the evaporation front receding from the open surface of the PN. Special attention is paid on the distinct drying regimes found in the situation of a positive gradient because they are associated with different pore scale invasion processes. More precisely, temperature dependency of surface tension dictates the order of invasion as long as the liquid phase is connected in a main liquid cluster (usually found during the first period of drying). In contrast to this, detailed study of the vapor transfer mechanisms emphasizes that vapor diffusion through the partially saturated region can control the pore level distributions of liquid and gas phase during the period of drying when the liquid phase is disconnected into small clusters. This is also related to the cluster growth induced by partial condensation of vapor. It is shown and discussed in detail in this thesis that this effect not only depends on direction and height of the temperature gradient for a given pore size distribution but that moreover the overall evaporation rate influences the cluster growth mechanism. This indicates that liquid migration during drying of porous media might be controlled by the interplay of thermal gradients and drying rate.
In summary, the study of thermally affected drying of the 2‐dimensional PN reveals complex pore scale mechanisms, usually also expected in drying of real porous media. This leads to the development of a strong mathematical pore scale model based on experimental findings. It is demonstrated how this model might be applied to understand and develop modern drying processes based on the simulation of thermally affected pore scale mass
Kurzzusammenfassung
Die Trocknung von kapillarporösen Medien kann als Prozess des sukzessiven Zurückweichens der Flüssigphase und des gleichzeitigen Eindringens der Gasphase in den Porenhohlraum beschrieben werden. Die Phasenverteilungen, welche sich während dieses Prozesses ergeben, werden von der Kapillarzahl, der Bond‐Zahl sowie der Temperaturverteilung innerhalb des porösen Mediums diktiert. Wenn der Trocknungsprozess langsam und kapillarkontrolliert stattfindet, kann das Eindringen der Gasphase in den Porenraum als quasistationär angenommen werden. Die entstehenden Phasenverteilungen sind mit der Perkolationstheorie beschreibbar. Sie sind charakterisiert durch vordringende Gaszweige und zahlreiche voneinander getrennt vorliegende Flüssigkeitscluster. Diese charakteristischen Flüssigkeitsmuster als auch die porenskaligen Effekte, welche zu diesen Mustern führen, sind nicht mit makroskopischen Kontinuumsmodellen vorhersagbar, da sie die Eigenschaften des porösen Mediums über Volumenelemente mitteln. Anstelle dessen werden auf Grund der Konformität der Flüssigkeitsmuster der Trocknung und der Perkolationstheorie Porennetzwerkmodelle (PNM) für die Modellierung kapillarkontrollierter Trocknung poröser Medien angewendet. PNM sind diskrete mathematische Modelle, die ihren Ursprung in der Hydrologie und der Forschung in Bezug auf die Erdölgewinnung haben. In diesen Modellen wird der Porenhohlraum durch ein Netzwerk von miteinander verbundenen Poren und Porenhälsen (engl. Throats) repräsentiert. Die Transportgleichungen für Flüssigkeit und Gasphase werden den Porenhälsen zugewiesen, während die Poren die Informationen zu den Randbedingungen des Stofftransportes enthalten. Daraus folgt, dass die Anzahl der zu lösenden Bilanzgleichungen direkt von der Anzahl der Poren abhängt. In aktuellen Studien werden PNM für die Untersuchung der Trocknung einer Vielzahl von unterschiedlichen Materialien, Flüssigkeiten und Trocknungsbedingungen angewendet; zum Beispiel für die Trocknung von anorganischen Matrizen, biologischen Materialien, regulären 2‐dimensionalen Netzwerken, unregelmäßigen Partikelschüttungen, nicht‐viskosen Flüssigkeiten sowie Salzlösungen, Suspensionen, usw. In weiteren Studien werden PNM für die Bestimmung effektiver Parameter, welche in Kontinuumsmodellen Anwendung finden sollen, verwendet. Die
Ereignisse, wie beispielsweise die gleichzeitige Verdunstung und Kondensation, lokale Strukturen von Flüssigkeitsfilmen oder Kristallisation. Dies ist nützlich in Bezug auf die Untersuchung des Zusammenhangs zwischen diskreten porenskaligen Ereignissen und dem makroskopisch zu beobachtenden Trocknungsverhalten.
In der vorliegenden Arbeit wird die Trocknung eines repräsentativen 2‐dimensionalen mikrofluidischen Porennetzwerks (PNs) in SiO2 unter verschiedenen aufgeprägten thermischen Bedingungen mit dem Ziel untersucht, die treibenden Effekte der Trocknung zu ermitteln und darauf basierend ein leistungsfähiges PNM zu entwickeln. Für die Simulation werden die experimentell bestimmten Temperaturprofile berücksichtigt, jedoch Gravitations‐ und Reibungseffekte vernachlässigt. Das neue PNM berücksichtigt i) die thermisch beeinflussten Mechanismen während der Entleerung des PNs als auch ii) den Einfluss benetzender Flüssigkeitsfilme mit unterschiedlichen Strukturen.
Diese Arbeit zeigt deutlich den Einfluss aufgeprägter Temperaturgradienten sowie sekundärer Mechanismen auf das makroskopisch beobachtbare Trocknungsverhalten: bei vernachlässigbaren örtlichen Temperaturänderungen entsprechen die Phasenverteilungen den in der Literatur als ‚Invasion Percolation Patterns mit progressiver Verdunstung von Einzelclustern‘ beschriebenen Verteilungen; aufgeprägte Temperaturgradienten hingegen verändern die Flüssigkeitsmuster grundlegend. Die Trocknungsfront, welche sich zwischen der eindringenden Gasphase und der zurückweichenden Flüssigkeit herausbildet, wird stabilisiert, wenn die Temperatur von der Oberfläche ausgehend abnimmt (negativer Temperaturgradient). Der entgegengesetzte Temperaturgradient (positiver Temperaturgradient) löst jedoch die Destabilisierung der Trocknungsfront aus. Diese ist gekennzeichnet durch den frühen Durchbruch eines Gaszweigs und der Initiierung einer zweiten Trocknungsfront, welche der ursprünglichen Front entgegenläuft. Diese beiden Phasen der Trocknung (mit positivem Gradienten) können unterschiedlichen porenskaligen Effekten zugeschrieben werden: während der ersten Trocknungsperiode bestimmt die Temperaturabhängigkeit der Oberflächenspannung die Reihenfolge der Entleerung solange die Flüssigphase in einem Hauptcluster verbunden ist, während der späteren
Trocknungsperiode bestimmt jedoch die Dampfdiffusion durch das entstehende 2‐Phasengebiet die Verteilung der Flüssigkeit auf der Porenebene. Letzteres kann zu
Kondensation und einem Clusterwachstum führen. Es wird in der vorliegenden Arbeit gezeigt und diskutiert, dass dieser Effekt bei gegebener Porenradienverteilung nicht allein von der Richtung und der Höhe des Temperaturgradienten abhängt, sondern dass das Clusterwachstum auch von der Trocknungsgeschwindigkeit beeinflusst wird. Hieraus kann geschlussfolgert werden, dass die Flüssigkeitsverteilung während der Trocknung durch Kombination von geeigneten Temperaturgradienten und Trocknungsgeschwindigkeiten kontrolliert werden kann.
Zusammenfassend, zeigt diese Studie der thermisch beeinflussten Trocknung eines 2‐dimensionalen PNs komplexe porenskalige Mechanismen auf, welche auch unter realen
Trocknungsbedingungen von realen porösen Medien erwartet werden können. In der Konsequenz wird, basierend auf den experimentellen Ergebnissen, ein leistungsfähiges mathematisches Porenskalenmodell für die Simulation von thermisch beeinflusstem Stofftransport entwickelt und es wird gezeigt, wie dieses Modell angewendet werden kann
Résumé de la thèse
Le séchage de milieux poreux capillaires est un processus de recul progressif de la phase liquide dans le milieu poreux et l’invasion simultanée de l’espace vide par le gaz. Les schémas de phases qui évoluent pendant le processus de séchage dépendent du nombre capillaire, du nombre de Bond, ainsi que du profil de température le long du milieu poreux. Si le processus est long, et contrôlé par la capillarité, l’invasion de l´espace à l’intérieur des pores par la phase gazeuse, peut être considéré comme quasi‐stationnaire. L´évolution des distributions de la phase gazeuse et de la phase solide ressemble aux schémas que l’on trouve dans l’invasion percolatrice avec des branches de phase gazeuse qui pénètrent dans le milieu, et de nombreuses poches de liquides déconnectées les unes des autres. Il est évident que les évènements discrets au niveau des pores qui aboutissent à de telles distributions de phase ramifiées ne peuvent pas être capturés par des modèle macroscopiques de continuum qui font la moyenne des éléments volumiques du milieu poreux. À la place, du fait de la similitude entre les schémas de séchage et de ceux de l´invasion percolatrice, des modelés de réseaux de pores (Pore network models ou PNMs en anglais) sont utilisés pour modéliser le séchage par capillarité des milieux poreux. Les PNMs sont des modèles mathématiques discrets qui proviennent de l`hydrologie, et de la recherche liée à la récupération de pétrole. Dans ces modèles, l´espace vide dans le milieu poreux est représenté par un réseau de pores interconnectées et de tuyères. Les équations de transfert de masse de la phase liquide et de la phase gazeuse sont exprimées dans chaque tuyères et les conditions limites sont données par l´état des pores avoisinantes. En conséquence, le nombre de bilans de masse à résoudre est lié au nombre de pores dans le réseau de pores (PN pour pore network). Les études récentes couvrent une large gamme de procédés de séchage allant des matières inorganiques aux matières biologiques, des réseaux réguliers en deux dimensions, aux séchage d´assemblages de particules irrégulières, de l´élimination de liquide non‐visqueux à des sels en solution et des particules en suspensions, i.a. ; l´ autre application de la modélisation PN est dans l´estimation de paramètres à utiliser dans les modèles de séchage continus. Le point fort que tous les modèles PNMs partagent est leur caractère discret qui permet d´étudier des phénomènes temporellement ou
entre événements à l´échelle des pores, et le comportement de séchage à l´échelle macroscopique.
Dans cette thèse, des simulations PN de séchage sont comparées à des données expérimentales obtenues dans le séchage d´un réseau de micro‐fluidique 2D représentatif dans du SiO2 soumis à des conditions thermiques variables dans le but d’identifier les phénomènes physiques à l´échelle des pores qui sont les plus influents. A partir de cette étude, un PN efficace non‐isotherme est développé. Ce modèle incorpore i) les phénomènes associés à la dépendendence en température de l´invasion à l´échelle des pores, c´est à dire l´invasion capillaire sous effet thermique et le flux de vapeur ainsi que ii) le transport secondaire induit par d´épais films liquides observé dans les expériences de microfluidique.
Cette étude prouve clairement que le comportement macroscopique du séchage est fondamentalement dirigé par le gradient de température imposé sur le PN ainsi que par le transport capillaire secondaire. En accord avec la littérature, les schémas d´invasion que l´on trouve dans l´invasion percolatrice avec l´évaporation progressive d´amas individuels sont observés dans le séchage à variation de température locale négligeable; des gradients où la température diminue à partir de la surface (gradient de température négatif) peut stabiliser le front de séchage, qui évolue entre la phase gazeuse invasive et la phase liquide qui recule, alors qu´une température qui augmente à partir de la surface (gradient de température positif) amène à la déstabilisation de la phase liquide avec une percée prématurée de la branche gazeuse et l’initiation d´un deuxième front de séchage qui migre dans la direction opposé de celle du front de séchage original. Une attention particulière est prêtée aux régimes distincts que l´on trouve dans le second cas (gradient positif) parce qu´ils sont associés à différents procédés d´invasion à l´échelle des pores. Plus précisément, la dépendance en température de la tension de surface établit l´ordre d´invasion tant que la phase liquide est connectée au groupe liquide principal (que l´on trouve généralement pendant la première période de séchage). En revanche, l´étude détaillée des mécanismes de transfert de la vapeur met l´accent sur le fait que la diffusion de la vapeur à travers la région partiellement saturée peut contrôler les distributions des phases gazeuses et liquides à l´échelle des pores pendant la période de séchage lorsque la phase liquide est déconnectée en petits groupes. Cela est aussi lié à la croissance des amas induite par la condensation partielle de la vapeur. Cette thèse montre et discute en détail que cet effet ne dépend pas seulement de la direction et magnitude du gradient de température pour une distribution de tailles de pores donnée mais qu’en plus le taux d´évaporation influence le mécanisme de croissances des amas.
Cela indique que la migration du liquide pendant la phase de séchage de milieux poreux peut être contrôlé par l’interaction des gradients thermiques et du taux de séchage. En somme, l´étude du séchage sous effet thermique des réseaux de pores 2D révèle des phénomènes complexes à l´échelle des pores, généralement aussi anticipés dans le séchage des milieux poreux réels. Cela mène au développement d´un modèle mathématique efficace au niveau des pores basés sur des découvertes expérimentales. Cette thèse démontre la manière dont ce modèle peut être appliqué afin de comprendre et développer des procédés de séchage modernes basés sur la simulation du transfert de masse sous effet thermique à l´échelle des pores.
i iii iv vi viii x xiv
Contents
Acknowledgements Prolegomenon Abstract Kurzzusammenfassung Résumé de la these Contents Notation 1 Introduction 1 1 1.1 Motivation and scope of the thesis 1.2 Previous works 7 8 10 1.2.1 Pore network models of isothermal drying 1.2.2 Pore network models of non‐isothermal drying 1.2.3 Experimental evaluation of pore network models 15 20 1.3 Outline of the thesis 2 Fundamentals 21 21 2.1 Introduction 2.2 Percolation 22 22 23 2.2.1 Pore networks 2.2.2 Drainage and imbibition 2.2.3 Drying 25 2.3 Drying of porous media 27 27 29 2.3.1 Phase equilibrium 2.3.2 Vapor diffusion 2.3.3 Boundary layer 31evaporation 2.3.4.2 Refilling as a consequence of condensation 36 38 40 2.3.5 Liquid transport 2.3.6 Wetting liquid films 2.4 Temperature dependency of vapor diffusion and capillary invasion 42 2.4.1 Gas side 42 42 2.4.1.1 Saturation vapor pressure 2.4.1.2 Diffusion coefficient 43 2.4.2 Liquid side 44 44 45 2.4.2.1 Surface tension 2.4.2.2 Dynamic liquid viscosity and liquid density 2.5 Micro‐Macro coupling of non‐isothermal drying 46 46 47 48 49 2.5.1 Drying front structure 2.5.2 Drying curve and drying rate curve 2.5.3 Impact of liquid films 2.5.4 Impact of thermal gradients 2.5.5 Drying periods 51 3 Experimental Principles 53 53 3.1 Introduction 3.2 The microfluidic device 55 56 58 3.2.1 Production process 3.2.2 Limitations of the production process 3.2.3 Physical parameters of the microfluidic device 60 3.3 Experimental design and procedure 63 63 66 3.3.1 Experimental set‐up 3.3.2 Temperature gradients 3.3.3 Experimental procedure 67 3.4 Image processing of optical data 69 69 73 76 3.4.1 Computation of phase distributions 3.4.2 Remarks on the accuracy of image analysis 3.4.3 Computation of drying curves and drying rate curves 3.4.4 Estimation of characteristic parameters of the travelling 2‐phase zone 78 80 3.5 Summary 4 Drying experiments with the microfluidic pore network 82 82 4.1 Introduction 4.2 Pore scale analysis of pore network invasion 84 84 4.2.1 Primary invasion 4.2.2 Secondary invasion 86 87 89 4.2.2.1 Liquid film rings 4.2.2.2 Edge effect 4.3 Drying with spatially quasi‐constant temperature 90 90 4.3.1 Phase distributions 4.3.2 Drying curve and drying rate curve 93 95 4.3.3 Capillary number 4.4 Drying in presence of imposed thermal gradients 96 4.4.1 Drying with stabilizing thermal gradient 97
101 4.4.1.2 Drying curve and drying rate curve 4.4.2 Drying with destabilizing thermal gradient 103 104 110 4.4.2.1 Phase distributions 4.4.2.2 Variance of the travelling 2‐phase zone 4.4.2.3 Drying curve and drying rate curve 112 113 4.5 Summary and discussion 5 Experiment based development of the pore network model 115 5.1 Introduction 115 5.1.1 Non‐isothermal pore network model with secondary capillary invasion 116 118 5.1.2 Non‐isothermal pore network model with cluster growth mechanism 5.2 Pore network structure 119 121 122 122 124 5.2.1 Primary pore network structure 5.2.2 Secondary pore network structure 5.2.2.1 Capillary liquid rings 5.2.2.2 Edge effect 5.2.3 Structure of the computational boundary layer 125 126 5.2.4 Neighbor relations 5.3 Gas side moisture transfer 126 127 133 137 5.3.1 Vapor pressure field 5.3.2 Evaporation and condensation rates of pores and throats 5.3.3 Evaporation and condensation rates of liquid clusters 5.3.4 Overall evaporation rate from the pore network surface 137 5.4 Quasi‐steady invasion of the pore network 138 138 141 141 142 143 5.4.1 Invasion by the gas phase (evaporation) 5.4.2 Invasion by the liquid phase (condensation) 5.4.3 Cluster dynamics 5.4.3.1 Progressive invasion of evaporating liquid clusters 5.4.3.2 Cluster growth and cooperative invasion 5.4.4 Cluster labeling 145 145 145 5.4.4.1 Cluster labeling based on pore liquid saturation 5.4.4.2 Cluster labeling based on liquid rings 5.4.4.3 Cluster labeling in presence of cluster growth 146 148 150 5.5 Pore network drying algorithm incorporating capillary liquid rings 5.6 Pore network drying algorithm incorporating cluster growth 5.7 Summary 152 6 Experiment based evaluation of the pore network model 155 155 6.1 Introduction 6.2 Quasi‐isothermal drying 156 158 161 164 165 6.2.1 Estimation of the boundary layer thickness 6.2.2 Impact of liquid viscosity 6.2.3 Impact of competitive pore and throat invasion 6.2.4 Impact of local temperature variation 6.2.5 Impact of secondary capillary invasion 168 6.2.5.1 Lateral pinning of liquid 169 6.2.5.2 Simulation with the continuous liquid film pore network model 170
178 181 6.2.6.1 Phase distributions 6.2.6.2 Drying curves and drying rate curves 6.2.6.3 Structural analysis of pore scale liquid distribution 182 183 6.2.7 Summary 6.3 Drying with imposed thermal gradients 184 6.3.1 Pore network drying with stabilizing thermal gradient 184 187 188 192 6.3.1.1 Phase distributions 6.3.1.2 Drying curves and drying rate curves 6.3.1.3 Structural analysis of pore scale liquid distribution 6.3.1.4 Summary 193 195 6.3.2 The heat pipe effect 6.3.3 Pore network drying with destabilizing thermal gradient 198 199 201 202 203 6.3.3.1 Phase distributions 6.3.3.2 Drying curves and drying rate curves 6.3.3.3 Structural analysis of pore scale liquid distribution 6.3.3.4 Analysis of the impact of cluster labeling 6.3.3.5 Summary 210 211 212 6.4 Phase diagram of thermally affected drying 6.5 Comparison of pore network drying with different heating modes 6.6 Summary and discussion 214 7 Summary and Outlook 217 217 7.1 Summary 7.2 Outlook 220 222 References Appendix 232 A Experimental Data 232 232 233 240 A.1 Equipment A.2 Experiments with quasi‐constant temperature in time and space A.3 Experiments with a negative temperature gradient A.4 Experiments with a positive temperature gradient 247 B Pore network simulations 255 255 B.1 Study of the vapor transport equation and diffusion coefficient B.2 Study of the effect of capillary pore invasion during drying 257 B.3 Study of the condensation effect in a pore network with positive thermal gradient 262 B.4 Details of the continuous film pore network model with remarks on the 280 288 297 298 implementation C Summary of simulations Student theses List of publications Curriculum Vitae 300
xiv
Notation
a accuracy mm
A cross sectional area m2
A conductance matrix -
b vector of boundary conditions -
c0,1 binarization threshold -
ch scaling parameter for height -
cp heat capacity J kg-1 K-1
cw,h scaling parameter for width and height -
Ca capillary number -
D diffusion coefficient m2 s-1
ecl cluster size -
f red size reduction factor (edge effect) -
gv vapor conductance m s
g∞ vapor conductance in bulk air m s
h height m
h specific enthalpy J kg -1
I1,2,3 image matrices 1,2,3 -
k correction factor (continuous film model) -
K permeability m2
krel relative permeability -
lb coordinate of left boundary of PN (image processing) -
l label -
L length, lattice spacing m
Lair flow length of air m
LCa capillary length m
Ld network depth m
Lg gravitational length m
xv
M mass flow rate kg s-1
M vapor diffusion rate kg s-1
n number of PN columns -
n window size (in image processing) -
N number -
NS=0 number of empty pore neighbors -
N molar flow rate mol s-1
N molar vapor diffusion rate mol s-1
pnp matrix of pore neighbor relations -
pnr matrix of pore and ring neighbor relations -
pnt matrix of pore and throat neighbor relations -
P total pressure Pa
Pv vapor pressure Pa
Q heat flow rate J s-1
r radius m
rnp matrix of ring and pore neighbor relations -
rnr matrix of ring neighbor relations -
rnt matrix of ring and throat neighbor relations -
r0 radius of throat corner (film model) m
r1 radius of curvature 1 of a capillary m
r2 radius of curvature 2 of a capillary m
Re Reynolds number -
R universal gas constant J mol-1 K-1
sBL boundary layer thickness m
S saturation -
t time s
tnp matrix of throat and pore neighbor relations -
tnr matrix of throat and ring neighbor relations -
tnt matrix of throat neighbor relations -
tcomp computational time s
T temperature °C, K
Tglas glas transition temperature °C
TM temperature of fusion °C
ub coordinate of upper boundary of PN (image processing) -
v velocity m s-1
c
v+ ratio of condensed liquid volume -
c
v− neglected ratio of condensed liquid volume -
ve Abbe number -
V volume m3
V volume flow rate m3 s-1
l
V liquid molar volume m3 mol-1
w width m
Y mass loading of air -
xvi
Greek symbols
α
ratio of ring evaporation interface (ring model) -α
half angle of corner (film model) °l
α
coefficient of thermal expansion K-1β mass transfer coefficient m s-1
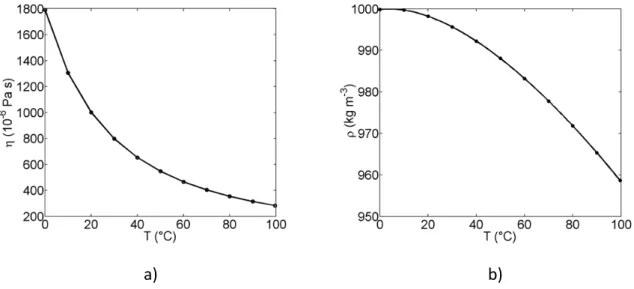
η dynamic liquid viscosity Pa s
θ
contact angle °,
1 2
ι frame index (image processing) -
λ
thermal conductivity W m-1K-1µ
chemical potential J mol-1ν
kinematic liquid viscosity m2 s-1ο
pre-factor defining vapor flow direction -ρ
density kg m-3 σ surface tension N m-1ϕ
relative humidity - Subscripts 0 initial 1-4 indices 2pz 2-phase zoneair air phase
back denotes the water flow through heat conducting plate
bottom bottom side of PN (in images)
BL boundary layer
c capillary
cl cluster
cond condensation
crit threshold value in image segmentation
crit1,2 threshold values in image segmentation
dew dew point
eff effective
edge denotes the PN side walls
evap evaporation
film liquid film
front drying front
g gas
high high (temperature side)
hor horizontal throats
H2O water i,j,k,l pore indices
ij,ik,kl throat indices
xvii
L liquid water from thermal baths
LAP least advanced point
m meniscus
mask photomask
MAP most advanced point
p pore
pix pixel
PN pore network
r ring
slice denotes a PN slice
si single (pore, throat)
steps invasion steps
Si silicon
SiO2 silicon dioxide
t throat
top top side of PN (in images)
tot total
v vapor
ver vertical throats
void void space
Superscripts
0 reference value
* saturation, threshold
- average
∞ bulk phase
est experimentally estimated
exp experiment
i index of time step
max maximum value
min minimum value
std standard deviation
t time index
Abbreviations
BL boundary layer
CCD charge-coupled device (camera) CLO cluster labeling option
CLSM confocal laser scanning microscopy CMA central moving average
CRP constant rate period EGP etched glass plate
ER empty ring
xviii HSC Hele-Shaw cell
IR infrared
LAP least advanced point LED light-emitting diode MAP most advanced point
max maximum
PDMS Polydimethylsiloxane
PN pore network
PNM pore network model PMMA Poly methyl methacrylate PSD pore size distribution RFP receding front period RGB red-green-blue (image) RLO ring labeling option SiO2 silicon dioxide
SE southeast
SM single meniscus
SR single ring
SW southwest
Chapter 1
Introduction
1.1 Motivation and scope of the thesis
At least since the beginning of agriculture more than 13 thousand years ago, drying is intensively used to preserve food and natural products. With the onset of industrialization at the beginning of the 18th century more and more technical applications emerged that involved drying of capillary porous media, ranging from porous materials with a more or less rigid solid matrix (e.g. paper, catalysts) to particulate materials or powders (e.g. coal, bricks, ceramic, granules, food pellets) (Plumb 2000). However, compared to the long history of drying of porous media, the history of understanding the underlying physical effects that are incorporated in the drying process is relatively young and may have started with Leonardo DaVinci1, famous painter, sculptor and also a diligent engineer and natural philosopher who found already around 1500 that liquid rises into a wettable capillary dipped into a liquid source without any exterior driving force (Westphal 1970). More than 100 years later, French, English and Italian scientists could demonstrate that the height of liquid rise is inversely proportional to the radius of the capillary (de Gennes 2004) from which it is concluded that a very high tree must essentially contain very small capillaries at the treetop in order to supply it with water (Fig. 1‐1). In a system of interconnected capillaries, such as a porous medium, liquid usually fills the pores in the order of increasing pore radius and when the process is reversed and the overall saturation of the porous medium is again reduced, as in drying, it is the smallest pore that maintains full saturation until the end of the drying process. The physical cause of this phenomenon was found by Thomas Young2 and Pierre‐Simon Laplace3 in 1805 who ascribed, independently of each other, the liquid rise in a capillary to surface tension of the liquid (Smiles 1914) and proposed a relation between capillary radius, surface tension, contact angle and the pressure inside the capillary. At that time, both, Young and Laplace were neglecting the effects counteracting capillary pumping, 1 Leonardo DaVinci (1452‐1519) 2 Thomas Young (1773‐1829) 3 Pierre Simon Laplace (1749‐1827)
„Allgemein in der menschlichen Natur liegt der Trieb nach Erkenntnis.“
Aristoteles ‘Metaphysik‘ * 384 B.C. in Stageira † 322 B.C. in Chalkis
namely gravity forces acting on the liquid column and friction forces inside the liquid phase. Unfortunately, both scientists died before the German engineer Hagen4 (1839) and the French physicist Poisseuille5 (1840) could present a theory that considers friction in laminar fluid flow through a cylindrical capillary (Bird, Stewart and Lightfoot 1960), finding that flow
rate is inversely proportional to viscosity. Again more than 100 years later Richard Lucas (1918) and Edward W. Washburn6 (1921) combined the equations of Young‐
Laplace and Hagen‐Poisseuille to describe the dependency of capillary rise on viscosity.
Figure 1‐1 Schematic illustration of capillary transport on the example of tree capillaries:
large trees need very small capillaries to supply the treetop with liquid.
Based on these achievements, scientists started to intensively study and model the transport phenomena in porous media mainly in the second half of the 20th century (parallel to the development of computational techniques). Examples are found in a wide range of technical applications. These are, besides the drying of porous media studied in this thesis, also e.g. oil recovery, chromatography, membrane technologies (e.g. in fuel cells or electrolyzers,
Vidakovic‐Koch 2016), thin film technologies (e.g. in production of batteries, Baesch et al. 2017) or energy storage, to name only a few. Medical applications are e.g.
biomedical porous coatings used as a bone–implant interface (Prat and Agaesse 2015). Beyond this, especially space applications profit from capillary action as it can overcome the problem of absent gravity (e.g. in heat pipes and fuel cells). A general overview of transport in porous media can be obtained from e.g. Krischer and Rohnhalter (1940), Phillip and De Vries (1957), Luikov (1966), Suzuki and Maeda (1967), Whitaker (1977), de Boer (1988), Bories (1991), Plumb (2000), Kowalski 2007 (literature related to drying of porous media) or in van Brakel (1975), Celia et al. (1995), Berkowitz and Ewing (1998), Dullien (2012) (literature related to transport through porous media in general). This shows, although the underlying physical phenomena have already been known since the early 19th century, advancing measuring techniques (such as cameras, tomographs or spectrometers) as well as computational power and capacities allowed for an extensive experimental and numerical study of transport in porous media within the past 40 years. Seemingly most of the published books and scientific articles from this period refer to geophysics applications (e.g.
Wilkinson (1986), Lenormand (1989), Selyakov and Kadet (1996), Berkowitz and Ewing (1998) and references therein); also the publication of Tsimpanogiannis et al. (1999)
about scaling theory of drying porous media is essentially inspired by oil recovery related problems. This is quite comprehensible since the soil forms the largest porous medium of 4 Gotthilf Heinrich Ludwig Hagen (1797‐1884) 5 Jean Léonard Marie Poiseuille (1797‐1869) 6 Edward Wight Washburn (1881‐1934)
the world and moreover the exploration of oil from sedimentary rock was worldwide one of the economically and ecologically most important processes in the 20th century. Independent of this, drying is at least equally important because almost every solid product must be dried before its final application (including thin films, solid fuels, catalysts, membranes, paper and processed food) and moreover the process of drying is always accompanied by considerable energy expenses and costs (refer e.g. to Plumb (2000) and references therein).
Traditionally, drying focused on agricultural (herbes, crop, hay) and construction materials (clay, brick, reed). But from a contemporary point of view drying increasingly plays an important role in product formulation. This means, that not just the removal of liquid (path independent drying result) is of interest but that moreover the pore level processes or more clearly the evolution of the drying front inside the porous medium is a key parameter for product formulation (path dependent drying result). Exemplarily, Boernhorst et al. (2016) show that the drying velocity can control the impregnation of a porous medium with salt (Fig. 1‐2); this finding is based on the different structures of the drying front evolving during drying as will be explained below. The use of drying as a process step in product formulation finally leads more and more to the application of alternative drying processes which complete or replace the rather traditional drying methods, which are namely convective drying, contact drying and infrared drying (sun light). Examples are freeze drying, microwave drying (i.e. electromagnetic drying) or supercritical drying (Plumb 2000). Other examples are combined processes such as e.g. combined convective and contact drying in the production of thin films (e.g. for batteries, Baesch et al. 2017) or inductive energy supply in fluidized beds (Idakiev et al. 2017).
a)
b)
Figure 1‐2 Drying as a process step in product formulation. The example from
Boernhorst et al. (2016) shows that the distribution of salt can be controlled by the drying rate. Slow drying leads to a heterogeneous distribution of salt inside the porous medium (a), while fast drying leads to a rather homogeneous distribution of salt (b). (In these figures salt is represented by the light red areas, the white patches and the white surface layer. Regions without salt appear in dark red).
However, choice of an appropriate drying process is still usually based on experience and macroscopic observations of drying curves, shrinking behavior, flow behavior or sensory properties (in food process engineering). Additionally to that, the majority of drying models, applied to study and predict drying processes, are macroscopic continuum models (e.g. Krischer and Kast (1992), Luikov (1966), Whitaker (1977), Scherer (1990), Perré and Turner (1999), Plumb (2000), Schluender (2004), Tsotsas et al. (2012), Mujumdar (2015)). The essential underlying pore scale effects and processes, however, are rarely taken into account to choose the drying method, because they are relatively difficult (or costly) to obtain. This appears quite surprising because e.g. according to Tsimpanogiannis et al. (1999)
the ,phenomenological approaches […] consider the medium as a structureless continuum’ ignoring ,the pore microstructure and the underlying phenomena, which are key to the quantitative understanding of the process’. As a consequence structure of the drying front is usually blurred when continuous models are applied (Fig. 1‐3). Macroscopic models are thus commonly used to determine drying behavior (e.g. the overall energy consumption, overall drying time, saturation curve and drying rate) on the sample scale or process scale. Figure 1‐3 Illustration of macroscopic volume‐averaged continuous models of drying (related
to the use of effective parameters) (right) and comparison to the pore scale liquid distribution during drying (from pore network simulation) (left). The liquid is shown in black and dry regions are shown in white; the solid appears in gray (in the image on the left). The evaporation front is located along the gas‐liquid interface in the pore network. Contrary, the drying front is marked by the transient gray region in the continuous representation of the pore network.
A number of mathematical tools have been developed to investigate and describe the impact of pore scale effects on drying. Besides the pore network models (PNMs) studied in this thesis, molecular dynamics simulation (e.g. Defraeye et al. 2016), discrete element
models (e.g. Peron et al. 2009), Lattice‐Boltzman models (Sukop et al. 2004, Yiotis et al. 2007) and bundle of tubes models (e.g. Metzger 2005a, Irawan 2006) shall be
mentioned here to name some prominent examples.
Pore network models (PNMs) are discrete pore scale models used to compute mass and energy transfer between the individual elementary components of a porous medium in order to understand and describe the transfer phenomena on the microscale. In this sense, PNMs can complement continuous macroscopic models (see also Geoffroy and Prat (2014) for a comparison of continuum models and PNMs). Additionally, pore network (PN) computations, although limited by pore number as well as the number of physical effects to be taken into account, represent a mathematical tool with the potential to parameterize macroscopic continuous models, either by Monte Carlo simulation (Nowicki et al. 1992, Prat 2002, Vu 2006) or by application of percolation theory (for the latter see e.g. Tsimpanogiannis et al. (1999), Selyakov and Kadet (1996) or Berkowitz and Ewing (1998) and references therein). Reviews on PNMs can be found in Celia et al. (1995), Sahimi (1995), Dullien (2012) and Berkowitz and Ewing (1998). In the field of drying, PNMs received particular attention since the early nineties of the past century as they could readily be
adapted from soil physics (Shaw 1987, Daian and Saliba 1991, Nowicki et al. 1992, Prat 1993). Since then, PNMs could give a great insight and consolidate the understanding of
mass transfer processes in porous media. Exemplarily, PNMs could illuminate the dependence of drying front structure on capillary number (Shaw 1987, Metzger et al. 2007a, Metzger and Tsotsas 2008) and Bond number (Prat 1993, Laurindo and Prat 1996, Yiotis et al. 2012a, Yiotis et al. 2012b) as well as on thermal gradients (Hunink et al. 2002, Plourde and Prat 2003, Surasani 2009), the impact of wetting phenomena (Yiotis et al. 2004, Prat 2011), the transport of particles and efflorescence (Veran‐Tissoires and Prat 2014), etc. It could be shown that the width of the drying front can be reduced by increase of viscous effects, i.e. increased drag forces, reduced variance of the pore size distribution or increased drying rates (Metzger et al. 2007c) (Fig. 1‐4a,b). The relevance of this effect, which is also known as the drying front stabilization, is shown in the example of Fig. 1‐2. a) b) c) d)
Figure 1‐4 Distinct drying phenomena that can be related to the underlying pore scale
effects: a) Capillarity controlled drying process with front widening and capillary fingering
(from Metzger et al. 2007b), b) viscous stabilization of the drying front (from Metzger et al. 2007b), c) drying in presence of wetting liquid films (from Prat 2007), d) gravitational destabilization of the liquid phase (from Laurindo and Prat 1996). (Drying
from the top. Liquid phase in black, gas phase in white, solid (a,b) and liquid films (c) in gray.
Following up on this, PN simulations revealed that the extent of wetting capillary films, which can form a secondary capillary transport system, is limited by viscosity of the liquid phase wherefore liquid films rather develop in case of small capillary numbers (Prat 2007) (Fig. 1‐4c). Study of gravitational effects showed that gravitation, similarly to viscous effects,
stabilizes the drying front and thus counteracts capillary forces (Prat 1993, Yiotis et al. 2012a, Yiotis et al. 2012b), if the hydrostatic pressure decreases in the same
direction as the migration of the drying front (similar as in Fig. 1‐4b). Contrarily, a destabilizing effect, characterized by ramification of the liquid phase and early breakthrough of the gas phase, can be found in case of the opposite direction of the imposed hydrostatic pressure gradient (Laurindo and Prat 1996) (Fig. 1‐4d). To complete this list, it is noted that a destabilizing effect is also obtained in presence of a bi‐ or multimodal pore size distribution with interpenetration of the various porous domains, thus allowing the displaced fluid (water) and the displacing fluid (air) to span the 2D PN (similar as in Fig. 1‐4a).
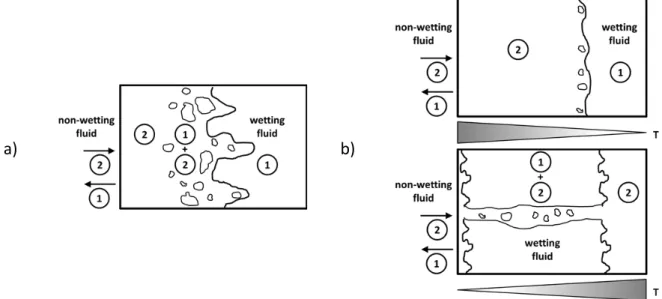
In summary, these examples illustrate that the choice of the parameter setting (either in PN computations or in drying of real porous media) dictates the formation of different drying front structures (Fig. 1‐4). From this can be concluded that a wise selection of parameters can promote drying time as well as product quality. In this sense, PNMs are applied especially in those investigations in which knowledge of the evolution of the drying front structure is essential to understand and predict the macroscopic drying behavior. This is exemplarily useful in the study of salt distribution shown in Fig. 1‐2. Moreover, the list of examples shows that the multiple interactions of the physics of transport processes in porous media together with material, liquid and gas properties can lead to the application of complex PNMs. The associated increase in computational effort indeed limits the use of the complex models. Though, PNMs are usually applied to simulate the prominent effects on a much smaller scale with the aim of quantification and to understand the interaction of micro‐ and macroscale effects, usually realized in the frame of Monte Carlo simulations. In this thesis, the effect of imposed thermal gradients on drying of porous media is studied by PNMs. Similarly as the effects discussed above, change of the macroscopic thermal conditions has a direct impact on the pore scale transport mechanisms. Specifically, thermal gradients can lead to similar stabilizing and destabilizing effects as viscosity and gravity (Huinink et al 2002, Plourde and Prat 2003, Surasani 2009) (Fig. 1‐5).
a)
b)
Figure 1‐5 Impact of thermal gradients on pore level liquid distribution. a) Stabilization of
the drying front by a negative thermal gradient and b) destabilization of the liquid phase by a positive thermal gradient (from Plourde and Prat 2003). (Drying from the top. Liquid phase in dark gray, gas phase and solid in white).
Precisely, a temperature gradient with temperature decreasing in the direction of the advancing drying front (referred to as a negative temperature gradient throughout the thesis) can lead to stabilization of the drying front with a gradually increasing vapor diffusion zone between evaporation front and product surface (Fig. 1‐5a). Contrarily, the opposed thermal gradient (i.e. a positive temperature gradient) destabilizes the penetration front resulting in long term capillary pumping to the network surface (Fig. 1‐5b). These temperature gradients can be linked to contact drying (positive temperature gradient) and convective drying (negative temperature gradient). Similar gradients are also expected in microwave drying, freeze drying and inductive drying (Idakiev et al. 2017). Besides this, thermal gradients also naturally evolve in building rocks and the soil under daily and annual temperature fluctuations with the result of thermally affected moisture migration and drying. Examples are heat and mass transfer processes in the vicinity of buried nuclear waste (Gu et al. 1998) and related contamination problems (Celia et al. 1995). Another example is the thermally affected transport in GDLs during operation of fuel cells and electrolyzers. Moreover, similar as the distribution of dissolved particles or salt crystals (as shown in
Fig. 1‐2), the surface covering hydrophobicity of GDLs depends on the pore scale migration of liquid during the drying step in the production of the GDLs. Following the argumentation above, this process might be controlled by imposed thermal gradients.
It is thus the aim of this thesis to study pore scale liquid and vapor transfer in presence of imposed thermal gradients in order to understand and describe the coupling of microscale effects and macroscale drying behavior. It will be shown that the variation of the thermal gradient offers indeed a tool to control drying and product quality of porous media especially in situations in which the variation of other parameters (pore size distribution of the porous medium, viscosity, surface tension and wettability) is not possible because of physical constraints or for cost reasons.
1.2 Previous works
PN modeling may have started in the field of hydrology and oil recovery, namely with Fatt in 1956 (Fatt 1956a) when he presented the first network of tubes, facing the inability of available models, namely the bundle of tubes and pack of spheres, to describe flow through porous media sufficiently. While the first kind of models strongly simplified the porous medium under investigation, the second kind of models, at this time, was too complex and incorporated questionable empirical parameters (Fatt 1956a). For his computations, Fatt used an analog computer of interconnected electrical resistors. He found similar capillary pressure curves as from sandstone and glass bead packs. However, from today’s point of view, a drawback of his model is the assumption of an interconnected liquid phase until complete desaturation, which means that he excluded trapping and computed the order of emptying independently of the position of the gas‐liquid interface. To prove the validity of his model and its advantage over a simple bundle of tubes he also investigated flow properties by means of the permeability or rather electrical conductivity of the network. (The problem was adapted by a network of electrical resistors and the resistance was measured by Wheatstone‐bridges) (Fatt 1956b, Fatt 1956c).
The first publications in the frame of PN modeling of drying of porous media and percolation theory are the ones of Shaw (1987), Daian and Saliba (1991), Nowicki et al. (1992) and Prat (1993). Since then, various PN drying models were developed for various applications (a brief overview is given below, reviews can e.g. be found in Segura (2007), Prat (2002) or Metzger et al. (2007b)). In these models the void space of the porous medium is represented by a quadratic or cubic network of interconnected pores and pore throats that can either contain liquid (saturated) or gas (empty) or both (then the phase boundary of gas and liquid is found inside the partially saturated pore or pore throat) (Fig. 1‐6). Usually, two kinds of models are distinguished. These are the models that assign the void space entirely to the pores (or sites/nodes) and the models that assign the void space entirely to the throats (or bonds). This is related to the rather traditional use of PNMs in the frame of percolation theory (Stauffer and Aharony 1994). In drying, models of the second type are usually applied. However, there are also PN drying models incorporating pore and throat volume (as e.g. in this thesis); this can be advantageous if the physics of simultaneous drying and imbibition are studied in the same PN. Independently of the kind of PNM, emptying of the void space, due to the combined action of evaporation of water at the gas‐liquid interface and capillary invasion, can be followed pore by pore (or throat by throat), which gives a great insight in the leading effects in drying of porous media.
a) b)
Figure 1‐6 Illustration of a PN (from Prat 1993). a) Complete network of interconnected
pores and throats which form the void space of the PN. (Note that contrary to the networks generally presented throughout the thesis the void space is in black and the solid in white in this figure.) b) Representative part of the network, indicating a pore, throats, nodes, the solid phase as well as the lattice spacing.
1.2.1 PNMs of isothermal drying
The earliest publication usually cited in the context of drying of PNs, is the one by Shaw (1987), although his work was only experimental (in the Hele‐Shaw cell) and did not incorporate any PNM. Anyways, Shaw (1987) presented the idea of applying percolation theory to drying of porous media based on the finding of the similarity of the fractal structure of a drying front and a percolating system. In this (and also other publications of that time) drying is described as a process of immiscible displacement with a fractal structure of the drying front identical to the fractal structure found in the classical percolation process of drainage. (Exemplarily, Prat (1993) used the term ‘percolation model’ in his first publication on this subject, whereas the term ‘pore network model’ can be found in later publications (e.g. Laurindo and Prat 1996)).
In his work, Shaw (1987) discussed the experimental determination of the scaling exponent of a drying front developing in a porous packed bed of silica spheres. He found that the drying front, although of fractal character on the microscale, gets stabilized (i.e. exhibits a limited width) if the porous medium is sufficiently large, even if the capillary number and the viscosity ratio of liquid to gas phase are in favor of capillary fingering (see also Lenormand 1989). This was also confirmed by Tsimpanogiannis et al. (1999): ,Near the leading front, the displacement will be of the percolation type […] as the width of the front increases, viscous forces become increasingly important, leading to a displacement described by IPSG’ (invasion percolation in a stabilizing gradient). They emphasized that a macroscopic model, incorporating an effective porous medium and neglecting capillarity, would misinterpret this effect which could only be explained by limited diffusion‐driven vapor transport in such a model. Accordingly, protruding drying front sections (also referred to as the least advanced point of the front) would be subject to high evaporation rates and thus naturally disappear. PN simulation instead, can shed light on this effect as it demonstrates that stabilization is caused by viscous friction forces counteracting capillary pumping. This seems to be reasonable in the face of the large porous system and the involved small pores in Shaw’s porous network (see Section 1.2.3 below for details of the network). Consequently, Shaw (1987) ascribed the stabilizing effect to the counter flow of gas and liquid phase. Prat (1993) again hypothesized that drying of disconnected clusters in