OATAO is an open access repository that collects the work of Toulouse
researchers and makes it freely available over the web where possible
Any correspondence concerning this service should be sent
to the repository administrator:
[email protected]
This is an author’s version published in: http://oatao.univ-toulouse.fr/20437
To cite this version:
Baux, Jordan
and Caussé, Nicolas
and Esvan, Jérôme and Delaunay, Sophie
and Tireau, Jonathan and Roy, Marion and You, Dominique and Pébère, Nadine
Impedance analysis of film-forming amines for the corrosion protection of a carbon
steel. (2018) Electrochimica Acta, 283. 699-707. ISSN 0013-4686
Official URL:
https://doi.org/10.1016/j.electacta.2018.06.189
Open Archive Toulouse Archive Ouverte
Impedance analysis of film-forming amines for the corrosion
protection of a carbon steel
Jordan Baux
a,b, Nicolas Causs!
e
a, J!
er^
ome Esvan
a, Sophie Delaunay
b, Jonathan Tireau
b,
Marion Roy
c, Dominique You
c, Nadine P!
eb#
ere
a,*aUniversit!e de Toulouse, CIRIMAT, UPS/INPT/CNRS ENSIACET, 4 all!ee Emile Monso, 31030, Toulouse Cedex 4, France bEDF R&D / MMC / Chemistry and Corrosion Group, Avenue des Renardi#eres, 77818, Moret-sur-Loing Cedex, France
cDEN e Service d’Etude du Comportement des Radionucl!eides (SECR), CEA, Universit!e Paris-Saclay, 91191, Gif-sur-Yvette, France
a b s t r a c t
Octadecylamine (ODA) is a well-known organic inhibitor for the corrosion protection of carbon steels. In the present study, electrochemical impedance data analysis was performed to extract physical param-eters of the ODA thin film that formed on a P275 carbon steel surface. First, surface observations and contact angle measurements showed the steel surface modification after the ODA treatment linked to the adsorption of an organic hydrophobic thin film. X-ray photoelectron spectroscopy confirmed the pres-ence of a very thin organic layer and revealed the prespres-ence of iron oxide/hydroxide underlying the ODA film. The impedance data analysis with a power-law distribution of resistivity in the organic film allowed the permittivity and thickness to be extracted. Finally, from the impedance results with and without ODA, the instantaneous corrosion inhibition efficiency was determined.
1. Introduction
During shutdown periods of pressurized water reactors (PWR) for maintenance operation, strict and restrictive conservation conditions must be respected in order to preserve the secondary circuit of any oxidation phenomenon. Use of inhibitors, such as film-forming amines (FFA), is a promising approach to simplify the conservation conditions while reducing or stopping the corrosion of carbon steel, which constitutes the major part of the PWR sec-ondary circuit [1,2]. A key benefit of FFA is to improve the corrosion protection during start-ups and shutdowns of the PWR and, as a consequence, high steam quality can be obtained quicker during start-up, leading to significant economic benefits [1]. Even though FFA have been used successfully for decades to treat water in in-dustrial power plants [3], its behaviour is not well understood as well as the physical characteristics of the film formed on the carbon steel surface. Octadecylamine (ODA), CH3(CH2)17NH2, one of the
simplest FFA molecule, has been used for steel protection in nuclear power and fossil fuel power plants for many years [1,3e12]. The
molecule has both a hydrophilic head and a hydrophobic tail, which after the film formation creates a physical barrier that impedes water, oxygen or other corrosive agents to reach the metal surface and also probably prevents iron dissolution (anodic and cathodic effects). The protective film is often described as a monolayer formed on the steel surface [2,10,13,14] but proof of its thickness has never been provided. The determination of the film thickness would be of great interest to better control the ODA injection in the secondary circuit. However, in situ determination of organic ultra-thin films thickness remains quite challenging, moreover on rough surfaces [15e18]. Mechanical and optical profilometry are not sensitive enough to investigate the film thickness at a sub-micrometric scale. Other optical techniques, such as ellipsometry, require the knowledge of physical quantities (refractive index, for example) and the use of modelling to extract the film thickness from the experimental data [18]. Atomic force microscopy (AFM) can be used for in situ determination of very thin film thickness but the measurements are strongly sensitive to the substrate rough-ness. For an ODA film deposited on mica, Patil et al. have measured, by AFM and in humid conditions, a thickness of about 20e30 nm [18]. On the other hand, x-ray photoelectron spectroscopy (XPS) and secondary ion-mass spectroscopy (SIMS) are powerful ex situ techniques that allow surface characterization and thickness
measurement at a nanometric scale. However, the erosion rate, which depends on the material, must be known for an accurate thickness determination.
Electrochemical impedance spectroscopy (EIS) is a widely used technique for the assessment of the corrosion protection by in-hibitors and coatings. This technique allows in situ measurements in controlled experimental conditions, which can be representative of real environment [19e22]. Recently, good agreement has been found between results obtained from EIS data and XPS analysis for the determination of a thin oxide layer thickness [23e28].
The aim of the present work was to determine the thickness of an ODA film formed on a carbon steel surface at 80!C in an alkaline
solution. These pH and temperature conditions are close to that encountered in the PWR secondary circuit. First, the film formed on the carbon steel electrode was characterized by ex situ observations and XPS analysis. Then, the impedance diagrams obtained in the solution in the presence of ODA was compared with a model to determine the thickness and the dielectric permittivity of the organic film. From the impedance diagrams obtained at the corrosion potential, with and without ODA, the instantaneous corrosion inhibition efficiency was assessed.
2. Experimental 2.1. Materials
The P275 low carbon steel was supplied by EDF (France) as representative material of the PWR. Its composition is reported in
Table 1. The steel sample was machined to obtain a cylindrical rod of 1.13 cm in diameter (surface area ¼ 1 cm2). The lateral part of the rod was covered with a heat-shrinkable insulating sheath, leaving only the tip of the carbon steel in contact with the solution. The steel surface was wet ground with silicon carbide (SiC) papers down to grade 4000, ultrasonically cleaned with ethanol, rinsed with deionized water and dried.
The chosen FFA was octadecylamine (ODA) in the form of
ODACON®
, a commercial emulsion (z50 g/L FFA) supplied by REICON™.
The electrolyte solution was prepared from deionized water by adding Na2SO410#3M (analytical grade). The pH of the solution
was adjusted at 10 with ammonia (99.99%). The choice of this medium was based upon its low electrical conductivity, close to that encountered in industrial water circuits, its low corrosiveness toward carbon steel and because it is an easily reproducible base-line solution. The same solution was used for the film formation and for the electrochemical impedance measurements.
2.2. Film formation
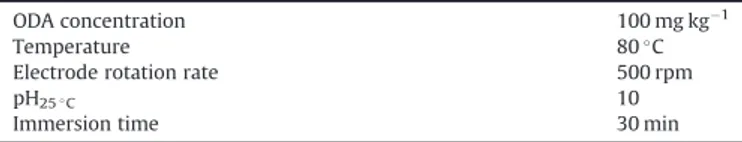
The optimum conditions (ODA concentration, temperature, pH of the solution, immersion time and electrode rotation rate) to achieve a homogeneous film formation were determined from preliminary experiments. In the present work, the chosen experi-mental conditions are reported inTable 2. With these parameters, a protective ODA film was formed on the carbon steel surface in less than 30 min.
For the surface analysis (optical observations, contact angle measurements and XPS), the samples were removed from the
electrolytic solution and kept in contact with air. For the electro-chemical measurements, after the film formation according to the conditions reported inTable 2, the cell was left at room tempera-ture and all the parameters were kept constant. The diagrams were obtained after 2 h of immersion in the same electrolyte. The sample after the film formation is henceforth called the ODA treated sample.
2.3. Surface characterizations
Optical observations were performed with a binocular and an Olympus PMG3 optical microscope. The contact angles were measured at room temperature using a Digidrop Contact Angle Meter from GBX Scientific Instruments. The protocol consisted in depositing a deionized water drop of an accurate volume of 2
m
L on the sample surface (bare carbon steel surface or ODA treated sample) and then measuring the static contact angle, 60 s after the drop deposition. To assess the homogeneity of the surface proper-ties, 20 measurements were performed on different locations over the samples surface.The chemical composition of the film formed on the carbon steel surface was determined using XPS analysis carried out on a K alpha Thermo Scientific Spectrometer. The specimens were irradiated with a Al-K
a
radiation (hy
¼ 1486.6 eV) from a monochromatized source and the x-ray spot was approximately 400m
m in size. Angle-resolved measurements were made at a take-off angleq
¼ 90!(e.g.normal to the sample surface). For the surveys spectra, pass energy was fixed at 160 eV and at 40 eV for high resolution spectra. The energy calibration was made using the Au 4f 7/2 (83.9 ± 0.1 eV) and Cu 2p 3/2 (932.8 ± 0.1 eV) photoelectron lines. XPS spectra were recorded in direct N(Ec). Background signal was removed using Shirley method. The binding energy scale was established by referencing the C 1s value of adventitious carbon (284.9 ± 0.1 eV). The photoelectron peaks were analysed by Gaussian/Lorentzian (G/ L ¼ 30) peak fitting. Flood gun was also applied for avoiding charge effects. The analyses were performed on two ODA treated samples and at various locations to verify the homogeneity of the layer.
2.4. Electrochemical measurements
The electrochemical measurements were performed with a conventional three-electrode cell with a saturated sulphate refer-ence electrode and a platinum grid, as counter electrode. The working electrode consisted of the carbon steel rod. The rotation rate was fixed at 500 rpm. Electrochemical impedance measure-ments were performed using a Solartron 1286 electrochemical interface connected to a Solartron 1250 frequency response ana-lyser. Impedance diagrams were obtained under potentiostatic regulation at the corrosion potential (Ecorr) in the frequency range
of 65 kHz to 10 mHz with 8 points per decade, using a 15 mVrms
sinusoidal voltage. Impedance data beyond 6.5 kHz were not taken into account due to experimental artefacts [29]. The obtained impedance diagrams were always consistent with the Kramers-Kronig relations [30e32]. Data modelling was carried out with a non-commercial software developed at the LISE CNRS (Paris).
Table 1
Chemical composition (wt. %) of the P275 carbon steel (EN10028-3).
Element C Si Mn Cr Mo Ni Cu Fe
0.16 0.4 0.5e1.5 0.3 0.08 0.5 0.3 Bal.
Table 2
Parameters for the formation of the ODA film.
ODA concentration 100 mg kg#1
Temperature 80!C
Electrode rotation rate 500 rpm
pH25!C 10
3. Impedance diagrams analysis
The impedance results for the ODA treated sample were ana-lysed in two successive steps in order to determine the organic film thickness. The first approach was based on graphical methods, in-dependent of any physical model [23,33,34]. The second approach was focused on the use of the power-law resistivity model devel-oped by Hirschorn et al. [35,36]. Both methodologies are briefly recalled in the following sections.
3.1. Graphical methods
The impedance results are commonly analysed by using elec-trical equivalent circuits (EEC). However, it is observed that re-sistances and capacitances, which are associated with different steps of the corrosion process, inhibitor or coating properties do not accurately describe the experimental impedance data. In these cases, constant phase elements (CPE) were used instead of capac-itances to take into account the non-ideal behaviour of the system. The CPE impedance is expressed in terms of model parameters
a
and Q as:
ZCPE¼
1
ðj
u
ÞaQ (1)with
u
¼ 2p
f. Thea
parameter can be extracted by plotting thelogarithm of the imaginary part of the impedance (Zj) with respect
to the logarithm of the frequency (Eq.(2)) [33]. Q is expressed as a function of
a
and impedance data (Eq.(3)):a
¼dlog! # Zj " dlogðf Þ (2) Q ¼ sin#ap
2 $ #1 Zjðf Þð2p
f Þa (3)In the case of a 3D dielectric layer on a conducting electrode surface, the CPE parameters can be directly related to the physical properties of the layer. For oxide films or organic coatings, the capacitance of the layers can be extracted from the impedance data by using the complex-capacitance representation [23e25,34,37].
Cð
u
Þ ¼ 1j
u
½Zðu
Þ # Re' (4)The value of the electrolyte resistance, Re, must be accurately
determined from extrapolation at high-frequency on the real axis of the Nyquist diagram to correctly represent the complex-capacitance plots. Once the complex-capacitance of the layer, Cf, is known,
the layer thickness,
d
f, can be calculated from the relationship:d
f ¼εε0 Cf
(5)
where ε is the permittivity of the film and ε0, the permittivity of
vacuum.
It is noteworthy that with an accurate estimate for the electro-lyte resistance a modified Bode representation, corrected from the ohmic drop, can be obtained from the following relationships (Eq.
(6) and Eq. (7)). This allows the CPE behaviour to be clearly observed in the high-frequency domain.
jZj ¼ ffiffiffiffiffiffiffiffiffiffiffiffiffiffiffiffiffiffiffiffiffiffiffiffiffiffiffiffiffiffiffiffiffiffiffiffiffiffi ðZr# ReÞ2þ!Zj "2 q (6)
F
¼ tan#1 ' Z j ðZr# ReÞ ( (7)where Zrand Zjare the real part and the imaginary part of the
impedance.
3.2. Power-law resistivity model
Recently, different studies suggested that the origin of the CPE behaviour observed with oxide films or organic coatings may be the consequence of a normal distribution of their resistivity along the film thickness according to the model developed by Hirschorn et al. [35,36]. The resistivity
r
ðx
Þ, withx
¼ xd, is expressed (Eq.(8)) as a function of the layer thickness,d
, the depth, x, in the layer, the boundary resistivity valuesr
0 andr
dat the metal/film interface(x ¼ 0) and at the film/electrolyte interface (x ¼
d
) andg
which is derived from the CPE parametera
such asa
¼ ðg#1Þg .r
ðx
Þr
d ¼ 'r
dr
0þ ' 1 #r
dr
0 (x
g (#1 (8)The corresponding impedance can be determined by using an integral expression: Zfð
u
Þ ¼d
Z1 0 1 1 r0þ ju
εε0þ # 1 rd# 1 r0 $x
gdx
(9)Regression of EIS data with the power-law model allows the extraction of physical parameters related to the film, such as the permittivity, the thickness and the resistivity values
r
0andr
dat theinterfaces which are not easily accessible by other techniques. Ac-cording to Hirschorn et al. [35], for a frequency lower than fd ¼
ð2
pr
dεε0Þ#1, an analytical expression of the impedance of the film can be written as:Zfð
u
Þ ¼ gdr
1#a d !r
#1 0 þ ju
εε0"a (10) Where g ¼ 1 þ 2:88ð1 #a
Þ2:375 (11)This impedance shows a CPE behaviour in the high-frequency range (f < fd) with
a
and Q as parameters andQ ¼ ðεε0Þ a
g
dr
ð1#d aÞ (12)with
r
d, the resistivity at the film/electrolyte interface as discussedabove.
The resistivity at the metal/film interface
r
0can be calculated byusing the characteristic frequency, f0, graphically determined at the
maximum of the imaginary part of the impedance:
r
0¼ 12
p
εε0f04. Results and discussion
4.1. Morphology and hydrophobicity of the samples surface
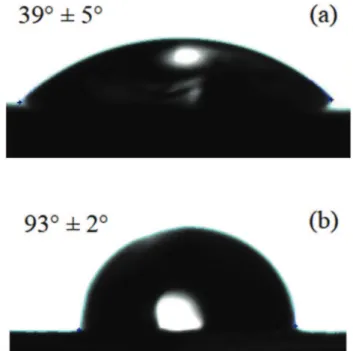
Fig. 1shows the carbon steel surface after 30 min in the elec-trolyte at 80!C with and without ODA. Without ODA, corrosion
products with the shape of hydrodynamic pattern are observed (Fig. 1a). Similar photographs, taken in situ, for the corrosion of pure iron in neutral chloride solutions, have shown that with increasing immersion time (24 h), the corrosion led to the formation of porous layers which progressively decreased the active area of the bare metal [38]. In the presence of ODA, the carbon steel surface is not
attacked but covered with scattered small round clusters (Fig. 1b). Their dimensions ranged from 0.1 to 5
m
m (Fig. 1c). Raman spec-troscopy analysis (results not shown) have revealed that the clus-ters are made of bulk ODA. From these photographs, it can be assumed that ODA molecules covered the entire carbon steel surface.Contact angle measurements were performed on the bare car-bon steel surface and on the ODA treated sample. The results are shown inFig. 2. For the bare steel, the surface presented a hydro-philic character with a contact angle value of 39!±5!(Fig. 2a). For
the ODA treated sample (Fig. 2b), the contact angle value is 93!±2!
showing that the surface lost its hydrophilic character, which is a well-known effect of the ODA adsorption [1]. The weak variation of the contact angle for the ODA treated sample (Fig. 2b) indicates that the hydrophobic film is homogeneous even in the presence of ODA aggregates on the surface.
4.2. XPS analysis
Fig. 3shows the surveys spectra for the bare carbon steel surface (Fig. 3a) and for the ODA treated sample (Fig. 3b). On Fig. 3b, independently of the sample and of the analysed area, the spectra are superimposed and Fe, O, C and N peaks are observed confirming a homogeneous coverage of the carbon steel surface by the ODA molecules. The N signal is not observed inFig. 3a, and in contrast, in
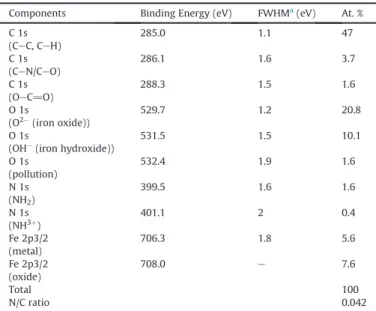
Fig. 3b, the small N peak and the intense C peak are associated to the presence of the ODA molecules.Fig. 4displays the high reso-lution spectra of N 1s, C 1s, Fe 2p3/2 and O 1s. The binding energies for the different signals are summarised inTable 3as well as the chemical composition of the surface (in at. %), calculated from the peak area.
The N 1s spectrum exhibits two peaks at 399.5 eV and 401.1 eV which can be assigned to the NH2[39e42] and NH3þ[17,43,44]
groups, respectively. The binding energy difference between NH2
and NH3þ(1.6 eV) is in agreement with previous studies [43,44]. The same binding energy has been reported for NH2in the case of
Pd and Ag substrates: CH3NH2/Pd [39], CH3CH2NH2/Ag [40],
Fig. 1. Optical observations of the carbon steel surface after immersion in the elec-trolyte at 80!C, pH
25!C¼ 10,U¼ 500 rpm during 30 min: (a) without ODA, (b) with
NH2(C6H4)O(C6H4)NH2/Ag [41] and ODA on graphene oxide
sub-strate [42]. The C 1s spectrum displayed three peaks: the first one at 285 eV can be ascribed to the aliphatic CeC bond of the ODA molecule [42]. The second one at 286.1 eV is attributed to CeO and CeN bonds. The third, small peak at 288.3 eV is characteristic of CeN bonds in amides or O]CeO bonds [42] which would be due to surface pollution. For the Fe 2p spectrum, a first peak appears at 706.3 eV due to metallic iron and a second peak, beyond 710 eV, relates to iron oxides [45]. The O 1s spectrum is composed of at least two peaks: one at 529.7 eV relates to O2#(iron oxides) [44], and a second one at 531.5 eV attributed to the OH# ions [46]. A
small peak at 532.4 eV would be linked to the surface pollution.
Fig. 3. XPS survey spectra of: (a) the bare steel surface and (b) the ODA treated sample surface. In Fig. 3b, the spectra were obtained for two samples and on different locations.
Fig. 4. High resolution XPS spectra of N 1s, C 1s, Fe 2p3/2 and O 1s for the ODA treated sample surface. Table 3
Chemical composition of the treated ODA steel surface obtained from XPS analysis. Components Binding Energy (eV) FWHMa(eV) At. %
C 1s (CeC, CeH) 285.0 1.1 47 C 1s (CeN/CeO) 286.1 1.6 3.7 C 1s (OeC]O) 288.3 1.5 1.6 O 1s (O2#(iron oxide)) 529.7 1.2 20.8 O 1s
(OH#(iron hydroxide))
531.5 1.5 10.1 O 1s (pollution) 532.4 1.9 1.6 N 1s (NH2) 399.5 1.6 1.6 N 1s (NH3þ) 401.1 2 0.4 Fe 2p3/2 (metal) 706.3 1.8 5.6 Fe 2p3/2 (oxide) 708.0 e 7.6 Total 100 N/C ratio 0.042
Thus, ODA might be adsorbed on a thin iron oxide/hydroxide layer, probably Fe2O3or FeOOH and not directly on the bare carbon steel
surface. The expected theoretical value for the½N 1s'½C#C'ratio in the ODA molecule is 0.055. A smaller value of 0.042 was calculated from the data reported inTable 3. This difference might be due to the surface pollution which increased the CeC contribution.
From the XPS analysis, both the signal from the organic molecules and from the substrate were observed. This indicated that the organic film thickness ranged from 2 nm (thickness of an ODA monolayer) to about 10 nm. This limit value was estimated from the short inelastic mean free path,
l
, of electrons in condensed materials (about 3 nm). The major part of the signal is contained in a depth of 3l
[47], and therefore cannot exceed 10 nm. It must be also mentioned that a spontaneous film thickness reduction, known as “ripening” occurs when ODA self-assembled layers are in contact with air [18,43,44]. Besides, weakly adsorbed multilayers in the electrolyte may be damaged during the electrode removal from the solution [16].4.3. EIS measurements
4.3.1. Graphical method analysis
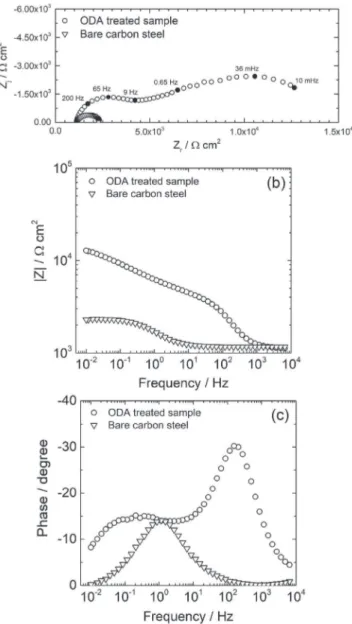
Impedance spectra for the bare carbon steel and the ODA treated sample are presented inFig. 5. The Nyquist diagrams (Fig. 5a) show depressed capacitive loops. For the non-treated sample, only one loop is observed. On the Bode plot (Fig. 5c), the symmetrical shape of the diagram did not indicate the presence of additional time-constants. For the ODA treated sample, the first loop at high-frequency, between 104 and 101 Hz, characterizes the organic
film. This time constant is only visible on the phase angle in the presence of ODA (Fig. 5c). The second capacitive loop, between 101 and 10#2Hz, can be attributed to the processes occurring at the metal/film interface. It was checked that the second loop was little dependent of the electrode rotation rate (diagrams not shown) indicating that this time constant is not due to diffusion phenom-ena in the solution.
First, the impedance data analysis focussed on the high-frequency time constant obtained for the ODA treated sample.
Fig. 6 displays the impedance diagram in Bode coordinates cor-rected from the electrolyte resistance. On the phase angle plot and at high-frequency, a plateau is observed, characteristic of a pure CPE behaviour. The phase angle value on the plateau is
q
¼ 68!.Thus, the CPE parameter
a
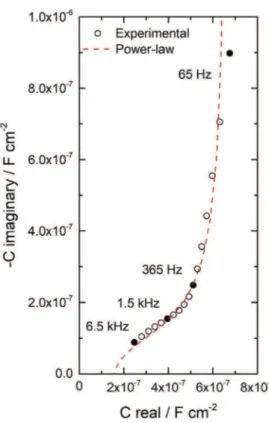
f, is equal to 68:90 ¼ 0.75.Fig. 7presents the complex-capacitance plot corresponding to the curve presented inFig. 6, obtained from Eq.(4). The extrapo-lation of the high-frequency data to the real axis does not allow an accurate determination of the capacitance. However, it is possible
to estimate a film capacitance value (Cf) between 0.1 and
0.2
m
F cm#2. Then, the film thickness can be obtained from Eq.(5).The permittivity of the ODA film is not known. In the literature, permittivity values of self-assembled surfactants were reported and the values ranged from 2 to 3 [48e53]. A value of 2.7, found for bulk ODA [53], was used in Eq.(5)to calculate the film thickness. From the estimation of the film capacitance, the ODA film thickness varied from 12 to 22 nm.
As already mentioned, the high-frequency time constant revealed a non-ideal behaviour described by a CPE (Fig. 6). The CPE parameters (
a
fand Qf) were also graphically determined (Fig. 8). Fig. 8a shows that the absolute value of the slope is 0.75, in agreement with thea
fvalue determined fromFig. 6. InFig. 8b, thehorizontal asymptote provides the Qfvalue (4.14
m
F cm#2s(a#1)). Itwas assumed that the CPE behaviour of the metal/ODA film/elec-trolyte interface was the result of a power-law dependence of the organic film resistivity; thus, the
r
dvalue can be framed by using Eq.(12)with the values of
d
f, Qfanda
fgraphically determined. Ther
0Fig. 5. Electrochemical impedance diagrams obtained at Ecorrfor the bare carbon steel and for the ODA treated sample after 2 h of immersion in the electrolyte: (a) Nyquist plot and (b) impedance modulus and (c) phase angle.
Fig. 6. Impedance diagram in Bode coordinates corrected from the ohmic resistance (Re¼ 1080Ucm2) for the ODA treated sample after 2 h of immersion in the electrolyte.
value can be calculated using Eq.(13)with the value of f0¼ 65 Hz (f0
is the characteristic frequency at the maximum of the imaginary part of the impedance determined inFig. 8a). All the graphically determined parameters were reported inTable 4.
4.3.2. Impedance analysis with the power-law model
The high-frequency part of the diagram (6.5 kHze65 Hz) was regressed from the integral expression of the power-law model (Eq.
(9)). The best fitted curve is shown as dotted line inFig. 7. A good fitting was achieved with a general sum of the deviations between experimental and calculated spectra
c
2 ¼ 0:36. The regressionprocedure provided numerical values of the adjustable parameters (
a
f,r
0,r
d, εfandd
f) relevant to the ODA film. These values werereported inTable 4for comparison with the graphically extracted parameters. A good agreement is obtained between the two pro-cedures (Table 4). The film thickness obtained from the power-law model was equal to 16 nm and the permittivity value was close to the one found in the literature [53]. The values of
r
0,r
danda
fwereused to calculate the in-depth profile of the steel/ODA film/elec-trolyte interface (Eq.(8)). The result is shown inFig. 9. A high re-sistivity area (
r
0 ¼ 1 * 1010U
cm) is observed in a region close tothe metal/film interface. This 2 nm thick layer might correspond to a close-packed ODA monolayer, considering a tilt angle of the ODA aliphatic chains of roughly 15! [43]. Beyond the 2 nm layer, the
resistivity decreases to reach a minimum value of 1.6 * 106
U
cm atthe film/electrolyte interface. These results would indicate a strong interaction between the first ODA layer in contact with the carbon steel surface (or the iron oxide/hydroxide layer). The additional layers would be less compact due to weaker interactions. 4.3.3. Corrosion inhibition efficiency
The ODA film formed on the carbon steel surface was assumed to be strongly adsorbed due to the high resistivity at the carbon steel/ODA film interface (Fig. 9). However, the low impedance values obtained after treatment would be indicative of the presence of porosities in the organic film (through pores). The corrosion process would occur on a reduced surface area. Thus, the second time constant on the impedance diagram for the ODA treated sample can be attributed to the charge transfer process at the bottom of the pores. The impedance diagram for the bare carbon steel and the low-frequency part of the diagram for the ODA treated sample were analysed and discussed below.
The parameters associated to the low-frequency capacitive loop, Qdland
a
dl, as well as the electrolyte resistance, Re, and the chargetransfer resistance, Rt, for the bare carbon steel were graphically
determined. For the ODA treated sample, the Qdland
a
dlparameterscould not be graphically determined due to the strongly depressed capacitive loop. An equivalent circuit (R//CPE) allowed an easier determination of the parameters associated with the low-frequency loop (Fig. 10). The Re, Rt, Qdl, and
a
dlvalues are reportedinTable 5. A value of
a
dl ¼ 0.44 was obtained for the ODA treated sample. This value appeared abnormally weak and may be attrib-uted to a porous electrode behaviour including the formation of pits at the bottom of the pores of the ODA film. Similar low values have been reported in the literature [54].From the CPE parameters, the double layer capacitance (Cdl)
value was calculated, considering a 2D distribution of the charge transfer resistances on the electrode surface, by using the Brug formula [55,56]: Cdl¼ Q 1 a dl '1 Re þ 1 Rt (ða#1Þ=a (14)
The Cdlvalues were 100
m
F cm#2and 12m
F cm#2for the barecarbon steel and for the ODA treated sample, respectively. The
Fig. 7. Complex-capacitance plot corresponding to the EIS spectrum presented in
Fig. 6. The dotted line is the best fitted curve according to Eq.(9).
Fig. 8. (a) Logarithm of the imaginary part of the impedance vs. the logarithm of the frequency and (b) Q as a function of the frequency withaf ¼ 0:75. High-frequency
capacitance for the bare carbon steel is in the range of a double-layer capacitance (z50
m
F cm#2) [25].The ratio of the capacitances for the bare carbon steel and the ODA treated sample gave an insight about the accessible surface
area at the bottom of the through-pores of the ODA film. A value of
12% was obtained. The Rt values were used to calculate the
instantaneous inhibitive efficiency (IE) according to the following equation: IE% ¼ R inh t # R0t Rinh t * 100 (15) with Rinh
t ¼ 11720
U
cm2, the charge transfer resistance for the ODAtreated sample and R0
t ¼ 1175
U
cm2, the charge transfer resistancefor the bare carbon steel. The calculated IE was equal to 90%, in good agreement with the capacitances ratio.
It was shown that the high-frequency CPE behaviour observed for the ODA treated sample can be successfully analysed by a power-law resistivity model linked to the resistivity variation in the ODA layer (non-through pores). On the other hand, the low-frequency CPE behaviour was attributed to the double-layer capacitance at the bottom of the pores. The impedance of the through-pores is usually represented by a resistance, Rpore,
associ-ated to the electrolyte resistance in the porosity. Thus, the equiv-alent circuit commonly used for organic coatings (Fig. 10), appeared appropriate to describe the electrochemical behaviour of the ODA treated carbon steel [57]. InFig. 10, the experimental data are in perfect agreement with the fitted data (
c
2¼ 0.32).Similar results (ODA film thickness, permittivity, resistivity pro-file and inhibitive efficiency) were obtained with another type of steel (100C6 grade) showing that this procedure was reproducible for characterizing thin films behaviour on carbon steel electrodes. 5. Conclusions
In the present study, the physical description of an ODA film formed on a carbon steel surface has been carried out by ex situ (optical observations, drop angle measurements and XPS analysis) and in situ measurements (electrochemical impedance spectros-copy). From the XPS analysis, the film thickness in dry and vacuum conditions was estimated between 2 and 10 nm. The impedance data were analysed with a power-law model to describe the non-ideal behaviour of the system and to extract quantitative parame-ters, such as the dielectric film permittivity and the film thickness. All the regressed parameters were in agreement with those graphically estimated. The (in situ) film thickness was about 16 nm, in the same order of magnitude than that estimated from (ex situ) XPS analysis. The in-depth resistivity profile highlighted a narrow part of high resistivity at the steel/ODA film interface. It was shown that approximately 10% of the carbon steel surface was accessible to the electrolyte, in agreement with an instantaneous inhibitive
Table 4
Graphically extracted values and regressed parameters obtained with the power-law model.
ε r0 (Ucm) rd (Ucm) af df (nm) Re (Ucm2) Graphically extracted values 2.7 [53] 1 * 1010 [1.5 * 106; 2.4 * 107] 0.75 [12; 22] 1080
Regressed parameters 2.8 1 * 1010 1.6 * 106 0.78 16 1080
Fig. 10. (a) Electrical equivalent circuit used to fit the experimental diagram of the ODA treated sample and (b) electrochemical impedance diagram obtained at Ecorrfor the ODA treated sample. The experimental data are fitted with the equivalent circuit in
Fig. 10a.
Fig. 9. ODA film resistivity profile obtained from the impedance analysis (high-fre-quency part) as a function of position calculated from Eq.(8).
Table 5
Extracted parameters from the capacitive loop of the bare carbon steel and the low-frequency loop of the ODA treated sample.
Re (Ucm2) Rt (Ucm2) Qdl (F cm#2s(a#1)) adl Cdl (mF cm#2) IE (%) Bare carbon steel 1157 1175 2.48 * 10#4 0.68 100
e Treated ODA sample 1080 11720 1.3 * 10#4 0.44 12 90
efficiency of about 90%.
This work, based on both the use of graphical methods and of the power-law model for impedance data analysis, gave new in-sights and methodologies for the in situ characterization of organic thin films on conductive surfaces.
References
[1] I. Betova, M. Bojinov, T. Saario, Film-forming Amines in Steam/Water Cycles e Structure, Properties, and Influence on Corrosion, VTT. VTT-R-0323, 2014, pp. 1e41.
[2] C.W. Turner, L. Case, Fouling of nuclear steam generators : fundamental studies, operating experience and remedial measures using chemical addi-tives, AECL Nucl. Rev. 2 (2013) 61e88.
[3] Technical Guidance Document: Application of Film-forming Amines in Fossil, Combined Cycle, and Biomass Power Plants, IAPWS, 2016.
[4] W. Hater, D. Olivet, N. Rudschützky, The chemistry and properties of organic boiler feedwater additives based on film-forming amines and their use in steam generators, Powerpl. Chem. 11 (2009) 90e96.
[5] R. Crovetto, A. Rossi, D. Meskers, C. Pierce, J. Melzer, K. Pearson, State of Knowledge on Film-forming Amines 2015, EPRI, Palo Alto, CA, 2015, 2015. 3002003678.
[6] K. Sipil€a, T. Saario, Effect of Octadecylamine on Carbon Steel Corrosion under PWR Secondary Side Conditions, VTT, 2014, pp. 1e16.
[7] S. Cao, J. Hu, J. Xie, Q. Liang, L. Yin, Research on the film-forming characteristics of octadecylamine at high temperatures, Anti-corrosion Meth. Mater. 60 (2013) 14e19.
[8] Q.-Q. Liao, G.-D. Zhou, H.-H. Ge, L.-M. Qi, Characterisation of surface film on iron samples treated with octadecylamine, Corrosion Eng. Sci. Technol. 42 (2007) 102e105.
[9] H.-H. Ge, G.-D. Zhou, Q.-Q. Liao, Y.G. Lee, B.H. Loo, A study of anti-corrosion behavior of octadecylamine-treated iron samples, Appl. Surf. Sci. 156 (2000) 39e46.
[10] R. Wagner, E. Czempik, Preservation of boilers and turbines with the surface active substance octadecylamine (ODA), VGB PowerTech J 2014 (2014) 2e5. [11] E.V. Chernyshev, E.N. Veprov, V.A. Petrov, S.L. Bogdanov, T.Y. Levina,
T.I. Petrova, V.I. Kashinskii, A.A. Zonov, A.E. Verkhovskii, Increasing the corrosion resistance of equipment due to the use of film-forming amines, Power Technol. Eng. 40 (2006) 34e37.
[12] A.V. Kurshakov, A.V. Ryzhenkov, A.A. Bodrov, O.V. Ryzhenkov, A.A. Patakin, E.F. Chernov, Heat transfer enhancement in steam-turbine condensers with the use of surface-active substances, Therm. Eng. 61 (2014) 785e789. [13] F. Mao, C. Dong, D.D. Macdonald, Effect of octadecylamine on the corrosion
behavior of Type 316SS in acetate buffer, Corrosion Sci. 98 (2015) 192e200. [14] B.N. Khodyrev, A.L. Krichevtsov, A.A. Sokolyuk, Studying the processes relating
to oxidation of organic substances contained in the coolant of thermal and nuclear power stations, Therm. Eng. 57 (2010) 553e559.
[15] R.F.M. Lobo, M.A. Pereira-Da-Silva, M. Raposo, R.M. Faria, O.N. Oliveira, In situ thickness measurements of ultra-thin multilayer polymer films by atomic force microscopy, Nanotechnology 10 (1999) 389e393.
[16] S. Campen, J.H. Green, G.D. Lamb, H.A. Spikes, In situ study of model organic friction modifiers using liquid cell AFM: self-assembly of octadecylamine, Tribol. Lett. 58 (2015).
[17] J. Oviedo, M.A. San-Miguel, J.A. Heredia-Guerrero, J.J. Benítez, Electrostatic induced molecular tilting in self-assembled monolayers of n-octadecylamine on mica, J. Phys. Chem. C 116 (2012) 7099e7105.
[18] K.G. Patil, V. Santhanam, S.K. Biswas, K.G. Ayappa, Combined atomic force microscopy and modeling study of the evolution of octadecylamine films on a mica surface, J. Phys. Chem. C 114 (2010) 3549e3559.
[19] N. Srisuwan, N. Ochoa, N. P!eb#ere, B. Tribollet, Variation of carbon steel corrosion rate with flow conditions in the presence of an inhibitive formu-lation, Corrosion Sci. 50 (2008) 1245e1250.
[20] W. Kuang, J.A. Mathews, D.D. Macdonald, The effect of Anodamine on the corrosion behavior of 1018 mild steel in deionized water:I. Immersion and polarization tests, Electrochim. Acta 127 (2014) 79e85.
[21] W. Kuang, J.A. Mathews, M.L. Taylor, D.D. Macdonald, The effect of Anodamine on the corrosion behavior of 1018 mild steel in deionized water: II. Electro-chemical Impedance Analysis, Electrochim. Acta 136 (2014) 493e503. [22] H. Otmacic Curkovic, E. Stupnisek-Lisac, H. Takenouti, The influence of pH
value on the efficiency of imidazole based corrosion inhibitors of copper, Corrosion Sci. 52 (2010) 398e405.
[23] M. Benoit, C. Bataillon, B. Gwinner, F. Miserque, M.E. Orazem, C.M. S! anchez-s!anchez, B. Tribollet, V. Vivier, Comparison of different methods for measuring the passive film thickness on metals, Electrochim. Acta 201 (2016) 340e347. [24] T. Barr#es, B. Tribollet, O. Stephan, H. Montigaud, M. Boinet, Y. Cohin, Charac-terization of the porosity of silicon nitride thin layers by electrochemical impedance spectroscopy, Electrochim. Acta 227 (2017) 1e6.
[25] S. Chakri, I. Frateur, M.E. Orazem, E.M.M. Sutter, T.T.M. Tran, B. Tribollet, V. Vivier, Improved EIS analysis of the electrochemical behaviour of carbon steel in alkaline solution, Electrochim. Acta 246 (2017) 924e930.
[26] Y. Ben Amor, E. Sutter, H. Takenouti, B. Tribollet, M. Boinet, R. Faure, J. Balencie, G. Durieu, Electrochemical study of the tarnish layer of silver
deposited on glass, Electrochim. Acta 131 (2014) 89e95.
[27] S. Mirhashemihaghighi, J. !Swiatowska, V. Maurice, A. Seyeux, S. Zanna, E. Salmi, M. Ritala, P. Marcus, Corrosion protection of aluminium by ultra-thin atomic layer deposited alumina coatings, Corrosion Sci. 106 (2016) 16e24. [28] M. BenSalah, R. Sabot, E. Triki, L. Dhouibi, P. Refait, M. Jeannin, Passivity of
Sanicro28 (UNS N-08028) stainless steel in polluted phosphoric acid at different temperatures studied by electrochemical impedance spectroscopy and Mott-Schottky analysis, Corrosion Sci. 86 (2014) 61e70.
[29] A.T. Tran, F. Huet, K. Ngo, P. Rousseau, Artefacts in electrochemical impedance measurement in electrolytic solutions due to the reference electrode, Elec-trochim. Acta 56 (2011) 8034e8039.
[30] B.A. Boukamp, A linear Kronig-Kramers transform test for immittance data validation, J. Electrochem. Soc. 142 (1995) 1885.
[31] M. Sch€onleber, D. Klotz, E. Ivers-Tiff!ee, A method for improving the robustness of linear Kramers-Kronig validity tests, Electrochim. Acta 131 (2014) 20e27. [32] Lin-KK tool, (n.d.)http://www.iwe.kit.edu/Lin-KK.php.
[33] M.E. Orazem, N. P!eb#ere, B. Tribollet, Enhanced graphical representation of electrochemical impedance data, J. Electrochem. Soc. 153 (2006) B129eB136. [34] A.S. Nguyen, N. Causse, M. Musiani, M.E. Orazem, N. P!eb#ere, B. Tribollet, V. Vivier, Determination of water uptake in organic coatings deposited on 2024 aluminium alloy: comparison between impedance measurements and gravimetry, Prog. Org. Coating 112 (2017) 93e100.
[35] B. Hirschorn, M.E. Orazem, B. Tribollet, V. Vivier, I. Frateur, M. Musiani, Con-stant-Phase-Element behavior caused by resistivity distributions in films. I: Theory, J. Electrochem. Soc. 157 (2010) C452eC457.
[36] B. Hirschorn, M.E. Orazem, B. Tribollet, V. Vivier, I. Frateur, M. Musiani, Con-stant-Phase-Element behavior caused by resistivity distributions in films. II: Applications, J. Electrochem. Soc. 157 (2010) C458eC463.
[37] T.T.M. Tran, B. Tribollet, E.M.M. Sutter, New insights into the cathodic disso-lution of aluminium using electrochemical methods, Electrochim. Acta 216 (2016) 58e67.
[38] D. You, N. Pebere, F. Dabosi, An investigation of the corrosion of pure iron by electrochemical techniques and in situ observations, Corrosion Sci. 34 (1993) 5e15.
[39] J.J. Chen, N. Winograd, The adsorption and decomposition of methylamine on Pd{111}, Surf. Sci. 326 (1995) 285e300.
[40] D.M. Thornburg, R.J. Madix, Cleavage of NH bonds by active oxygen on Ag(110). II. Selective oxidation of ethylamine to acetonitrile, Surf. Sci. 226 (1990) 61e76.
[41] M. Grunze, R.N. Lamb, Adhesion of vapour phase deposited ultra-thin film polymide films on polycrystalline silver, Surf. Sci. 204 (1988) 183e212. [42] N. Alzate-Carvajal, E.V. Basiuk, V. Meza-Laguna, I. Puente-Lee, M.H. Farías,
N. Bogdanchikova, V.A. Basiuk, Solvent-free one-step covalent functionaliza-tion of graphene oxide and nanodiamond with amines, RSC Adv. 6 (2016) 113596e113610.
[43] J.J. Benítez, M.A. San-Miguel, S. Domínguez-Meister, J.A. Heredia-Guerrero, M. Salmeron, Structure and chemical state of octadecylamine self-assembled monolayers on mica, J. Phys. Chem. C 115 (2011) 19716e19723.
[44] O. Olivares-Xometl, N.V. Likhanova, R. Martínez-Palou, M.A. Domínguez-Aguilar, Electrochemistry and XPS study of an imidazoline as corrosion in-hibitor of mild steel in an acidic environment, Mater. Corros. 60 (2009) 14e21. [45] A.P. Grosvenor, B.A. Kobe, M.C. Biesinger, N.S. McIntyre, Investigation of multiplet splitting of Fe 2p XPS spectra and bonding in iron compounds, Surf. Interface Anal. 36 (2004) 1564e1574.
[46] T. Yamashita, P. Hayes, Analysis of XPS spectra of Fe2þ and Fe3þ ions in oxide materials, Appl. Surf. Sci. 254 (2008) 2441e2449.
[47] D. Briggs, M.P. Seah, Practical Surface Analysis, second ed., John Wiley & Sons, 1993.
[48] M.A. Rampi, O.J.A. Schueller, G.M. Whitesides, Alkanethiol self-assembled monolayers as the dielectric of capacitors with nanoscale thickness, Appl. Phys. Lett. 72 (1998) 1781e1783.
[49] F.S. Damos, R.C.S. Luz, L.T. Kubota, Determination of thickness, dielectric constant of thiol films, and kinetics of adsorption using surface plasmon resonance, Langmuir 21 (2005) 602e609.
[50] F. Gala, G. Zollo, Dielectric properties of self-assembled monolayer coatings on a (111) silicon surface, J. Phys. Chem. C 119 (2015) 7264e7274.
[51] J.J. Benitez, O.R. De La Fuente, I. Díez-P!erez, F. Sanz, M. Salmeron, Dielectric properties of self-assembled layers of octadecylamine on mica in dry and humid environments, J. Chem. Phys. 123 (2005) 1e6.
[52] C.E.D. Chidsey, D.N. Loiacono, Chemical functionality in self-assembled monolayers: structural and electrochemical Properties, Langmuir 6 (1990) 682e691.
[53] D.R. Lide, CRC Handbook of Chemistry and Physics, 84thedition, 2003. [54] Y. Ben Amor, E.M.M. Sutter, H. Takenouti, M.E. Orazem, B. Tribollet,
Inter-pretation of electrochemical impedance for corrosion of a coated silver film in terms of a pore-in-pore model, J. Electrochem. Soc. 161 (2014) 573e579. [55] G.J. Brug, A.L.G. van den Eeden, M. Sluyters-Rehbach, J.H. Sluyters, The analysis
of electrode impedances complicated by the presence of a constant phase element, J. Electroanal. Chem. 176 (1984) 275e295.
[56] B. Hirschorn, M.E. Orazem, B. Tribollet, V. Vivier, I. Frateur, M. Musiani, Determination of effective capacitance and film thickness from constant-phase-element parameters, Electrochim. Acta 55 (2010) 6218e6227. [57] L. Beaunier, I. Epelboin, J.C. Lestrade, H. Takenouti, Etude electrochimique, et
par microscopie electronique a balayage, du fer recouvert de peinture, Surf. Technol. 4 (1976) 237e254.