Any correspondence concerning this service should be sent
to the repository administrator: [email protected]
This is an author’s version published in:
http://oatao.univ-toulouse.fr/21737
To cite this version:
Rota, Thibaut and Jabiol, Jérémy and Chauvet, Éric
and Lecerf, Antoine Phenotypic determinants of
inter-individual variability of litter consumption rate in a detritivore
population.
(2018) Oikos, 127 (11). 1670-1678. ISSN
00301299
Official URL:
https://doi.org/10.1111/oik.05228
Open Archive Toulouse Archive Ouverte
OATAO is an open access repository that collects the work of Toulouse
researchers and makes it freely available over the web where possible
OIKOS
doi: 10.1111/oik.05228 127 1 6 7 0 – 1678
The metabolic theory of ecology predicts resource consumption rates of animals from their body mass, but other phenotypic traits might affect individual resource consumption rate. In this paper, we used a hierarchical framework to examine relation-ships between phenotypic traits thought to constrain variation in per capita resource consumption rate. Physiological and behavioural traits were assumed to be impor-tant in mediating the control of morphology and sex on consumption. We conducted a longitudinal study aiming to relate the consumption rate of submerged leaf litter to sex, morphological, physiological and behavioural traits in an aquatic detritivore population. Then, we analysed the pattern of trait covariation using structural equa-tion modelling (SEM). We observed broad and repeatable inter-individual variaequa-tion in leaf consumption rate and other phenotypic traits. We found that expressing litter consumption rate relative to the time individuals spent feeding revealed and increased the effect of body mass and sex differences, respectively. Accordingly, SEM analyses showed that time allocated to resource acquisition mediated body mass and sex effects on apparent litter consumption rate whose variation was also accounted for by an indicator of activity-specific metabolic rate. Substantial variation in resource consump-tion rate was due to sex difference whereas body mass was of secondary importance. Individual phenotypic trait variations strongly altered consumer–resource relation-ships. Therefore, we encourage studies on consumers’ intraspecific variability to advance knowledge about phenotypic determinants of individual resource consump-tion, an important link between individuals and ecosystems.
Keywords: behavioural type, consumer–resource interaction, energetic balance, gammarids, intraspecific variation, leaf litter, morphology, structural equation modelling (SEM)
Introduction
Animals consume resources at rates spanning over several orders of magnitude and a lot of this variability is explained by body mass (Pawar et al. 2012). This makes sense since large organisms require more energy than smaller ones to maintain essential body functions (Brown et al. 2004). Because energy expenditure is not solely driven ––––––––––––––––––––––––––––––––––––––––
Phenotypic determinants of inter-individual variability of litter
consumption rate in a detritivore population
Thibaut Rota, Jérémy Jabiol, Eric Chauvet and Antoine Lecerf
T. Rota (http://orcid.org/0000-0002-2195-0529) ([email protected]), J. Jabiol (http://orcid.org/0000-0003-4279-2379), E. Chauvet (http:// orcid.org/0000-0001-8676-392X) and A. Lecerf (http://orcid.org/0000-0002-7802-9773), EcoLab, Univ. de Toulouse, CNRS, INP, UPS, 118, route de Narbonne - Bâtiment 4R1, FR-31062 Toulouse Cedex 9, France.
by body mass, mass-independent variations in resource consumption rate are also expected between individuals of a same species or population (see Fig. 2 in Careau et al. 2008). Energy requirement, foraging behaviour and resource consumption rates can differ between sexes due to asym-metric contribution of males and females to reproduction, parental care, and sexual dimorphism (Plaistow et al. 2003, Geffard et al. 2010, Becker et al. 2013, Fryxell et al. 2015). In addition, phenotypic traits beyond sex or body mass should explain the remaining variation in resource consumption rate (Bolnick et al. 2003, Sih et al. 2004, Biro and Stamps 2010). Feeding morphological traits could constrain the handling of resources and reflect trophic specialisation (Araújo et al. 2008). There is also ample evidence that animals can display consistent behavioural differences (Sih et al. 2004, Wolf and Weissing 2012) and such an intraspecific behavioural variability can influence consumer–resource interaction through mass-independent effects (Raffard et al. 2017, Start and Gilbert 2017).
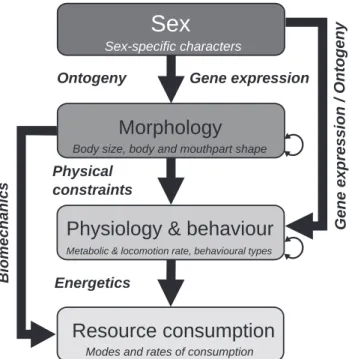
A premise of ecology is to predict the resource con-sumption rates of organisms with their phenotypic traits (Violle et al. 2007, Brousseau et al. 2017). However, cur-rent approaches often assume independence among phe-notypic traits (Verberk et al. 2013). This raises inferential issues (Shipley 2004), since phenotypic traits could be inter-dependent or causally related (Arnold 1983, Garland and Losos 1994, Violle et al. 2007, Careau and Garland 2012, Pey et al. 2014, Coelho et al. 2017, Závorka et al. 2017). Here we use a hierarchical approach (cf. Agrawal et al. 2010) to examine relationships among phenotypic traits (Fig. 1). Resource consumption rate could be directly conditioned upon physiological (e.g. metabolic rate in activity and at rest), behavioural (e.g. time budget) and morphological traits (e.g. shape of mouthparts) and, indirectly, by sex difference. Sex difference may impose limits on the range of morpho-logical, physiological and behavioural traits (Fryxell et al. 2015). Morphology (e.g. body size) is assumed to drive variations in physiological and behavioural traits, and thus to have an indirect effect on consumption rate. Although the reverse holds true (i.e. morphological plasticity is induced by change in physiological traits), the processes underpinning morphological control over physiological and behavioural traits conceivably operate within a shorter period than mor-phological plasticity. The same rationale is applied to the case of allometric scaling relationships between metabolic rate and the size of organisms, as size is viewed as a cause, not a consequence of variation in metabolism (Brown et al. 2004).
To assess the phenotypic determinants of individual varia-tions in resource consumption rates, we measured pheno-typic traits in a wild population of the freshwater amphipod
Gammarus fossarum, which primarily relies on submerged
leaf litter as a food source. We used a longitudinal design where litter consumption rate was measured twice over time. As prerequisites to infer hypothesised traits-to-resource consumption rate causation, we expected repeatable inter-individual differences, and coordinated variations among the
phenotypic traits. Beyond a positive effect of body mass and differences among males and females, we predicted a positive covariation among specific metabolic rate proxies at rest and in activity, alike a positive direct effect of energy expenditure proxies on consumption rates (Careau and Garland 2012). Hierarchical relationships among the traits were examined using structural equation models (SEMs), built relative to our conceptual model and a priori information.
Material and methods
Animal collection and experimental design
We collected gammarids from natural accumulations of submerged leaf litter in a 10 m long reach of a first-order for-ested stream (Lampy, 43°26¢7.3²N; 2°9¢56.8²E; southwestern of France) in January 2016. We immediately transported them in a cool box to the laboratory and held them to a con-stant temperature room set at 9°C (actual mean: 9.28°C, SD = 0.32). We used horticultural LED lightning to create a 11:13 photoperiod light–dark regime with light flux alter-nating between <1 to 198 lux. Two small light bulbs set in opposite corners of the room ensured that there was sufficient illumination to record videos of the microcosms during dark phases. All video captures done in this study were recorded using a video camera pointed vertically downwards, set at 1.3 m above a white laboratory bench.
Metabolic & locomotion rate, behavioural types
Body size, body and mouthpart shape Sex-specific characters
Biomechanics
Resource consumption
Modes and rates of consumption
y n e g ot n O / n oi s s er p x e e n e G
Physiology & behaviour
Morphology
Sex
Energetics Physical constraints
Ontogeny Gene expression
Figure 1. Hierarchical framework for organising the phenotypic traits controlling resource consumption. Each box represents a type of traits (examples are given in italics). Examples of biological mechanisms and processes underpinning causal relationships (arrows) are given in bold italics. Two-headed arrows represent covariations between traits of the same type.
After a one-week acclimation period to room conditions, we sorted gammarids into females and males based on pri-mary sexual characters (i.e. presence of oocytes and first stage embryos for females). We did not consider juveniles in this study because of their low reliance on leaf litter as a food source (Felten et al. 2008). A subset of 78 individuals was selected in such a way that sex- and size-dependent variations of phenotypic traits could be teased apart. There were equal numbers (39) of females and males with body length being distributed over ranges of 8.25–12.29 mm and 8.77–13.89 mm, respectively. We placed animals individually in micro-cosms consisting of food grade plastic containers (diameter: 117 mm, height: 61 mm), filled with 90 ml of spring bottled water, and renewed with 20 ml of water every three days. Gammarids were allowed to feed ad libitum on submerged litter from the stream until five days prior to going through a sequence of two experiments to assess litter consumption rate, time budget, pleopod beat rate, and locomotion veloc-ity. We repeated this sequence twice at a one-week interval to assess the consistency of traits over time. Then, we sacrificed and dissected the individuals before body mass determina-tion and mandible morphometry analyses. Mortality was low (5%) over the study period.
Litter consumption and time budget (experiment 1)
We moved gammarids individually to new microcosms supplied with ash Fraxinus excelsior leaf litter as resource, and containing two 2-cm long pebbles underneath which gam-marids could hide while not feeding. We took care to ensure minimum variability of the palatability of the food items offered to gammarids. We collected abscised leaves of similar appearance (size, colour and toughness) from one tree and cut 10-mm diameter leaf discs using a cork borer, avoiding the central vein. Following the procedure of Jabiol et al. (2013), we conditioned leaf discs for six days in a nutritive liquid medium containing spores of six species of aquatic hyphomy-cetes. Batches of four leaf discs were then freeze-dried, weighed to the nearest 0.001 mg (mean mass: 6.24 mg; SD = 0.57) and stored at –20°C prior being offered to gammarids. Elemental C-to-N ratio of the leaf discs exhibited very small variation around the mean (n = 13, mean = 22.4, CV = 8%).
Each gammarid was allowed to feed on a set of pre-weighed and re-wetted leaf discs for two days. We used ten control microcosms without animal to assess leaf mass loss solely due to leaching and microbial decomposition. At the end of experiment 1, we transferred individuals in new microcosms containing water only. Remaining leaf fragments larger than 1 mm were freeze-dried and weighed. We calculated apparent consumption rate (apparent CR, mg d–1) as follows:
apparentCR =
(
M −M)
− Ti f e
where Mi and Mf are the initial and final dry mass of litter in
microcosms with animals, respectively, ε is the mean mass of
litter lost in control microcosms (n = 10), and T is the experi-ment duration (i.e. 2 days). We calculated an effective rate of
litter consumption (effective CR) by dividing apparent CR by the fraction of time each individual allocated to feeding.
During the feeding experiment, gammarids allocated their time to feed on ash leaf litter, to shelter underneath pebbles, and to move in the microcosm. The relative amount of time spent on each activity (i.e. time budget) was determined based on 15-min video sequences recorded at four occasions, one at daytime and one at nighttime on two consecutive days. We extracted one frame per 30 s from each video sequence using the software VitualDub (ver. 1.10.4). Then, we analysed images to determine the number of occurrences of each type of behav-iour (feeding, sheltering or moving) in light and dark condi-tions. We estimated the relative time allocated to feed, shelter or move (hereafter referred as ‘feeding RD’, ‘sheltering RD’ and ‘movement RD’, respectively, expressed in % of time), by dividing occurrences by the total number of frames analysed.
Ventilation and locomotion velocity (experiment 2)
Twenty-four hours after the end of the feeding experiments, we placed gammarids individually in petri dishes (diameter: 6 cm, height: 2 cm), filled with 15 ml of water and allowed them to acclimate for 1 h. Ventilation activity of pleopods at rest was used as a proxy of mass-specific resting metabolic rate (Vellinger et al. 2012). Not only metabolism at rest but also metabolism when animals are active might affect energetic demands (Humphries and McCann 2014). Consequently, we designed an index combining the locomotion activ-ity duration (i.e. movement RD) with the intensactiv-ity of this locomotion activity (i.e. locomotion velocity). Therefore, this index represents a proxy of the mass-specific metabolism in activity (Peters 1983). We made measurements during light phases. We counted pleopod beats visually over three 30-s periods, after animals had stayed ca 5-min at rest. We summed the number of beats over the three counting periods and expressed them as a rate (beat min–1). After 1 h, we
deter-mined locomotion velocity based on a 5-min video recording of all petri dishes. We then converted the video record to a sequence of images at a rate of one frame every three seconds and analysed them using Image J (ver. 1.46). We tracked individuals between consecutive frames in order to determine their mean locomotion velocity (cm s–1). The index
represent-ing mass-specific metabolism in activity (hereafter referred to ‘velocity × movement RD’) was calculated as the product of mean locomotion velocity (expressed in cm h–1) and
move-ment RD (expressed in h), the latter being assessed in experi-ment 1.
Mandible shape and body mass measurements
Morphological traits were measured after having completed all experiments on living organisms. We sacrificed gammarids by placing them in a freezer set at –20°C. The left mandible of each individual was dissected, mounted on a micro-scopic slide under a glycerol drop, and photographed with a dissecting microscope equipped with a numeric camera at a 40-fold magnification. We then freeze-dried individuals and weighed them to the nearest 0.001 mg.
Morphological analysis
The external shape of mandibles was described by 7 land-marks and 70 semi-landland-marks using the software tpsDig2 ver. 2.3.2 (Rohlf 2005, for details about morphometrics, see Webster and Sheets 2010). After digitisation, we converted landmark and semi-landmark coordinates to warp scores after a superimposition stage, and analysed the correspond-ing shapes uscorrespond-ing the R package ‘geomorph’ (Adams et al. 2017). The two first axes of the principal component analysis (PCA) of warp scores accounted for 60% of the variability of mandible shapes among individuals (n = 71). Deformation grids indicated that the first principal component ‘mandible PC1’ (40% of the variance in the data set) was associated with differences in thickness of the basal part of the man-dible, whereas the second principal component ‘mandible PC2’ (20% of the variance) was associated with differences in curvature of the incisor process (Supplementary material Appendix 1 Fig. A1).
Data analysis
Seven mandibles were broken at the dissection stage, and one and three individuals died during experiment 1 and 2, respectively. Moreover, we excluded one additional individ-ual that displayed an extreme behaviour: it spent 2.1% of its time feeding, while its congeners spent on average 60.3% (± 24.3 SD). Therefore, we used a dataset of 68 observations for multivariate analyses (PCA, PERMANOVA and SEM) as well as for linear models testing for the effects of body mass and sex on other traits. In contrast, we used the totality of observations (147 to 152 observations) available for repeat-ability analyses.
We evaluated the repeatability of traits measured in the two experiments by the mean of the intraclass correlation coefficient (ICC; Dingemanse and Dochtermann 2013). We estimated ICCs using generalised linear mixed-effects mod-els with no fixed effect and individual identity as a random variable. We obtained ICCs and 95% confidence intervals by bootstrapping 1000 samples, and significance was tested using a likelihood ratio test (LRT). We also assessed the repeatabil-ity of traits in terms of covariation pattern. We computed two correlation matrices with trait values determined twice over time, and compared these covariance matrices using the Jennrich test (Jennrich 1970). Trait values and their covaria-tions were consistent over time; therefore, phenotypic vari-ability was assessed based on trait values averaged over trials.
We assessed the main and interactive effects of body mass and sex on phenotypic traits using a two-way permutational multivariate analysis of variance (PERMANOVA), based on the Euclidean distances. We visualised correlations among traits and similarities among individuals using a princi-pal component analysis (PCA). To prevent the influence of trivial correlations on PCA results, we specified sheltering RD and velocity × movement RD as supplementary rather than active variables. The former trait was strongly associated with time spent feeding and moving whereas the latter was intrinsically related with the two traits (i.e. feeding RD and mean locomotion velocity) combined for its calculation. All multivariate analyses were performed using standardised data (mean = 0 and SD = 1).
We analysed traits separately using generalised linear models (Table 1). As the interaction between sex and body mass was not significant in the PERMANOVA, we did not test it in further analyses in order to limit the risk of false discoveries. We assumed a Gaussian error distribution for the
Table 1. Phenotypic traits measured on Gammarus fossarum. Intraclass correlation coefficients (ICC) are displayed along with bootstrap 95% confidence intervals (CI 95%, bootstrap: 1000 samples). The log-likelihood ratio test (LRT) was performed to evaluate the significance of ICC (i.e. ICC > 0). ICC was not calculated for morphological traits, as they were measured once. Apparent consumption rate (*) was estimated assuming that individuals spent 100% of their time feeding. Effective consumption rate (**) was calculated based on the actual feeding duration. ‘–’ indicates non-calculated values for composite traits.
LRT (χ²)
Body mass Sex
Traits ICC (CI 95%) p Mean Range CV (%) F1,65 p F1,65 p
Time budget
Feeding RD (% of time) 0.74 (0.66 – 0.80) 4984.2 <0.001 60.34 15.42 – 100 40.3 31.17 <0.001 6.34 0.01 Sheltering RD (% of time) 0.76 (0.69 – 0.81) 5018.2 <0.001 34.74 0 – 80.42 68.6 32.84 <0.001 4.79 0.03 Movement RD (% of time) 0.72 (0.61 – 0.78) 716.8 <0.001 4.92 0 – 20.83 109.3 0.10 0.75 1.92 0.17 Litter consumption
Apparent consumption rate (mg d–1)* 0.35 (0.13 – 0.53) 9.7 <0.001 0.74 0 – 1.49 51.8 0.82 0.39 3.94 0.05 Effective consumption rate (mg d–1)** – – – 1.55 0 – 8.56 93.0 13.27 <0.001 6.72 0.01 Energy expenditure proxies
Pleopod beat rate (beats min–1) 0.65 (0.50 – 0.76) 40.8 <0.001 142.70 79.7 – 200.0 20.8 2.65 0.11 3.76 0.06 Locomotion velocity (cm s–1) 0.23 (0.02 –0.45) 4.0 0.020 1.02 0 – 3.82 83.2 0.16 0.69 0.49 0.49 Velocity × movement RD (cm) – – – 222.10 0 – 1525 129.6 0.28 0.60 2.36 0.13 Morphology
Mandible PC1 (thickness) – – 73.3 35.10 <0.001 1.19 0.28
Mandible PC2 (incisor process
curvature) – – 81.2 0.00 0.98 3.91 0.05
statistical analyses of all traits except time budget traits, for which we assumed a binomial distribution. Assumptions of generalised linear models were assessed visually using residu-als versus fits plots, which did not reveal serious inferential problems.
Finally, we examined how apparent CR was influenced by phenotypic traits using SEM (Shipley 2004), computed from variance–covariance matrices (function sem in pack-age ‘lavaan’; Rosseel 2012). First, we constructed a minimal model including sex, body size and other important traits selected based on results from multivariate and univariate analyses. We refrained from testing all phenotypic traits at a time because our dataset was not large enough to properly fit complex SEMs. We rather added one or two variables at a time to the minimal model in order to obtain a model exhibiting the best balance between a high r² of apparent CR versus a low AICc. Total, direct and indirect effects and their standard errors were computed based on the results of the final model using the function sem and the delta method (Rosseel 2012). Indirect effects were calculated as the sum of the products of path coefficients along all indirect pathways. Total effects equalled the sum of direct and indirect effects. We performed all statistical analyses using the R software (ver. 3.3.1, < www.r-project.org >).
Data deposition
Data available from the Dryad Digital Repository: < http:// dx.doi.org/10.5061/dryad.j3mk157 > (Rota et al. 2018).
Results
Evidence for inter-individual phenotypic variability
Gammarids spent on average 60% of the time feeding, 35% sheltering underneath pebbles, and 5% moving in the
microcosms (values extrapolated over the 48 h experimen-tal period). They consumed 0.74 mg leaf litter per day. This value was twice as low as the grand mean rate of effective CR (1.55 mg d–1 if individuals spent 100% of their time feeding).
Individuals performed, on average, 143 pleopod beats per minute at rest and moved at a rate of 1 cm s–1. The body mass
of gammarids determined at the end of the study varied over a ten-fold range. We detected substantial variations around the mean in all traits assessed in this study (CV = 21–130%; Table 1).
ICC always significantly departed from zero with values ranging from 0.23 to 0.76. Mean locomotion velocity (ICC = 0.23) and apparent CR (ICC = 0.35) were moderately repeatable whereas pleopod beat rate and time budget traits were highly repeatable (from ICC = 0.65 to 0.76, respec-tively). The consistency of traits was also highlighted by the statistically indistinguishable covariance matrices of the traits assessed in the two trials (Jennrich test: χ2
15= 9.52, p = 0.85). Patterns of trait covariation
A two-way PERMANOVA test indicated that sex (F1,64= 3.10,
p < 0.01, r2= 0.04) and body mass (F
1,64= 11.50, p < 0.001,
r2= 0.14) accounted for significant variations in other traits.
The mass-by-sex interaction was not significant (F1,64= 1.18,
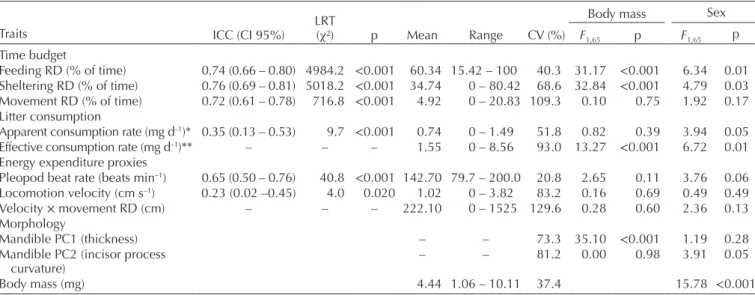
p = 0.30, r² = 0.02), suggesting that body mass was equally important in determining phenotypic variations in males and females. A PCA of quantitative traits showed that body mass correlated positively with mandible PC1 and sheltering RD (included as a supplementary variable), and negatively with feeding RD (Fig. 2a). These three traits had by far the highest loadings on the first principal component (PC1), which cap-tured 30.3% of the total variance in the traits specified as active variables in the analysis. PC1 also discriminated males and females, the latter having on average lower scores than the former (Fig. 2b). PC2 was largely unrelated to sex and body mass, yet it still captured substantial phenotypic variation
−1.0 −0.5 0.0 0.5 1.0 −1.0 −0.5 0.0 0.5 1.0 PC1 (30.3%) PC2 (21.3%)
pleopod beat rate
feeding RD movement RD locomotion velocity mandible PC1 body mass mandible PC2 velocity x movement RD sheltering RD −3 −2 −1 0 1 2 3 −3 −2 −1 0 1 2 3 PC1 (30.3%) PC2 (21.3%) (a) (b)
Figure 2. Principal component analysis of phenotypic traits. The correlation circle (a) and ordination plot of the individuals (b) were drawn for the two first principal components, which condensed 51.6% of the total variation in phenotypic traits within the dataset. Traits in regular characters were specified as active variable and those in bold characters were included as supplementary variables (a). Solid and open dots depict males and females, respectively (b). The convex hull of all individuals of the same sex is also displayed.
(21.3%). PC2 was primarily related to specific metabolism proxies. Pleopod beat rate, movement RD, locomotion veloc-ity and their product (velocveloc-ity × movement RD; included as a supplementary variable) loaded positively on PC2 whereas the scores of the second axis of mandible shapes (mandible PC2) had a negative loading. The product velocity × move-ment RDcontributed the most to PC2 (Fig. 2a).
Explaining inter-individual variation in litter consumption rate
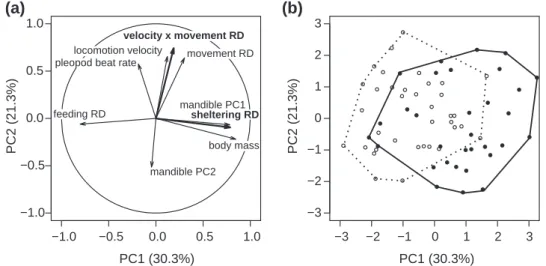
The body mass of animals did not predict their apparent consumption rate (F1,65= 0.82, p = 0.37). We observed only
a small difference between males and females (F1,65= 3.94,
p = 0.05, Fig. 3a). When we took the actual amount of time that individuals allocated to feed into account (effective CR), the effect of body mass became significant and the effect of sex was stronger (Table 1, Fig. 3b). Effective CR increased significantly with body mass (F1,65= 13.27, p < 0.001) and
was on average higher in males than in females (F1,65= 6.72,
p = 0.01; Fig. 3b). These results were not strongly influenced by three outliers displaying extremely high effective CR (4–9 mg d–1). These three individuals were those that spent
the least time feeding, explaining their high effective CR. The relationship between apparent CR and body mass did not provide evidence for allometric scaling, since the power-law exponent was close to zero (non-linear estimation: b = 0.16 ± 0.15 SE, t1,65= 1.04, p = 0.30; Fig. 3a). This was not the case
either for the relationship between effective CR and body mass, since the power law exponent was closer to 1 (non-linear estimation: b = 0.93 ± 0.31 SE, t1,65= 3.04, p < 0.01;
Fig. 3b).
We constructed a first SEM based on the hypothesized hierarchical relationships among phenotypic traits (cf. Fig. 1) and abovementioned results. We found that both sex and body mass affected indirectly apparent CR through feeding RD, but also that sex had direct (i.e. mass-independent) effects on feeding RD and apparent CR (Fig. 4a). As this model explained very little variance in apparent CR (r² = 0.13), we sought to identify further predictors (Supplementary mate-rial Appendix 2). We found that the r2-value for apparent
CR almost doubled when we added the proxy for specific metabolism in activity (velocity × movement RD) into SEMs. This trait had a direct effect on apparent CR whereas, unlike feeding RD, it was independent of sex and body mass (Fig. 4b; Supplementary material Appendix 2). The initial (Fig. 4a) and final (Fig. 4b) models provided comparable estimates of path coefficients, yet the former was more parsi-monious than the latter (AICc = 643 versus 826).
Total effect estimates for phenotypic traits revealed that inter-individual variation in apparent CR was primarily due to sex differences (p = 0.02; Fig. 4c). Feeding RD and velocity × movement RD still had a substantial influence on appar-ent CR (p < 0.01). In contrast, body mass differences did not significantly account for variation in apparent CR (0.06, p = 0.61). Partitioning total effect into direct and indirect components revealed that direct effects were by far the most
important in determining how phenotypic traits controlled apparent CR in this study. In contrast, estimates for indirect effects were not significant for all traits, except for body mass (p = 0.03; Fig. 4c).
(a)
(b)
Figure 3. Apparent (a) and effective (b) consumption rate of litter by gammarids as a function of body mass. Solid and open dots depict males and females, respectively. Black and grey lines are inter-cepts (a) and regression lines (b) for males and females, respectively. r2-values are computed from a model including body mass and sex as main effects.
Discussion
The hierarchical framework we designed to assess intrinsic determinants of individual resource consumption rate was useful to organise hypotheses about how phenotypic traits drive variation in resource consumption rate and to assess the relative importance of hypothesised relationships. Two a priori predictions were supported by our data: 1) litter consumption rate was controlled by physiological (a proxy of specific metabolism in activity) and behavioural (feed-ing RD) traits and 2) the behavioural trait was constrained by sex and body mass. In contrast, we did not expect that a strong influence of sex on litter consumption rate would be transmitted through a direct pathway. As sex had an influence on feeding RD, a significant indirect effect of sex on litter consumption rate was expected to occur. This was not the case, conceivably because the apparent direct effect of sex on resource consumption was, in fact, mediated by unmeasured traits linked to resource consumption.
There are many reasons why female and male gammarids are different in terms of resource consumption. The a priori higher energy demand in females, associated with egg and embryos production as well as their ventilation (Geffard et al. 2010), should be balanced by a higher resource consump-tion than in males. However, the mate-guarding behaviour of male gammarids may be energetically costly (Plaistow et al. 2003, Becker et al. 2013). In our study, while female gam-marids did exhibit higher pleopod beat rates than males, reflecting higher standard metabolic rates, they also ingested resource at lower rates for the same amount of time spent to feed (lower effective CR, Fig. 3b). A possible explanation is that females compensated the energetic cost inherent to
reproduction by selecting the highest quality resource patches, which is consistent with the longer feeding duration observed in females (Fig. 4b). The ability to select the most nutritive patches at the surface of the leaf mosaic (Bärlocher 1985) could thus be higher in females, and be related to subtle dif-ferences in mandible shape between sexes (i.e. higher curva-ture of the incisor process for females). Intuitively, a curved incisor process for females is better suited to graze leaves on a 2d space, while streamlined incisor processes for males might be an advantage for shredding leaves (Supplementary mate-rial Appendix 1 Fig. A1). A close examination of the shape of leaf discs at the end of the feeding experiments provided evidence that females indeed grazed the surface of leaf discs, while males shredded at their edge (Supplementary material Appendix 1 Fig. A3).
In this study, resource consumption rate varied over a wide (ca one order of magnitude) range and, as expected, individ-ual differences were repeatable. A recent study has reported similarly large and temporally-consistent individual variation in litter consumption rate in an omnivorous crayfish spe-cies (Raffard et al. 2017). Another common thread between these studies was that body size explained little variation in resource consumption rate at the intraspecific level. A tight size-consumption relationship is expected when it is inferred from interspecific data encompassing many orders of mag-nitude variation (Pawar et al. 2012). As we narrow down the range of body size variation, such as in studies of single species, mass-dependent variation in consumption rate may become less prominent (Maino and Kearney 2015).
Small-sized individuals are known to invest more energy in growth than large individuals, which exhibit small biomass production (Brown et al. 2004, Houston and McNamara
Total Direct Indirect
Traits Sex Feeding RD V x m. RD Body mass Standard ef fects −0.4 −0.2 0.0 0.2 0.4 0.6 0.8 1.0 (c) 0.88 P< 0.0001 _ 0.43 P< 0.0001 0.31 P= 0.03 0.13 P= 0.37 0.69 P= 0.01 _ 0.55 P= 0.01 Body mass Feeding RD Apparent CR 0.19 0.37 0.13 Model 1: n= 68, k= 9; Chi²= 0.80; df= 1; P= 0.37; AICc= 643; TLI= 1.03; RMSEA= 0.00 (0 - 0.31); SRMR = 0.03 (b) (a) Sex Sex Body mass
Figure 4. (a) Initial structural equation model describing how a behavioural trait (Feeding RD) constrains the effects of body mass and sex on apparent consumption rate of litter. (b) Final structural equation model including a physiological trait used as a proxy of specific metabo-lism in activity (‘V × m. RD’). Black and red arrows indicate positive and negative relationships, respectively, and the size of arrows is proportional to path coefficients (i.e. beta estimates). The signs of path coefficients of ‘Sex’ correspond to the effect of male compared to that of female gammarids. The two-headed arrow represents covariances. r2-values are given in bold. The boxes below the models contain summary statistics. A valid model should have a χ² p-value > 0.05, RMSEA < 0.06, TLI > 0.90 and SRMR < 0.08. (c) Barplots of total, direct and indirect effects assessed in the final model shown in panel (b). Error bars are standard errors (SE).
2014). Here, the behaviourally-mediated body mass effect on consumption rates (Fig. 3, 4c), may reveal a tradeoff between survival and energy intake rates. The rationale is that older individuals, which have a high reproductive value, should adopt a behaviour that minimises mortality whereas younger individuals should seek for rapid growth (Biro et al. 2005, Killen 2011, Houston and McNamara 2014). This tradeoff may explain why small individuals spent more time feeding in our study, unlike larger ones, which spent more time in shel-ters (Fig. 2a). Additionally, the size and shape of mandibles may also determine how much time gammarids spent feeding on leaf litter. However, the biomechanical explanation is not supported by our results, as no significant relationship was found between feeding RD and mandible morphology axes (Supplementary material Appendix 1 Fig. A2b–c).
As behavioural traits measured in our study were repeat-able and covaried together, our results lend support for the existence of behavioural types in the gammarid population investigated (Sih et al. 2004). The behavioural type is defined here in term of activity energy expenditure assessed by the mean of the velocity × movement RD index (see PCA axis 2 in Fig. 2a). Moreover, covariations between physiological and behavioural traits (Fig. 2a), as well as the positive effect of the velocity × movement RD index on litter consumption rate (Fig. 4b), indicate that gammarid individuals were distrib-uted along a continuum of energy turnover from slow to fast rates. This is consistent with the POLS hypothesis (Biro and Stamps 2008, 2010, Réale et al. 2010). The POLS hypothesis states that aggressive and bold individuals displaying highest locomotion activity exhibit also higher standard metabolic rate. This is because fast metabolism can sustain energeti-cally costly behaviours, but in turn requires a higher energy intake rate (Careau et al. 2008, 2014, Biro and Stamps 2010, Careau and Garland 2012).
Proxies used to assess standard and in activity specific metabolic rates were not significantly related (Supplementary material Appendix 1 Fig A2d). Biro et al. (2016) found simi-lar results, and observed that swimming activity levels in gup-pies did not relate significantly with resting metabolic rate, while it was related with peak metabolic rate. In our study, the gammarids expressing high locomotion activity tended to spend a little time feeding on leaf discs, while consuming large amounts of litter. This might indicate that such active individuals adopted a pulse foraging strategy (Biro et al. 1996, 2016).
A commonplace tenet in ecology is that the effects of phenotypic variability on ecosystems are higher among species than between populations or individuals of a same species. However, this postulate should be revised down-ward, since meta-analyses have shown that intra- and inter-specific variability are almost equally important in mediating the biotic control on ecosystems (Palkovacs et al. 2015, Des Roches et al. 2018). Although the present study was not designed to compare magnitudes of biological variations across levels of organisation, it provides evidence that intra-specific variability of consumption rate within a population of litter consumers have phenotypic determinants. Litter
consumption is an important mechanism through which lit-ter decomposition occurs (Gessner et al. 2010) and, there-fore, this fundamental ecological process may be affected by phenotypic changes in detritivore populations.
Acknowledgements – We thank Frédéric Julien and Sylvain Lamothe
for providing technical assistance and Charlotte Evangelista for sharing her expertise in morphological analyses.
Funding – TR was funded by a PhD scholarship from the French
ministry of research and education.
Author contributions – TR, EC and AL organised the ideas and
conceived the experimental design; TR, AL and JJ performed the experimental work; TR analysed the data and wrote the first draft of the paper, with guidance from AL, JJ and EC. All authors participated in drafting the paper and revising it, and gave final approval of the revised version to be submitted.
Conflicts of interest – We have no conflicts of interest to declare.
References
Adams, D. C. et al. 2017. Geomorph: Software for geometric morphometric analyses. – R package ver 3.0.5. <https://cran.r-project.org/package=geomorph>.
Agrawal, A. A. et al. 2010. Tradeoffs and negative correlations in evolutionary ecology. – In: Bell, M. A. et al. (eds), Evolution after Darwin: the first 150 years. Sinauer, pp. 243–268. Araújo, M. S. et al. 2008. Network analysis reveals contrasting
effects of intraspecific competition on individual vs. population diets.– Ecology 89: 1981–1993.
Arnold, S. J. 1983. Morphology, performance and fitness. – Am. Zool. 23: 347–361.
Bärlocher, F. 1985. The role of fungi in the nutrition of stream invertebrates. – Bot. J. Linn. Soc. 91: 83–94.
Becker, J. et al. 2013. Mate guarding in relation to seasonal changes in the energy reserves of two freshwater amphipods (Gammarus
fossarum and G. pulex). – Freshwater Biol. 58: 372–381.
Biro, P. A. and Stamps, J. A. 2008. Are animal personality traits linked to life-history productivity? – Trends Ecol. Evol. 23: 361–368.
Biro, P. A. and Stamps, J. A. 2010. Do consistent individual differences in metabolic rate promote consistent individual differences in behavior? – Trends Ecol. Evol. 25: 653–659. Biro, P. A. et al. 1996. Does the rate of foraging attempts predict
ingestion rate for young-of-the-year brook trout (Salvelinus
fontinalis) in the field? – Can. J. Fish. Aquat. Sci. 53: 1814–1820.
Biro, P. A. et al. 2005. Ontogeny of energy allocation reveals selective pressure promoting risk-taking behaviour in young fish cohorts. – Proc. R. Soc. B 272: 1443–1448.
Biro, P. A. et al. 2016. Stress-induced peak (but not resting) metabolism correlates with mating display intensity in male guppies. – Ecol. Evol. 6: 6537–4655.
Bolnick, D. I. et al. 2003. The ecology of individuals: incidence and implications of individual specialization. – Am. Nat. 161: 1–28. Brousseau, P.-M. et al. 2017. Trait matching and phylogeny as
predictors of predator–prey interactions involving ground beetles. – Funct. Ecol. 32: 1–11.
Brown, J. H. et al. 2004. Toward a metabolic theory of ecology. – Ecology 85: 1771–1789.
Careau, V. and Garland, T. Jr. 2012. Performance, personality, and energetics: correlation, causation and mechanism. – Physiol. Biochem. Zool. 85: 543–571.
Careau, V. et al. 2008. Energy metabolism and animal personality. – Oikos 117: 641–653.
Careau, V. et al. 2014. Adding fuel to the ‘fire of life’: energy budgets across levels of variation in ectotherms and endotherms. – In: Martin L. B. et al. (eds), Integrative organismal biology. Wiley, pp. 219–234.
Coelho, P. et al. 2017. A ‘striking’ relationship: scorpion defensive behaviour and its relation to morphology and performance. – Funct. Ecol. 31: 1390–1404.
Des Roches, S. et al. 2018. The ecological importance of intraspe-cific variation. – Nat. Ecol. Evol. 2: 57–64.
Dingemanse, N. J. and Dochtermann, N. A. 2013. Quantifying individual variation in behaviour: mixed-effect modelling approaches. – J. Anim. Ecol. 82: 39–54.
Felten, V. et al. 2008. Quantification of diet variability in a stream amphipod: implications for ecosystem functioning. – Fundam. Appl. Limnol. 170: 303–313.
Fryxell, D. C. et al. 2015. Sex ratio variation shapes the ecological effects of a globally introduced freshwater fish. – Proc. R. Soc. B 282: 20151970.
Garland, T. Jr. and Losos, J. 1994. Ecological morphology of locomotor performance in squamate reptiles. – In: Wainwright P. C. and Reilly S. (eds), Ecological morphology: integrative organismal biology. Univ. of Chicago Press, pp. 240–302. Geffard, O. et al. 2010. Ovarian cycle and embryonic development
in Gammarus fossarum: application for reproductive toxicity assessment. – Environ. Toxicol. Chem. 29: 2249–2259. Gessner, M. O. et al. 2010. Diversity meets decomposition.
– Trends Ecol. Evol. 25: 372–380.
Houston, A. I. and McNamara, J. M. 2014. Foraging currencies, metabolism and behavioural routines. – J. Anim. Ecol. 83: 30–40.
Humphries, M. M. and McCann, K. S. 2014. Metabolic ecology. – J. Anim. Ecol. 83: 7–19.
Jabiol, J. et al. 2013. Trophic complexity enhances ecosystem func-tioning in an aquatic detritus-based model system. – J. Anim. Ecol. 82: 1042–1051.
Jennrich, R. I. 1970. An asymptotic χ² test for the equality of two correlation matrices. – J. Am. Stat. Assoc. 65: 904–912. Killen, S. S. 2011. Energetics of foraging decisions and prey
handling. – In: Farell A. P. (ed.), Encyclopedia of fish physiology: from genome to environment. Academic Press, pp. 1588–1595. Maino, J. L. and Kearney, M. R. 2015. Ontogenetic and
interspecific scaling of consumption in insects. – Oikos 124: 1564–1570.
Palkovacs, E. P. et al. 2015. Ecological effects of intraspecific consumer biodiversity for aquatic communities and ecosystems. – In: Belgrano, A. et al. (eds), Aquatic functional biodiversity – an ecological and evolutionary perspective. Elsevier, Academic Press, pp. 37–51.
Pawar, S. et al. 2012. Dimensionality of consumer search space drives trophic interaction strengths. – Nature 486: 485–489. Peters, R. H. 1983. The ecological implications of body size.
– Cambridge Univ. Press.
Pey, B. et al. 2014. Current use of and future needs for soil invertebrate functional traits in community ecology. – Basic Appl. Ecol. 15: 194–206.
Plaistow, S. J. et al. 2003. Energetically costly precopulatory mate guarding in the amphipod Gammarus pulex: causes and consequences. – Anim. Behav. 65: 683–691.
Raffard, A. et al. 2017. The functional syndrome: linking individual trait variability to ecosystem functioning. – Proc. R. Soc. B 284: 20171893.
Réale, D. et al. 2010. Personality and the emergence of the pace-of-life syndrome concept at the population level. – Proc. R. Soc. B 365: 4051–4063.
Rohlf, F. J. 2005. tpsDIG2. A program for landmark development and analysis. – <http://life.bio.sunysb.edu/morph/>.
Rosseel, Y. 2012. lavaan: an R package for structural equation mod-eling. – J. Stat. Softw. 48: 1–36. <www.jstatsoft.org/v48/i02/>. Rota, T. et al. 2018. Data from: Phenotypic determinants of inter-individual variability of litter consumption rate in a detritivore population. – Dryad Digital Repository, <http://dx.doi. org/10.5061/dryad.j3mk157>.
Shipley, B. 2004. Cause and correlation in biology: a user’s guide to path analysis, structural equations and causal inference. – Cambridge Univ. Press.
Sih, A. et al. 2004. Behavioral syndromes: an ecological and evolutionary overview. – Trends Ecol. Evol. 19: 372–378. Start, D. and Gilbert, B. 2017. Predator personality structures prey
communities and trophic cascades. – Ecol. Lett. 20: 366–74. Vellinger, C. et al. 2012. Behavioural and physiological responses
of Gammarus pulex exposed to cadmium and arsenate at three temperatures: individual and combined effects. – PloS One 7(6): e39153.
Verberk, W. C. E. P. et al. 2013. Delivering on a promise: integrat-ing species traits to transform descriptive community ecology into a predictive science. – Freshwater Sci. 32: 531–547. Violle, C. et al. 2007. Let the concept of trait be functional! – Oikos
116: 882–892.
Webster, M. and Sheets, H. D. 2010. A practical introduction to landmark-based geometric morphometrics. – In: Alroy J. A. and Hunt G. (eds), Quantitative methods in paleobiology. Paleontol. Soc., pp. 163–188.
Wolf, M. and Weissing, F. J. 2012. Animal personalities: conse-quences for ecology and evolution. – Trends Ecol. Evol. 27: 452–461.
Závorka, L. et al. 2017. Co-existence with non-native brook trout breaks down the integration of phenotypic traits in brown trout parr. – Funct. Ecol. 31: 1582–1591.