Open Archive TOULOUSE Archive Ouverte (OATAO)
OATAO is an open access repository that collects the work of Toulouse researchers and
makes it freely available over the web where possible.
This is an author-deposited version published in :
http://oatao.univ-toulouse.fr/
Eprints ID : 17247
The contribution was presented at LAK 2016 :
http://css-kmi.tugraz.at/mkrwww/leas-box/lakws16/home.html
To cite this version : Venant, Rémi and Vidal, Philippe and Broisin, Julien
Learning Analytics for Learner Awareness in Remote Laboratories Dedicated to
Computer Education. (2016) In: Workshop on Learning Analytics for Learners
in 6th International Conference on Learning Analytics and Knowledge (LAK
2016), 26 April 2016 (Edinburgh, United Kingdom).
Any correspondence concerning this service should be sent to the repository
administrator: [email protected]
Learning Analytics for Learner Awareness in Remote
Laboratories Dedicated to Computer Education
Rémi Venant
Université Toulouse III Paul Sabatier
+33 561 558 296
[email protected]
Philippe Vidal
Université Toulouse III Paul Sabatier
+33 561 557 402
[email protected]
Julien Broisin
Université Toulouse III Paul Sabatier
+33 561 557 402
[email protected]
ABSTRACT
This paper addresses learning analytics for learner awareness in remote laboratories. The objectives we identified to provide self- and social awareness while learners are practicing in their virtual learning environment are threefold: (1) the definition of a performance metric that requires no assessment tests, (2) the tracking of data to infer that metric in real time, (3) the visualization of the performance metric to provide learners with awareness, without impacting learners’ cognitive load. To support these needs, we propose a metric related to our context of computer education, a generic tracking framework, and visualization tools. All of these suggestions have been implemented in Lab4CE, a remote laboratory management system for computer education currently in use within our university..
Keywords
Remote laboratory, awareness, learning analytics, computer education
1. INTRODUCTION
Remote laboratories rely on inquiry-based learning that leads, among other outcomes, to knowledge building, deep learning and reflection [9]. In Technology Enhanced Learning (TEL), self-awareness appears to be an important factor to support these outcomes [11], and thus became the focus of several studies in computer-mediated research [23, 24, 38]. Moreover, inquiry learning relies on social constructivism, a theory that defines learning as shared and constructed in the context of relationships with others [35]. Social awareness is also an important factor regarding learner’s development [13] that should be provided to learners [2, 5].
To support learners’ cognition, remote laboratory environments
should then provide both self- and social awareness. Learning analytics (LA) processes to track, analyze and report learners’ data are able to support such awareness [33] and to improve learning [34]. Efforts have already been made to apply learning analytics tools to remote laboratories [27, 30]. However, none of them embraces both issues of awareness for learners and learning analytics for remote laboratories.
We address in this article the question of providing learners with a remote laboratory featuring self- and social awareness through learning analytics. The presented work was achieved in the context of Lab4CE, a remote laboratory for computer education [4]. In the next section, we expose recent works on learning analytics for learner awareness. The third part deals with the measure of learners’ performance for practical sessions, a critical information that must be provided to users [1] and that cannot be retrieved from traditional assessment technics such as quizzes or evaluations of learning paths; indeed, practical activity in a remote laboratory happens before any achievement test. We propose a metric of performance that fits our pedagogical and technical contexts, and a client side XAPI framework to track learners’ activity and infer metrics. Based on this metric, we then introduce two learning analytics tools to report on actions carried out by learners, as well as their level of performance while they are practicing in the remote laboratory.
2. LEARNING ANALYTICS FOR
LEARNER AWARENESS
Learning analytics were defined during the 1st International conference on learning analytics in 2011 as “the measurement, collection, analysis and reporting of data about learners and their contexts, for purposes of understanding and optimizing learning and the environments in which it occurs”. They target two main goals: recommendation & visualization [10]. The former relies on the system to ensure the analysis and take decisions, whereas visualization, among others goals [34], can provide users with awareness about the learning environment they are involved in, and thus let them take their own decisions. Hence, visualization can be used as cognitive tools for learners or teachers [33]. SocialLearn is a social media space designed to support social learning [12]. It exploits data from different sources (i.e., the SocialLearn website, the Open University and social media sites used by learners such as LinkedIn or Twitter) to provide visualization and recommendation through different analytics. SocialLearn is built on a three tiers architecture composed of (1) an identity server that supplies data from the sources to a (2) recommendation engine, which processes data for further analysis, and (3) a delivery channel. The delivery channel includes the SocialLearn website, a browser toolbar and various
applications embedded into external websites. These delivering systems are used as both providers (i.e., they send data to the identity server) and consumers (i.e., they expose to users recommendations and/or visualizations of information supplied by the recommendation engine). Many individual and group analytics are proposed through a LA dashboard. For instance, the view “Learning dialogue analytics” summarizes the learner usage of different types of dialogues based on sociocultural discourse analysis [21], while the view “My learning network” exposes the different interactions the learner had with others.
In a similar approach, Govaerts et al. [14] proposed the Student Activity Meter (SAM) to support awareness for teachers and learners through visualizations based on various metrics. SAM analyses data expressed using the Contextualized Attention Metadata (CAM) format, and presents them in a detailed dashboard that allows dimension drilling and filtering: it acts as a multi-dimensional analysis tool such as ClickView©.
FORGE is a European initiative for online learning and experimentation via interactive learning resources. It proposes learning analytics to support awareness and reflection for teachers and learners [23]. Widgets inside ebooks and online courses track learners interactions with the course materials and with each other using the Tin Can API (XAPI). Learning analytics aim at evaluating learners (beside surveys and questionnaires) and provide them (as well as teachers) with awareness about the results of the evaluation process. Like in SocialLearn or SAM, awareness is supported by visualizations within dashboards offered by the Learning Locker LRS (Learning Record Store). Rich dashboards offering different visualization and exploration features seem to be a common exploitation of learning analytics for awareness. Visualization of learners’ performance is also frequent, as all of these tools offer analytics on performance metrics. Though, the context of a practical session in a remote laboratory raises several issues. Awareness about learners’ performance during a session cannot be achieved through traditional performance measurements based on assessments, such as in FORGE or other studies that rely on achievement tests [18, 29]. Since a practical session mostly happens before any assessment, the performance metric needs to be live-computed, based on actions performed by learners during the session. For instance, the metric based on the number of programming errors a student had done proposed in [14] could be used in a programming remote laboratory.
Awareness in the context of a practical learning situation also requires synchronization between learners’ actions and information returned back to them: it should reflect what just happened, which implies near real-time processing and automatic updates of visualization. In SAM, data seem to be loaded asynchronously (i.e., on demand); SocialLearn does not clearly define if their architecture can address such real-time requirement. Learning Locker LRS, used in FORGE, addresses this issue through an architecture based on Web Socket; other works also adopt this learning analytics infrastructure to return immediate feedback to learners [15].
Finally, the use of dashboards like SocialLearn, SAM or FORGE LRS forces learners to switch between the visualization GUI and the interface allowing operating the laboratory. Simpler visualizations, embedded as a lightweight component like in the ROLE context [31], would prevent such additional cognitive load. Widgets can be easily integrated into existing applications and provide portability and reusability of visualizations [36].
However, adding widgets to an existing interface can lead to a busy screen design that may become irrelevant and cause learning problems [6]. Kirsh [17] thus suggests avoiding split attention of learners that happens when different components on a screen require multitasking to integrate disparate sources of information. Also, the choice of the visualization itself is important since it depends on the goal targeted [10]. We must try to not raise learners’ cognitive load with visualizations that require time and cognition to be understood and analyzed.
These approaches cannot be reused directly in our context. Unlike them, we must propose fitted metrics and lightweight visualizations to use for a practical session. However, we will follow the web architecture based on full-duplex communication like Web Socket that addresses real-time requirement.
3. LEARNER PERFORMANCE IN THE
LAB4CE ENVIRONMENT
We propose here a metric relying on actions performed by learners during a practical session. We also suggest a model of trace to record this metric (among other data) in respect with the XAPI specification. Finally, we describe a tracking framework that addresses the technical requirements we identified previously to collect these traces and compute the level of performance.
3.1 Pedagogical Context
Our education field is the remote practical learning of Computer Science Education (CSE). Practical activities, referred to as “any learning and teaching activity that engages learners in manipulating and analyzing real and physical objects”, involve learners and teachers in a laboratory (lab), a spatial and temporal space hosting devices used for experiments [3]. CSE, within that context, presents a large variety of experiments depending on the field of teaching. For instance, programming language learning requires at least a text editor and a compiler, while database learning needs at least a database server and a client to access it. However, the resources for practical experiments are all computers configured for a certain experiment (i.e., providing the hardware and software required to achieve the pedagogical objectives), and interactions between learners and these resources are either based on CLI (Command Line Interface) or GUI (Graphical User Interface). The evaluation of these interactions can be used to study how learners cope with the system(s) they must manipulate to perform the experiment. Thus we propose here to focus on these interactions to infer a performance metric.
3.2 Technological Support: Lab4CE
3.2.1 Functional Presentation
Lab4CE is a remote laboratory environment for computer education standing on existing virtualization tools to benefit from their advanced computational features, and integrating original scaffolding tools and services to improve the user experience and to increase students’ engagement in practical activities.
Lab4CE includes different features through several web applications. The design of an experiment (i.e., the different machines, their configuration and their topology) is achieved thanks to a WISIWIG interface that offers the opportunity to draw the experiment and configure each of its components (e.g., adding a software to or choosing the operating system of a given machine). For all learners, a set of virtual machines and networks configured properly according to the experiment’s design will be automatically created in a cloud manager as soon as they start their practical session.
Learners can then control (i.e., start, shut down or put in sleep mode) their machine(s) and send instructions through a web terminal included into a Rich Learning Interface (RLI) shown in Figure 1. In addition to these control capabilities, the RLI integrates communication functions through an instant messaging system; all participants of an experiment are able to talk to each other using the public chat room, or a dedicated private room, restricted to the participants of the same practical session. Indeed, a collaborative system lets learners invite each other to their practical session so they can work together on the same virtual resources. Learners are able to work together as if they were side-by-side in a hands-on laboratory thanks to a set of awareness tools already implemented. For instance, learners working on the same machine can see each other’s terminal thanks to a terminal streaming system.
3.2.2 Architecture and Data Channels
Lab4CE relies on three scalable distributed components. The laboratory layer, built on a cloud manager, hosts the virtual resources as well as some pedagogical objects (e.g., experiment description, user account, etc.), and provides low-level management (e.g., hosting, planning, authorization, etc.). The middleware layer includes two distinct and isolated components. The pedagogical middleware offers a pedagogical REST interface and acts as a broker between the cloud manager and the rich learning interface to manage experiments, practical sessions, resources and users. It also embeds Web Socket endpoints for real-time streaming requirements (e.g., terminal streaming). The
web-based terminal middleware acts as a SSH (Secure Shell: the
protocol used to interact with a remote machine) proxy between virtual machines and the web terminal interface (see Figure 1). Finally, the learning layer exposes different web-based end-user interfaces such as a web-terminal based on ShellInABox [25]. Figure 2 represents the interactions that happen between these three layers and users, and focuses on the three channels transporting data. The blue channel represents the endogenous Lab4CE data, such as collaborative invitation events or instant messages. The green channel represents pedagogical and resource management data: information on experiment, practical session, resource and users, exchanged between the cloud manager and the RLI through the middleware. For instance, when a user starts a machine, the RLI sends an order to change the state of the matching resource to the cloud manager, which in return, sends the new state back. Finally, the red channel contains the data
exchanged between users and resources (e.g., communications between web-terminals of the RLI and virtual machines).
3.3 Rightness of Instruction as a Performance
Metric
Within the last red channel, data contain, among other things, instructions sent by learners to the resources, as well as the responses returned back by the remote system. Instructions provide an interesting granularity. An instruction is a textual message composed of a command name that may be followed by arguments and/or options (e.g., “ls -l”, where “ls” is the command name and “-l” is an option). Being the basis of the experiment’s path, the sequence of instructions reflects learners’ progression within the experiment. Thus, instructions can be analyzed to provide relevant information at different scales: a single instruction gives information about the performance on the command itself, whereas a whole sequence of instructions reflects how the learner achieved the objective of the practical session. Instructions also present another advantage. When executed, they can be automatically evaluated as right or wrong: the response returned by the resource gives information that can be used to infer that state of execution. In the rest of the paper, we will refer to that state as the technical rightness. An instruction that is technically right means it has been properly executed on the resource. However, this rightness has to be contextualized to the activity: a command execution might be successful, but it might be wrong according to the goal the learner is trying to achieve, or irrelevant for that goal. That « pedagogical » point of view of the rightness can be used to evaluate the learner’s progression through its learning path. It can be defined as the result of the interaction between the instruction, the resource it has been executed on, and the current position of the learner in the learning path. However, in this article, the definition is restricted to the technical rightness. Indeed, to compute the pedagogical rightness, production of solutions to practical activities has to be ensured either automatically, or manually by tutors and teachers. This process goes beyond the scope of this article and will be in the focus of future research. However, this information is taken into account within our trace model presented in the next section.
3.4 Trace Model
While this article focuses on learners’ performance, much more information can be recorded from the Lab4CE environment for further analytics. It includes instant messages, invitations between learners, logged in/logged out & start/stop lab actions, operations on machine beside instructions (e.g., start, stop, suspend & resume), and navigation within the platform (e.g., to switch from a lab to another, to open help popups, etc.). We chose to adopt the XAPI specifications to design our trace model for the following reasons: (i) to reuse existing interoperable tools, (ii) to share our collected data, and (iii) to reuse the analytics tools we designed in other contexts [36]. In addition, XAPI is becoming widely used [20, 26, 28] and proposes a main flexible structure of data able to represent any action called statement, composed of a verb, an
actor, and an object. A statement might also include the time
Figure 1. The Lab4CE Rich Learning Interface (RLI)
when the action was performed (i.e., a timestamp), its context, its
result (success, completion, score, etc.), the authority asserting the
action that occurred, or any attachment (e.g., a file attached to the statement). To represent an instruction executed on a remote machine, we created a custom XAPI Activity object. For instance, the instruction “rm –v myfile”, whose the response returned by the resource is “rm: myfile: No such file or directory” is represented in Figure 3 as a couple of a computer instruction
object and its related result. The learner information is set in an actor element, while the resource, the practical session and the
experiment define the context of the statement. The timestamp is also recorded within the statement. The tracking framework explained below is in charge to generate these complete statements.
3.5 Learning Analytics Framework
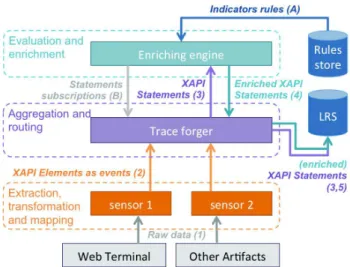
We propose a tracking framework (see Figure 4) inspired from existing infrastructures such as the Migen project [32], or the flexible and extensible approach proposed by Hecking et al. [15]. Our framework aims at generating XAPI statements from the different data sources of the Lab4CE environment, and also supports statements’ enrichment with inferred indicators. Unlike other approaches, our framework essentially resides on the client side, so as to benefit from distributed computation. Also, since it enables indicators inference on that side, this framework can avoid sending sensible data and still compute related metrics. The framework includes three loose-coupled layered components on the client side, and two remote stores. The sensors monitor data on a specific component of the Lab4CE environment (i.e., (1) in Figure 4), transform these data in a XAPI element, and send them to the trace forger as an event (2). Figure 4 represents two examples of sensors used in Lab4CE: the sensor 1 monitors the web-terminal and sends an event each time an instruction is carried out by a learner. This event includes three elements: the verb, the object and the timestamp. The sensor 2 monitors artifacts of the RLI that gives information about the identity of the user, the resource (s)he is working on and the lab it belongs to. The trace forger merges these data in order to build the matching statement, and adds a timestamp if this field is missing. The statement is then routed to either the enriching engine (3), or directly to the LRS (5).
The enriching engine enhances statements with inferred indicators. This inference engine receives its rules from a store (stream labeled “A” in Figure 4). When the engine has received rules, it subscribes to the forger to receive statements it can infer indicators on (i.e., (B) in figure 4). For instance, the enriching engine subscribes to the forger to enrich instruction statements with a rightness indicator. The forger then sets its routing table according to that subscription. Afterwards, each time the forger builds such statement it sends that trace to the enriching engine. The enriching engine infers then the rightness, adds it to the
statement and sends it back to the trace forger (4). Eventually, the forger sends the enriched statement to the LRS.
Finally, our LRS proposes both a REST interface and full-duplex communication endpoints (i.e., Web Socket, Ajax/XHR Streaming). The REST interface is used by the trace forger to send statements, while the components that exploit statements (such as visualization tools) can subscribe to one or several streams of statements through the full-duplex endpoint.
We implemented the three layers in Lab4CE with AngularJS, a Model-View-Controller (MVC) framework. This kind of framework facilitates the creation of sensors to monitor data, since it provides automatic bindings between the DOM structure of the web page and the trace model. However, environments that do not use such a framework can support sensors by parsing the DOM structure of the page itself. Our stores were implemented with a stack composed of a noSQL database (i.e., MongoDb) to enable integration of new statements or modifications in statements’ structure, and a Spring Java EE layer to expose both REST interfaces and full-duplex endpoints. An enriching engine was implemented to infer technical rightness of a command, setting a score of 1 when an instruction is evaluated as right, 0 otherwise. We detail in the following section different learning analytics tools dedicated to learner awareness that exploit our LRS.
4. AWARENESS TOOLS
We present in this section two learning scenarios leading to the design and creation of visualization tools based on instructions carried out by learners. These tools aim at making learners able to analyze why and what they are doing, in order to support metacognitive processes [16].
4.1 Social Comparison Tool
Objectives. Recent research show that learners that become
engaged in a social analysis process might enhance their reflection [37]. Comparative tools aim at identifying each learner’s performance and allowing learners to compare each other. These tools consist in providing social comparison feedback [22] and giving the students the feeling of being connected with and supported by their peers [19].
Learning Scenario. While learners are working in Lab4CE, they
are aware of both their own and peers’ performance. They should be able to keep their attention to their activity and get feedback
Figure 3. Example of instruction and result XAPI elements
about their own and others’ performance with the less cognitive overhead possible, as required in Section 2.
Design and Implementation. The visualization tool is composed
of a set of progress bars that reflects learners’ level of performance (according to the rightness of instruction defined in Section 3.3) based on a simple color code (green if the value is 1, red if it is 0). A progress bar is a lightweight component that subscribes to our LRS for instruction statements and then applies filters on these data in order to display information about a particular learner or a group, and about the current session or the whole practical activity. For each statement, the tool draws a colored gradation according to its score, scaled on time.
The visualization tool integrated into the Lab4CE environment is illustrated on top of Figure 5. It provides three different progress bars. The first one (i.e., My current session on Figure 5) relates the individual performance of the logged-on learner during the current session, the second one (i.e., My experiment on Figure 5) reflects the performance since the logged-on learner started working on the current practical activity, and the third bar (i.e., All
participants on Figure 5) exposes the level of performance of the
group of learners enrolled in the practical activity. The progress bars are automatically updated each time a command is executed by a learner. In addition, we enriched the existing social presence tool included into the RLI to display the current level of performance of each connected learner using a smaller progress bar; the resulting visualization is illustrated on bottom of Figure 5. With the different progress bars, learners get aware of the progression of their level of performance, and are able to compare their own and their partners’ levels. They also have the opportunity to identify peers that seem to perform better, and thus who could help them when they encounter difficulty; at the
opposite, they can also identify peers who could get support from them. Furthermore, this tool is available to tutors who become aware of the group level of performance, and who are thus able to adjust the objectives and/or learning paths of the practical activity. Finally, the individual learners’ progress bars help tutors to identify learners in difficulty and needing support.
This social comparison tool provides awareness to learners about their own and their peers’ performance, while requiring insignificant cognitive efforts from learners and thus offering them the opportunity to keep working and focusing on the learning activities. However, this simplicity prevents them to deeply analyze their own actions, as well as those of their peers; the following tool aims at achieving this objective.
4.2 Reflection-on-Action Tool
Objectives. Davis et al. [8] defined reflection-on-action as the
analysis of processes after the actions are completed. Collins et al. [7] recommended various strategies to engage learners in reflection-on-action like imitation by learners of performance especially modeled for them, or replay of students’ activities and performance by teacher. Providing reflection-on-action would then leverage the limits of the social comparison tool.
Learning Scenario. Users review the instructions they carried out
for a session of work, or since the beginning of a given practical activity, on a particular resource or on all of them. They analysis their own work, but also discover how peers have proceeded to achieve the pedagogical objectives.
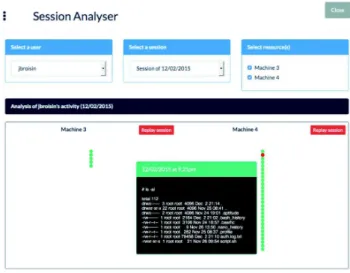
Design and Implementation. To review a work session, we
propose a dashboard illustrated in Figure 6 to let learners drill down into deeper analysis of their own or peers’ work. The form on the top of the interface allows filtering information to visualize (i.e., instructions) according to a given user, session or resource. For each selected resource, a timeline of instructions is exposed into the main panel. Each node of the timeline represents an instruction, colored according to its rightness (using the color code of the social comparison tool). Details of an instruction appear at mouse over, in a terminal-like area containing the command, its argument(s), and the output returned by the machine (see Figure 6). Finally, a last feature enables merging several timelines to visualize all instructions carried out by a learner on any machine of a given practical activity.
Figure 5. The social comparison tool
This tool adopts the more traditional client-server architecture, and relies on the REST interface of the LRS to retrieve data. As a dashboard, it cannot be used competitively with the RLI (i.e., learners cannot work on a resource and visualize this tool at the same time). However, this tool could be useful for a practical session to engage learners in the analysis of peer’s actions in order to better understand, for instance, the solutions proposed by others. To promote that usage, a connection exists between this tool and the social comparison tool: when a user clicks on an individual progress bar, the reflection-on-action tool appears and allows to visualize the instructions carried out by the matching learner during the current session.
The aim of this tool is to engage learners in a reflective process and to make them analyze their work in details. The timeline also visually highlights the difficulties they experienced. Moreover, tutors can review learners’ actions and evaluate how they performed. Thanks to the connection with the social comparison tool, learners can easily seek help from peers (or offer help) by analyzing the instructions executed in the current session. We have designed and implemented both tools into the existing Lab4CE environment.
5. CONCLUSION
We proposed in this paper two awareness tools aiming at engaging learners in the deep learning process while they are practicing in a remote laboratory. A social awareness tool reveals to learners their current and general levels of performance, and let them compare each other's levels. This tool stands on a simple visualization technic in order to be usable during a practical session, while users perform their learning activity, without requiring specific attention. The reflection-on-action tool, implemented as timelines, allows learners to deeply analyze both their own work and peers’ activity.
Both tools rely on a generic and modular learning analytics framework standing on XAPI specifications and integrating an enriching engine able to infer different indicators from collected data. These tools and the framework have been successfully integrated into the Lab4CE system, our remote laboratory dedicated to computer education.
The performance metric we defined is currently restricted to the technical aspect of a computer command. However, it should also relate the pedagogical relevance of an instruction to allow comparison of learners’ progression within the course. Also, the exploitation of the whole set of traces our system currently generates (e.g., instructions, but also instant messages, collaboration invitation, etc.) leads us to learners profiling and pattern mining that represent other areas of investigation in line with our objective. For instance, such analytics could be used to promote help seeking or offering processes between peers.
6. REFERENCES
[1] Arnold, K.E. and Pistilli, M.D. 2012. Course signals at Purdue: using learning analytics to increase student success. LAK. (2012), 267–270.
[2] Bodemer, D. and Dehler, J. 2011. Group awareness in CSCL environments. Computers in Human Behavior. 27, 3 (2011), 1043–1045.
[3] Bouabid, M.E.A. 2012. De la Conception à
l'Exploitation des Travaux Pratiques en ligne.
[4] Broisin, J., Venant, R. and Vidal, P. 2015. Lab4CE: a Remote Laboratory for Computer Education.
International Journal of Artificial Intelligence in
Education. (2015), 1–27.
[5] Buder, J. 2011. Group awareness tools for learning: Current and future directions. Computers in Human
Behavior. 27, 3 (2011), 1114–1117.
[6] Chandler, P. and Sweller, J. 1996. Cognitive load while learning to use a computer program. Applied
cognitive psychology. (1996).
[7] Collins, A. and Brown, J.S. 1988. The Computer as a Tool for Learning Through Reflection. Learning Issues
for Intelligent Tutoring Systems. Springer US. 1–18.
[8] Davis, D., Trevisan, M., Leiffer, P., McCormack, J., Beyerlein, S., Khan, M.J. and Brackin, P. 2005. Reflection and Metacognition in Engineering Practice.
Using Reflection and Metacognition to Improve Student Learning. Stylus Publishing, LLC. 78–103.
[9] de Jong, T., Linn, M.C. and Zacharia, Z.C. 2013. Physical and Virtual Laboratories in Science and Engineering Education. Science. 340, 6130 (Apr. 2013), 305–308.
[10] Duval, E. 2011. Attention please!: learning analytics
for visualization and recommendation. ACM.
[11] Ellis, R.A., Marcus, G. and Taylor, R. 2005. Learning through inquiry: student difficulties with online course‐ based Material. Journal of Computer Assisted
Learning. 21, 4 (Aug. 2005), 239–252.
[12] Ferguson, R. and Shum, S.B. 2012. Social learning analytics: five approaches. (Apr. 2012), 23–33. [13] Goldman, S.V. 1992. Computer resources for
supporting student conversations about science concepts. ACM SIGCUE Outlook. 21, 3 (Feb. 1992), 4–7.
[14] Govaerts, S., Verbert, K., Duval, E. and Pardo, A. 2012. The student activity meter for awareness and self-reflection. Conference for Human-Computer
Interaction. (May 2012), 869–884.
[15] Hecking, T., Manske, S., Bollen, L., Govaerts, S., Vozniuk, A. and Hoppe, H.U. 2014. A Flexible and Extendable Learning Analytics Infrastructure. (Aug. 2014), 123–132.
[16] Jonassen, D. 1999. Designing constructivist learning environments. Instructional design Theories and
Models A New Paradigm of instructional theory. 215–
239.
[17] Kirsh, D. 2000. A Few Thoughts on Cognitive Overload. (2000).
[18] Lau, W.W.F. and Yuen, A.H.K. 2011. Modelling programming performance: Beyond the influence of learner characteristics. Computers \& Education. 57, 1 (2011), 1202–1213.
[19] Lowe, D.B., Murray, S., Lindsay, E. and Liu, D. 2009. Evolving Remote Laboratory Architectures to Leverage Emerging Internet Technologies. TLT. 2, 4 (2009), 289–294.
[20] Megliola, M., De Vito, G., Sanguini, R., Wild, F. and Lefrere, P. 2014. Creating awareness of kinaesthetic learning using the Experience API: current practices, emerging challenges, possible solutions. (2014), 11– 22.
[21] Mercer, N. 2004. Sociocultural discourse analysis: analysing classroom talk as a social mode of thinking.
Journal of Applied Linguistics and Professional Practice. 1, 2 (2004), 137–168.
[22] Michinov, N. and Primois, C. 2005. Improving productivity and creativity in online groups through
social comparison process: New evidence for asynchronous electronic brainstorming. Computers in
Human Behavior. 21, 1 (2005), 11–28.
[23] Mikroyannidis, A. and Gomez-Goiri, A. 2015. Deploying learning analytics for awareness and reflection in online scientific experimentation. 5e
Workshop in Awareness And Reflection in Technology Enhanced Learning. (2015), 105–111.
[24] Morais, A.M., Marenzi, I. and Kantz, D. 2015. The LearnWeb formative assessment extension: Supporting awareness and reflection in blended courses.
ARTEL@EC-TEL. (2015), 97–103.
[25] Morell, L. and Jiang, C. 2015. Using ShellInABox to improve web interaction in computing courses. Journal
of Computing Sciences in Colleges. 30, 5 (May 2015),
61–66.
[26] Murray, K., Berking, P. and Haag, J. 2012. Mobile Learning and ADL's Experience API. Connections:
The Quarterly Journal. 12, (2012), 45.
[27] Orduna, P., Almeida, A., Lopez-de-Ipina, D. and Garcia-Zubia, J. 2014. Learning Analytics on federated remote laboratories: Tips and techniques. (2014), 299– 305.
[28] Rabelo, T., Lama, M., Amorim, R.R. and Vidal, J.C. 2015. SmartLAK: A big data architecture for supporting learning analytics services. (2015), 1–5. [29] Ritzhaupt, A.D., Pastore, R. and Davis, R. 2015.
Effects of captions and time-compressed video on learner performance and satisfaction. Computers in
Human Behavior. 45, (2015), 222–227.
[30] Romero, S., Guenaga, M., Garcia-Zubia, J. and Orduna, P. 2014. New challenges in the Bologna
Process using Remote Laboratories and Learning Analytics to support teachers in continuous assessment. (2014), 227–230.
[31] Santos, J.L., Verbert, K., Govaerts, S. and Duval, E. 2011. Visualizing PLE usage. (2011).
[32] Santos, S.G., Mavrikis, M. and Magoulas, G.D. 2010. Layered Development and Evaluation for Intelligent Support in Exploratory Environments: The Case of Microworlds. Intelligent tutoring systems. (2010), 105– 114.
[33] Schneider, D., Class, B., Benetos, K. and Lange, M. 2012. Requirements for learning scenario and learning process analytics. (Chesapeake, VA, 2012), 1632– 1641.
[34] Siemens, G., Gasevic, D., Haythornthwaite, C., Dawson, S., Buckingham Shum, S., Ferguson, R., Duval, E., Verbert, K. and Baker, R.S. 2011. Open
Learning Analytics: an integrated & modularized platform.
[35] Vigotsky, L.S. 1978. Mind in Society: the development
of higher Psychology.
[36] Vozniuk, A., Govaerts, S. and Gillet, D. 2013. Towards Portable Learning Analytics Dashboards. (2013), 412–416.
[37] Wilson, J. and Wing, J.L. 2008. Smart thinking:
Developing reflection and metacognition. Curriculum
Press.
[38] Zhong, K. and Li, N. 2014. A Correlative Research on the Relationship Between Awareness in Collaborative Learning and its Impact on Academic Performance.