Texture, Color and Frequential Proxy-Detection
Image Processing for Crop Characterization in a
Context of Precision Agriculture
Cointault Frédéric
et al.
*AgroSup Dijon,
France
1. Introduction
The concept of precision agriculture consists to spatially manage crop management practices according to in-field variability. This concept is principally dedicated to variable-rate application of inputs such as nitrogen, seeds and phytosanitary products, allowing for a better yield management and reduction on the use of pesticides, herbicides … In this general context, the development of ICT techniques has allowed relevant progresses for Leaf Area Index (LAI) (Richardson et al., 2009), crop density (Saeys et al., 2009), stress (Zygielbaum et al., 2009) … Most of the tools used for Precision Farming utilizes optical and/or imaging sensors and dedicated treatments, in real time or not, and eventually combined to 3D plant growth modeling or disease development (Fournier et al., 2003 ; Robert et al., 2008). To evaluate yields or to better define the appropriated periods for the spraying or fertilizer input, to detect crop, weeds, diseases …, the remote sensing imaging devices are often used to complete or replace embedded sensors onboard the agricultural machinery (Aparicio et al., 2000). Even if these tools provide sufficient accurate information, they get some drawbacks compared to “proxy-detection” optical sensors: resolution, easy-to-use tools, accessibility, cost, temporality, precision of the measurement … The use of specific image acquisition systems coupled to reliable image processing should allow for a reduction of working time, a lower work hardness and a reduction of the bias of the measurement according to the operator, or a better spatial sampling due to the rapidity of the image acquisition (instead of the use of remote sensing). The early evaluation of yield could allow farmers, for example, to adjust cultivation practices (e.g., last nitrogen (N) input), to organize harvest and storage logistics. The optimization of late N application could lead to significant improvements for the environment, one of the most important concerns that precision agriculture aims to address.
*Journaux Ludovic1, Rabatel Gilles2, Germain Christian3, Ooms David4, Destain Marie-France4,
Gorretta Nathalie2, Grenier Gilbert3, Lavialle Olivier3 and Marin Ambroise1
1AgroSup Dijon, France 2Irstea Montpellier, France
3IMS – Bordeaux University - Bordeaux Sciences Agro, France 4ULg (Gembloux Agro-BioTech), Belgium
We propose in this chapter to explore the proxy-detection domain by focusing first on the development of robust image acquisition systems, and secondly on the use of image processing for different applications tied on one hand to wheat crop characterization, such as the detection and counting of wheat ears per m² (in a context of yield prediction) and the weed
detection, and on the other hand to the evolution of seed development/germination
performance of chicory achenes. Results of the different processing are presented in the last part just before a conclusion.
2. Image acquisition system
Image acquisition is the most important step for robust image processing. Indeed, the use of natural images involves some difficulties tied to outdoor conditions (lighting variations) and object complexity (the leaf area presents several planes, high contrast and lighting variations, scale variations, wheat growth stages ….). Photographic slides were taken at different growing stages of the wheatears.
Different solutions exist for image acquisition according to the vertical distance between the camera and the scene (1m, 2m or more), to the illumination used (natural or controlled light), to the kind of images (color, grey level, hyperspectral ...)
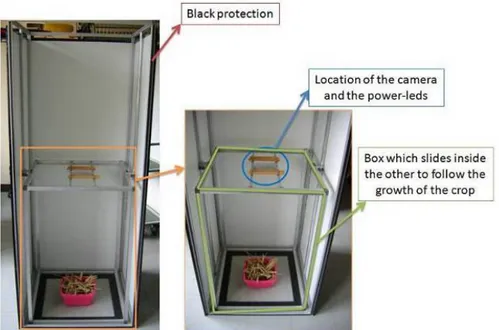
Figure 1 shows one solution based on specific boxes with opaque protection and controlled illumination by power-leds, for wheat ear counting, allowing to obtain color or grey level images.
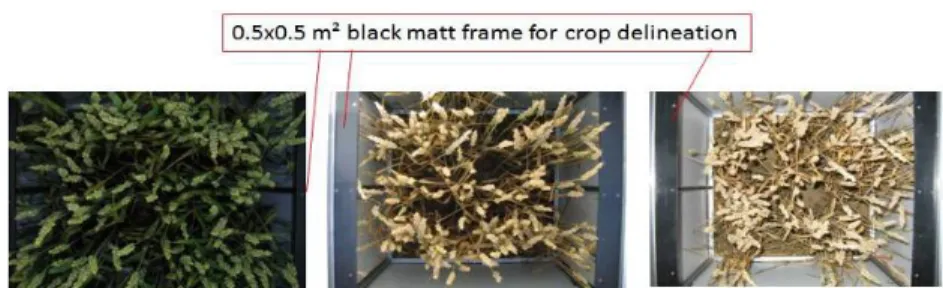
Fig. 1. Example of image acquisition system (left) and its specific illumination by Led (right) Figure 2 shows some examples of color images of wheat crop at three different growth stages with controlled illumination.
Fig. 2. Example of image acquisition system (left) and its specific illumination by Led (right) Proxy-Hyperspectral images can also be used and are obtained with specific sensors. As an illustration, images of wheat crop have been acquired in march 2011 on the domain of Melgueil (INRA, 34-France) by means of dedicated apparatus developed by the Cemagref. This device is constituted by a motorized rod installed on a tractor which allows a longitudinal displacement of a push-broom hyperspectral camera located 1 meter above the vegetation (figure 3).
Fig. 3. Hyperspectral acquisition device
Other imaging system is based on chlorophyll fluorescence. A xenon light source (Hamamatsu Lightingcure L8222, model LC5, 150 W) is used to produce a white light which passes through an interference filter (03FIB002, Melles Griot, Carlsbad, USA) with a central wavelength 410 nm and width at half-maximum 80 nm to excite the chlorophyll-a. The light is conducted to the seeds by an optical fiber. The blue light issued from the filter is absorbed by the seeds chlorophylls, which resulted in fluorescence emission. A high-pass filter (665 nm, 03FCG107, Melles Griot 03FCG107) ensured the selection of the fluorescent signal from the blue light reflected by the object.
The images are acquired by a CCD monochrome camera (Hamamatsu C5405-70), with a resolution of 640 x 480 pixels and 256 gray levels. The system is enclosed within a black box to avoid interference from ambient light and is air-conditioned (Tectro TS27, PVG Int. B.V., Oss, The Netherlands) to maintain a temperature of 20°C. The lamp is optically isolated and white light did not escape inside the box. The blue filter transmitted an unexpected, small amount of infrared light between 770 and 900 nm (detected with spectrometer AVS-SD2000, Avantes, Eerbeek, The Netherlands).
3. Proxy-detection image processing for wheat ear counting
Proxy-detection imagery for yield prediction needs the determination of the three components of the yield: number of ears / m², number of grains per ear and the weight per thousand seeds. Wheat ear shapes are very variable, especially due to the different inclinations of wheatears. However, wheatears show a very rough surface whereas leaf surfaces are smoother (figure 4).
Leaf surface Wheatear surface
Fig. 4. 3D surface of leaf and ear
Considering this specific roughness (figure 4), texture analysis can be used in order to discriminate wheatears, leaves and ground.
3.1 Texture feature extraction
In order to extract the texture features, a variety of methods have already been proposed in the literature and tested in practice. In this context, three families of texture feature extraction exist: statistical, spectral and structural methods. A successful texture classification or segmentation requires an efficient feature extraction methodology.
Two methods are discussed in this chapter. The first one is based on statistical analysis by cooccurrence matrices, and the second one is based on Fourier filtering.
3.1.1 Cooccurrence matrices
The principle of these matrices is to count how often pairs of grey levels occur in a digital image of texture. In fact, we take into account pairs of pixels that are located along a given
direction defined by the angle and separated by a fixed distance d.
Let LI
1,2,...,NI
and LJ
1,2,...,NJ
be respectively the horizontal and vertical spatial domains and G
0,1,..., 1
the grey levels.The digital image :f LILJ assigns a grey level to each pixel. G
Furthermore, we consider four directions ( = 0°, 45°, 90° and 135°) along which a pair of
pixels can lie. Thereafter, for the distance d, we are able to obtain the unnormalized frequencies P( , ', ,d) .
For instance, P( , ',0 , ) d is defined as the cardinality of the set of pixel pairs having the
( , ) and ( ', ') ' ' = , = ' f i j f i j i i d j j (1)
For the other angles, the corresponding frequencies are defined similarly. In this document, we consider the distance d = 1 (this means we consider neighboring pixels). Moreover, texture of the wheatears, and, more generally, of the pictures, are not oriented along a common direction. Thus, for each pair of grey levels we sum over the four frequencies (corresponding to the four angles) and we note:
' ( , ', ,1) P P
(2) ' ' ' , ' P p P
is the element of the normalized cooccurrence matrix.Generally cooccurrence matrices are not used directly because of their size. The principle is to compute a set of measures from these matrices, such as those proposed by Haralick (1973).
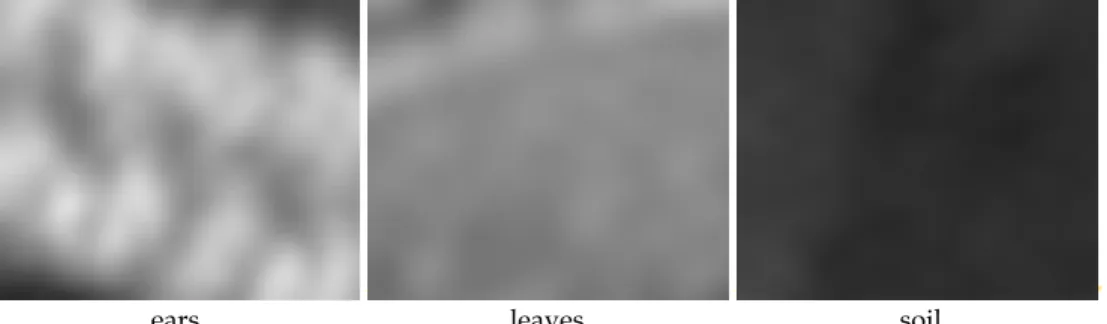
Figure 5 shows three samples of ear ,soil and leaf textures: wheatearstexture reveals many transitions between very different grey tones. For leaves and soil the transitions are more progressive.
ears leaves soil Fig. 5. Examples of the three textural patterns
Thus, we compute four Haralick's features which characterize the particular disposition of the cooccurrence matrix elements for the 3 texture classes:
energy (angular second moment) :
2 ' , '
p
(3)inverse different moment :
' 2 , ' 1 1 ( ') p
(4)contrast : 2 ' , ' ( ') p
(5) entropy :
' ' , ' log p p
(6)The four coefficients were calculated for windows of 17x17 pixels surrounding each pixel. This window size is smaller than the ears' size and allows for reducing noise effects. The computational cost, the cooccurrence matrices were calculated over posterised pictures (32 grey levels), which avoids obtaining hollow matrices, considering the number of pixel in each window.
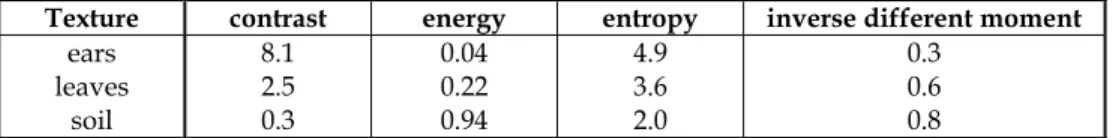
Table 1 shows the values of the four features for the 3 samples of the figure 5.
Texture contrast energy entropy inverse different moment
ears leaves soil 8.1 2.5 0.3 0.04 0.22 0.94 4.9 3.6 2.0 0.3 0.6 0.8
Table 1. Values of the four Haralick's parameters associated with the three textural patterns The features computed from the cooccurrence matrices are used in a learning step in order to construct a discriminant function, called here textural function, which identifies efficiently the pixel belonging to the « ears » class.
Considering a trial set of windows, the use of a stepwise selection leads us to selects a subset of parameters (from the four ones describe above) to produce a good discrimination model. At the first step, we compute the variance ratio F for each feature:
between group variance within group variance
F =
2 . .. 2 . /( 1) /( ) i i i ik i i n x x g x x n g
(7)g = 2 is the number of groups (one for ears, one for leaves and ground), ni is the number of
windows for the group i (
nin), x.i is the mean of the group i, x.. is the mean of the trialset, xik is the value of the window k belonging to the group i.
The value of the variance ratio reflects the parameter’s contribution to the discrimination if it is included in the textural function. The parameter that has the largest ratio is selected at first. Afterwards, at each step, the order of insertion is computed using the partial F-ratio as a measure of the importance of parameters not yet in the equation. As soon as the partial F-ratio related to the most recently entered parameter becomes non-significant the process is stopped. In a second stage, a discriminant analysis with the selected parameters is computed. Because
there are only two groups to discriminate, only one discriminant factor FD(textural function)
3.1.2 Results from the cooccurrence matrices
In order to illustrate the efficiency of this textural function, the values of FD obtained on the
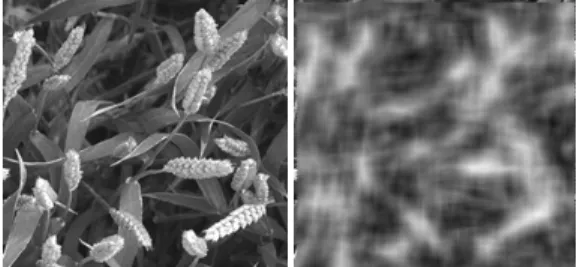
image may be rescaled in the form of a gray level scale. For example, figure 6 shows an original image and the corresponding result after the first stage.
Fig. 6. Example of the textural functionFD (right) for a given wheatear image (left)
3.1.3 Results and discussion
In order to show its relevance, the Textural function is used in the energy function of a Maximum A Posteriori segmentation algorithm (Martinez de Guerenu et al. 1996). Figure 7 shows separately the Wheatear and Non-wheatear regions resulting from this segmentation stage. Wheatear region pictures show false positive wheatear detecton (leaves or stems classified as wheatears). Non-wheatear region pictures show false negative detection (wheatears that have been forgotten).
Both kind of erroneous classification are circled on the pictures.
Wheatear regions Non wheatear regions
For the whole set of sample images, 1 to 3 segmentation errors have been found for each image. As the images show an average of 20 wheatears, the error rate can be estimated around 10%. Most of the errors encountered are identified as badly lightened wheatears. This kind of error could be easily overcome by using artificial light instead of natural light conditions, or using color images instead of grey level images, as it will be shown in the next section.
3.2 Fourier filtering
To improve the previous works, one of the first solution has been to represent each image in a colour-texture hybrid space, and to use mathematical morphology tools (Cointault et al., 2008a) in order to extract and count the number of wheat ears.
Although this previous method gives satisfying results (around 10% of well detection, compared to manual counting), the hybrid space construction method is a supervised one and is limited by the objectivity of the operator. Moreover the statistical methods are dependent on the choice of the direction for the process, need an important computing time and are lightning-dependent.
The objective has been thus to propose new detection algorithms more rapids, robusts, and invariants according to image acquisition conditions, based on Fourier filtering and two dimensional discrete fast Fourier transform (FFT) (Cooley &Tukey, 1965). This approach includes three important steps: high-pass filtering, thresholding and cleaning of the image based on mathematical morphology operations (Serra, 1982).
3.2.1 The three important steps
For the high pass Fourier filtering, a two dimensional FFT is performed on the target image (eq. 8). 1 1 0 0 1 ( , ) ( , ) y y x x y x y x x y k n k n N N N N x y x y n n x y F k k f n n e e N N
(8)Based on the centered Fourier image, a high pass filter is applied in order to eliminate low frequencies in the FFT image (figure 8). The cut off frequency is empirically sized by a 10 pixels width disk mask as it is shown in the figure 8.
The thresholding of the resulting image is based on anInverse FFT and a predetermined threshold is applied in order to eliminate low pixel values which do not correspond to wheat objects (ground, leaf,…) (figure Fig. 9).
The cleaning step aims at eliminate remaining “non wheat” pixel groups, which are small and scattered. It lies on mathematical morphology operation and is performed with three sub steps:
First, a dilatation, which aims at making bigger and closer pixel groups in the image.
Then a blurring convolution with a Gaussian smoothing operator, followed by a
thresholding, which eliminate too small groups of pixels. These small groups are considered as miss. This step makes smaller the pixel groups that correspond to wheat and then justify a third step.
Finally, another dilatation is performed which aims at regenerate size of pixel groups
(a) (b)
(c) (d) Fig. 8. Example of wheat image (a), (b) its associated FFT projection, (c) cut off disk, (d) zoom of cut off disk.
(a) (b) Fig. 9. Image after inverse FFT(a) and threshold image (b).
(a) (b) Fig. 10. Threshold image (a) and cleaned image of wheat detection (b).
3.2.2 Wheat ear counting estimation
The first image processing by thresholding and high pass Fourier filtering gives a binary image, composed of several pixel groups. Each group represents one or more wheat ears to be counted. In order to estimate this number we analyze the shape of each group considering two possible configurations:
Pixel group presents a convex or nearly convex shape pattern: it is considered that only
one ear is present in this kind of group (figure 11a).
Pixel group presents a concave shape pattern (figure 11b): it is consider that several ears
are presents.
(a) (b) (c)
Fig. 11. Pixel groups with nearly convex (a) and concave shapes (b), convex hull of a concave shaped pixel group (c).
In order to quantify the number of wheat ears, we estimate a shape index based on two features extracted from each pixel group:
1 c S S Q S (9)
With S the surface and SC the convex hull surface of the pixel group (Figure 6c).
Coming from this index, a numberX of ears is attributed for the group, considering this interval:
(X1) /10 Q X/10 (10)
Another approach, based on skeleton analysis can be found in (Germain et al, 1995).
3.2.3 Results and discussion
A fast visual observation (figure 12) shows that only a small amount of groups corresponds to non-wheat things in image. More precisely, the biggest wheat ears are well detected and well separated from surrounded leaves.
Ears that lie the nearest of the ground, that are partially hidden or that are a little bit over exposed in the image are not well detected. Small amount of very big leaves also remain after cleaning step.
In order to test our image processing we performed algorithm on 40 images and compare the results with the mean of manual counting done by several experts. For the example, five images sample have been randomly chosen (table 2).
Original images Fourier results Fig. 12. Results of wheat ear detection using high pass Fourier Filtering.
Image Counting Difference (%)
Manual image processing
1 139 142 2,11
2 36 34 -5,88
3 90,5 94 3,72
4 116,5 122 4,51
5 136,5 142 3,87
Table 2. Specifications of five experimental drying runs used for validation.
Within the image set, a high variability of ear’s number can be observed. With most of the images, high pass Fourier filtering method returns slightly higher counts. Based on the whole image sample, absolute difference between manual counting and image processing counting is contained under the value of 6%. The mean error obtained is 4,02% for this set of images.
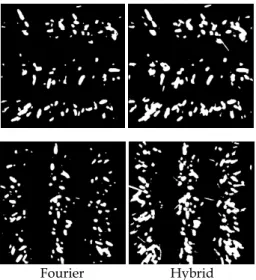
The development of a high pass Fourier filtering approach method aims at creating an easily usable and adaptable method while obtaining a best wheat ear detection. Therefore, it is essential to compare this approach with previously used methods such as hybrid space method (Cointault et al., 2008b). For a visual comparison, high pass Fourier filtering has been applied onto images that have been previously treated with hybrid approach (figure 13).
Fourier Hybrid
Fig. 13. Visual comparison between Fourier and Hybrid approach for two different images. Visual comparisons with hybrid space results show that high pass Fourier filtering approach eliminate more non wheat objects within the images. Fourier approach separates more efficiently ear groups. Calculation time for Fourier approach is few sec per image while its few minutes for hybrid space, with the same operating system.
High pass Fourier filtering gives global satisfying results. Although a close range of settings has been determined, inverse FFT remains a parameter that has to be adjusted according to input image. An empirical value has been found and gives good results for most of images but it could be optimized with an automatic threshold selection such as k-means methods (MacQueen, 1967).
In the context of wheat detection, it has been observed that some ear objects are eliminated after cleaning step. These non-detections mainly correspond to near ground ears or ears massively hidden under leaves, hence, it should be relativized as too low ears may have development problems and may not be considerate within wheat yield. Ears that are located in over or under exposed part of image are not well detected but it is not due to the algorithm but to the quality of the acquisition, which is limited by the natural conditions. Small amount of very big leaves also remain after cleaning step and eliminate these artifacts constitute a further axis of development, including shape analysis in cleaning step.
In the context of wheat ear counting, it is observed that counting error percentage decrease with number of ears in images, hence, best results may be obtained with images representing more area and yet, more ears. Actually, worst error, 5,56%, is obtained with only 36 wheat ears in the image.
It is important to note that in most cases, Fourier approach returns slightly higher counts than manually counts. It should be due to missing detection, such as remaining leaves or over exposed part of images. Counts should be more precise with the including of shape analysis in cleaning step. In all cases, whatever the method used, the only way to obtain a right detection is to use 3-Dimensional information.
4. Proxy-detection image processing for weed-wheat crop discrimination by
hyperspectral imagery
In the domain of weed control, since the environmental and economical stakes are particularly great, the herbicides are largely spread in order to assure sufficient yields for the whole field whatever the infestation rate.
The reason is essentially a technological one. Even if some low-cost devices are currently available to assure a localised spraying of herbicides on bare soil (vegetation detection by photoelectric cells), no commercial product allows a reliable and localised post-emergence treatment. Indeed, a such apparatus needs a sophisticated perception system, based on digital vision and allowing to distinguish between weeds and crops. The identification of varieties inside the vegetation is nowadays the principal lock to the development of localized weed control.
The corresponding research are numerous and can be divided into two main approaches (Slaughter et al., 2008):
the spectral approach, in which the plant reflectance is the main parameter, using
hyper- or multispectral images (Feyaerts & Van Gool, 2001; Vrindts, 2002; De Baerdemaeker et al., 2002). The difficulty is then to propose spectral differences sufficiently robusts to lightning conditions
the spatial approach, based on spatial criteria such as plant morphology (Chi et al.,
2003; Manh et al., 2001), plant texture (Burks et al., 2000) … The main difficulty is tied here to the complexity and the natural variability of the scenes.
The study proposed in this chapter is tied to the previous approach: hyperspectral images of the wheat crop are acquired during the weed control period, and associated to specific pre-processing to avoid illumination conditions. After, the possible spectral discrimination between wheat and dicotyledonous weeds by means of chimiometric tools has been evaluated.
4.1 Spectral pre-processing
The images acquired by the camera (after a first internal processing taking into account the spectral sensitivity of the sensor) are images of luminance, which by definition depend on both the reflectance of the scene and lighting conditions. This is why a reference surface (gray ceramic), for which the reflectance Rc was measured in the laboratory, was systematically placed in each scene (figure 14). The average luminance Lc observed in the image to the reference can then be corrected reflectance for each pixel of vegetation :
Rf = Rc * (Lf/Lc) (11)
where Lf is the observed luminance for that pixel.
It is important to note that the Rf value obtained is a "apparent" reflectance. Other phenomena are to be considered, namely:
The inclination of the observed leaf from the direction of the solar source, introducing a
multiplicative factor of the light, and hence Rf
the possibility of specular reflection, adding a component to the spectrum colorless, and
These two phenomena are taken into account by applying a standard-centering operation (SNV, or "standard normal variate") on each spectrum of the image (Vigneau et al., 2011).
4.2 Chemometric model
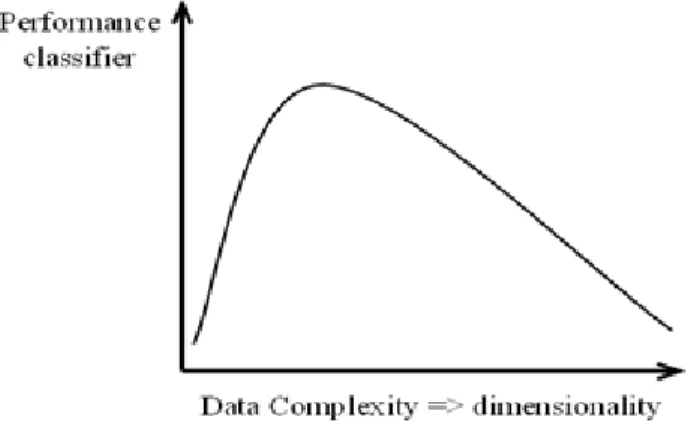
Because hyperspectral images include hundreds of contiguous spectral bands, they have a very high potential for spectral discrimination, compared to classical colour or multispectral images. Unfortunately, in a classification context, these kinds of high-dimensional datasets are difficult to handle and tend to suffer from the problem of the “curse of dimensionality”, well known as “Hughes phenomenon” (Hughes, 1968) which causes inaccurate classification (figure 14).
Fig. 14. Illustration of Hughes phenomenon
In this context, it is important to note that some news techniques already exist to overcome this problem. Among all possible methods, many recent works have focused on the area of dimensionnality reduction approaches in order to reduce this high-dimensional datasets while maintaining the relevance of the information contained in the signal.(Journaux et al., 2008). One of these approaches is the Partial Least Square Regression (PLS-R) , which builds a low-dimension subspace by determining a set of spectral “latent variables”. Compared to other reduction methods such as Principal Component Analysis (PCA), the PLS takes into account both inputs and outputs to build its subspace, leading to better performances. The PLS-DA (PLS Discriminant Analysis) is an adaptation of PLS-R to discrimination problems.
In our case, a total of 335 spectra was increased step by step on a first reflectance image (figure 15) in three categories, namely wheat (157 spectra), dicotyledons (60 spectra) and ground (118 spectra).
A PLS-DA model was then determined on this data set by cross-validation using commercial software in chemometrics (The Unscrambler v9.7, CAMO Software AS, Oslo, Norway).
The resulting discriminant model, which involves 8 latent variables, was then exported and applied to all pixels in an image test, using a dedicated software developed in C + +.
Fig. 15. Calibration image and sample positions (the reference ceramic can be seen on the left)
4.3 Results
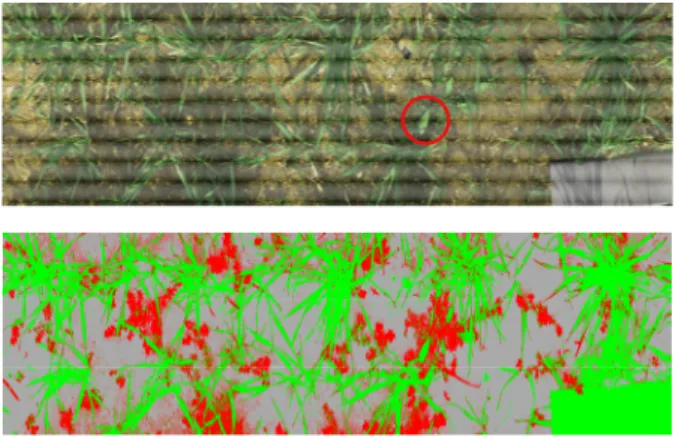
Figure 16 shows the image test and the classification results. We observe an excellent discrimination between wheat and weeds whatever the local conditions of illumination (shadow), with the exception of one type of weed (red circle) which was not present in the calibration image, and was therefore not included in the model.
Fig. 16. Test image and classification results (light gray: ground, red: weed, green: wheat) These results show the very high potential of hyperspectral image processing to extract pertinent information for agronomic applications.
5. Proxy-detection image processing for seed development and germination
performance of chicory achenes by chlorophyll fluorescence
Several aspects of seed quality are tested routinely to minimize the risk of sowing seedlots that do not have the capacity to produce the desired crop. Amongst these tests, seed germination is important since it represents the percentage of pure seeds that have the potential to produce established seedlings in the field. The rate of germination corresponds to the reciprocal of the time needed for a given germination percentage to be reached (Halmer, 2008). Accurate procedure of germination tests performed in laboratory is defined by the International Seed Testing Association (ISTA).
Besides these laboratory tests, seed processing lines includes cleaning machines that remove dust and waste material, and conditioning machines performing dimensional sizing, density sorting, and colour sorting. In conventional colour sorting, discoloured seeds are rejected, on basis of inspecting seeds individually to detect differences in reflected colour.
However, even after several sorting operations, some seed batches can contain a large proportion of viable seeds but still not sufficient for commercial use. These batches are lost because the viable and non-viable seeds cannot be separated using the conventional processing methods. The proportion of immature seeds in these lost batches is unknown. It would therefore be useful to provide a new, non-destructive method of distinguishing immature seeds from mature seeds in order to improve sorting processes.
In this context, the potential of fluorescence imaging (Chen et al., 2002; Nedbal & Whitmarsh, 2004) has been examined. The chlorophyll degrades during fruit ripening and the process of degradation was described by Barry (2009). The chlorophyll is also a highly fluorescent molecule. Fluorescence occurs when some of the light absorbed by the chlorophylls is re-emitted at longer wavelength, typically between 650 and 750 nm. The fluorescent properties of chlorophylls have been used to evaluate the maturity of cabbage seeds (Brassica oleracea L.) (Jalink et al., 1998; Jalink et al., 1999). The results showed that the magnitude of the chlorophyll fluorescence (CF) signal was inversely related to the quality of seeds. The relationship between the CF and germination performance was studied for tomato (Solanum lycopersicum L.) by Jalink et al. (1999) as in their previous study (Jalink et al., 1998). They concluded that seeds with an intermediate CF level were of the best quality, followed by seeds having a low CF signal. Seeds having a high CF signal were the worst. Konstantinova et al. (2002) measured the CF of barley grains (Hordeum vulgare L.) with a SeedScan I Laser Sorter (Satake, Stafford, TX. USA), using the principle developed by Jalink et al. (1998) but including a laser light source instead of a LED. They concluded that sorting a barley seed lot into six subsamples varying in CF values resulted in an optimal quality for the subsamples with low and intermediate CF signals. Suhartanto (2002) thoroughly described the relationships between the fruit CF, seeds CF and germination performance of tomato.
5.1 Image analysis
A specific image analysis code was developed with the GNU Octave language (Ooms & Destain, 2011). After applying background correction (the fluorescence values were divided by the reflectance signal of paper and multiplied by 60), the images were segmented and images of individual seeds were created, each of them being rotated along the main axis of the seed. The pappus side, which is brighter and larger than the radicle tip, was automatically detected on the basis of the mean width of the left half, its mean fluorescence intensity, the right half width and the right half fluorescence intensity. The accuracy of the detection was greater than 98%. The image was thereafter divided into the “pericarp zone” (Pe, 77% of the seed length) and the “pappus zone” (Pa, 23% of the length). The value of 77% was a compromise based on the observation of 100 seed images. The mean fluorescence values of the two zones were recorded for data analysis. The measurement system and image analysis are summarised in figure 17.
Fig. 17. The components of the chlorophyll imaging device and the main steps of image analysis. (1) Xenon lamp with blue optical bandpass filter (370 - 450 nm), (2) optical fiber, (3) cone of blue light, (4) seeds from one capitulum, (5) blue light reflected by the seeds, (6) chlorophyll fluorescence (650 - 730 nm), (7) highpass optical filter (665 nm), (8) CCD camera with zoom objective, (9) connection to the computer, (10) raw image, (11) background correction, then creation of individual images, (12) automated detection of the pappus using dedicated software and estimation of the levels of fluorescence FPER and FPAP (Ooms & Destain, 2011).
5.2 Results
The observed period corresponds to the phase of reserve deposition in the seed described in Bewley & Black (1994). Figure 18 shows the evolution of CF during this phase on the stalk, the weight parameters (dry weight DW and water content WC) and the germination performance (GP and GR). The dry weight increased, while the water content was still high at the end of the observed period (> 45 % on the stalk at 44 DAF, while the WC of stored seeds is about 6 %).
Fig. 18. Evolution of chlorophyll fluorescence (FPER: pericarp, FPAP: pappus), dry weight, water content at harvest, germination percentage and germination rate of chicory seeds at each maturation duration on the stalk from 16 to 44 days after flowering. Means with confidence intervals of the means.
The two following facts are in favour of the use of CF features for the differentiation of immature chicory seeds from mature ones, and as indicators of seed vigour:
the CF decreased during the filling phase;
the end of the filling phase corresponded to the physiological maturity, where
themaximal germination percentage and vigour is attained (Black et al., 2008).
On the other hand, the efficiency of CF features may be negatively affected by the large variability of individual measurements (random differences between individuals).
Current work aims at estimating the correlations between the CF features, the weight parameters and the germination variables in outdoors and greenhouse environments, and to assess the added value of CF features in comparison to weight, size and density features to distinguish between viable and non-viable seeds using sorting simulations.
6. Conclusion
To predict wheat yield or to determine wheat growth stages, remote sensing is not the only solution. Proxy-detection systems allow to acquire high resolution images to be treated by robust algorithms such as high pass Fourier filtering. For example, to predict
yield, the number of wheat ears has to be determined and is the result of a detection and a counting step. Detection has been done by developing specific image acquisition system and by implementing algorithms like colour-texture hybrid space or more classical image processing based on Fourier filtering, according to the frequential information (redundant information) included in the images. In this chapter, we presented the high pass Fourier filtering technique which gives satisfying and robust wheat ear detection with lower computing time. Moreover, we have compared the detection results with those obtained by representation in a hybrid space. Even if satisfying results are obtained for this qualitative experiment, some improvements should be done such as including an automatic threshold determination after the inverse FFT and an efficient shape analysis in order to obtain a finer wheat ear detection and better artefacts elimination.
This work has also revealed the possibility of extending the use of pattern recognition techniques and textural feature analysis to other applications, including the automatic determination of the wheat growth stage, aiming at creating a decision tool for farmers. At this stage, it seems that we should include an agronomic validation in order to propose more specific model to help farmers. In the same context one perspective could be to couple proxy-detection with satellite or aerial images. Moreover using multispectral data would probably improve even more the efficiency of such an approach.
The study of hyperspectral imaging demonstrates the potential to separate weed-culture. A more comprehensive study must now be conducted to assess the robustness and the spectral and spatial minimum necessary resolutions in the context of an operational implementation.
Most fruits and seeds have measurable levels of chlorophyll, respectively in their pericarp or testa, and this chlorophyll degrades with time. In the case of chicory, the commercial seed is a fruit which cannot be hulled and the seed is not observable directly. The low amount of 10 chlorophyll implies the use of a highly sensitive device and because of the presence of a distinct pappus, the imaging of fluorescence is favourable. It would be profitable to identify the factors (variety, season, climate, hydric stress, etc.) influencing the evolution of CF to predict the characteristics of the decrease of CF and to predict if its decrease is always concomitant with the increase of the germination performance.
Finally, combination of several image acquisition systems should give more interesting results and open the door of the detection of other important crop characteristics.
7. References
Aparicio, N., Villegas, D., Casadesus, J., Araus, J.L., & Royo, C. (2000). Spectral vegetation indices as non-destructive tools for determining durum wheat yield. Agronomy
Journal, Vol. 92, pp. 83–91.
Barry, C.S. (2009). The stay-green revolution: Recent progress in deciphering the mechanisms of chlorophyll next term previous term degradation next term in higher plants. Plant Science, 176(3), 325-333.
Bewley J., & Black M. (1994). Seeds: physiology of development and germination. Plenum, ISBN 0-306-44748-7.
Black M., Derek Bewley J., & Halmer P. (2008). The Encyclopedia of Seeds. Science,
Technology and Uses. Cabi, ISBN-13 978-0-85199-723-0.
Burks, F.T., Shearer, S.A., & Payne, F.A. (2000).Classification of weed species using color texture features and discriminant analysis.Transactions of the ASAE, Vol. 43, N°2, pp. 441-448.
Chen, Y. R., Chao, K., & Kim, M. S. (2002). Machine vision technology for agricultural applications. Computers and Electronics in Agriculture, Vol. 36, pp. 173-191.
Chi, T.Y., Chien, C.F., & Lin, T.T. (2003). Leaf shape modeling and analysis using geometric descriptors derived from Bezier curves. Transactions of the ASAE, Vol. 46, N°1, pp. 175-185.
Cointault, F., Journaux, L., &Gouton, P. (2008a). Statistical methods for texture analysis applied to agronomical images.Proceedings of theIS&T/SPIE 20th Annual Symposium
on Electronic Imaging, 26-31 January, San Jose, CA, USA.
Cointault,F., Guérin, D., Guillemin, J.P., &Chopinet, B. (2008b). In-Field Wheat ears Counting Using Color-Texture Image Analysis. New Zealand Journal of Crop and
Horticultural Science, Vol. 36, pp. 117–130.
Cooley, J.W., &Tukey, J.W. (1965).An algorithm for the machine calculation of complex Fourier series.Math.Comput, Vol. 19, pp. 297-301.
Feyaerts, F., & Van Gool, L. (2001).Multi-spectral vision system for weed detection. Pattern
Recognition Letters, Vol. 22, N°6-7, pp. 667-674.
Fournier, C., Andrieu, B., Ljutovac, S., & Saint-Jean, S. (2003). ADEL-Wheat: A 3D architectural model of wheat development. Plant growth modeling, simulation,
visualization and their applications, J. M. Hu B.G., Springer Verlag, pp. 54-63.
Germain, C., Rousseaud, R., & Grenier, G. (1995). Non Destructive Counting of Wheatear
with Picture Analysis.Proceeding of 5th IEE International conference on Image Processing
and its Applications, Edimburg, UK, 1995.
Halmer, P. (2008). Germination rate. In: Black M., Derek Bewley J., Halmer P. (2008). The Encyclopedia of Seeds. Science, Technology and Uses. Cabi, ISBN-13 978-0-85199-723-0.
Haralick, R.M., Shanmugam, K., &Dinstein, I. (1973).Textural Features for Image Classification.IEEE Trans. On Systems, Man and Cybernetics, Vol. 3, N°6, pp. 610-621.
Hughes, G.F. (1968).On the mean accuracy of statistical pattern recognizers.IEEE
Transactions on Information Theory,Vol.14, pp. 55-63.
International Seed Testing Association (2005). International rules for seed testing. Bassersdorf, Suisse: ISTA.
Jalink H., van der Schoor R., Frandas A., van Pijken J.G., & Bino R.J. (1998). Chlorophyll fluorescence of Bassica oleracea seeds as a non-destructive marker for seed maturity and seed performance. Seed Science Research, Vol. 89, pp. 437-443.
Jalink, H., Van der Schoor, R., Birnbaum, Y. E., & Bino, R. J. (1999). Seed chlorophyll content as an indicator for seed maturity and seed quality. Acta Horticulturae, Vol. 504, pp. 219-227.
Journaux, L., Destain, M.F., Miteran, J., Piron, A., Cointault, F. (2008).Texture Classification with Generalized Fourier Descriptors in Dimensionality
Reduction Context : an Overview Exploration.Third International Workshop on
Artificial Neural Networks in Pattern Recognition, Pierre & Marie Curie
University, Paris, France, IAPR, 2008.
Konstantinova, P., Van der Schoor, R., Van den Bulk, R., & Jalink, H. (2002). Chlorophyll fluorescence sorting as a method for improvement of barley (Hordeum vulgare L.) seed health and germination. Seed Science and Technology, Vol. 30, pp. 411-421.
MacQueen, J.B. (1967). Some Methods for classification and Analysis of Multivariate Observations.Proceedings of 5-th Berkeley Symposium on Mathematical Statistics and
Probability, Berkeley, University of California Press, Vol. 1, pp. 281-297.
Manh, A.-G., Rabatel, G., Assémat, L. & Aldon, M.J. (2001). Weed Leaf Image Segmentation by Deformable Templates. Journal of Agricultural Engineering Research, Vol. 80, N°2, pp. 139-146.
Martinez de Guerenu C., Germain Ch., Lavialle O., & Grenier G.(1996) Designing an automatic counting system for wheatears, proc. of AgEng 96, Int. Conf. on
Agricultural Engineering, Madrid, Spain, 1996.
Nedbal, L., & Whitmarsh, J. (2004). Chlorophyll fluorescence imaging of leaves and fruits. In G.C. Papageorgiou, & Govindjee. (Eds.), Chlorophyll a fluorescence: A signature of photosynthesis, pp. 389-407. Dordrecht: Springer.
Ooms, D., & Destain, M. F. (2011). Evaluation of chicory seeds maturity by chlorophyll fluorescence imaging. Biosystems Engineering, Vol. 110, pp. 168-177.
Richardson, J., Moskal, L.M., & Kim, S. (2009). Modeling Approaches to Estimate Effective Leaf Area Index from Aerial Discrete-Return LIDAR. Agricultural and Forest
Meteorology, Vol. 149, pp. 1152-1160.
Robert, C., Fournier, C., Andrieu, B., & Ney, B. (2008).Coupling a 3D virtual wheat plant model with a Septoriatritici epidemic model: a new approach to investigate plant-pathogen interactions linked to canopy architecture.Functional Plant Biology, Vol. 35, N°9-10, pp. 997-1013.
Saeys,W., Lenaerts, B., Craessaerts, G., & De Baerdemaeker, J. (2009).Estimation of the crop density of small grains using LiDAR sensors.Research Paper – Biosystems
Engineering, Vol. 102, pp. 22-30.
Serra, J. (1982). Image Analysis and Mathematical Morphology.ISBN 0126372403.
Slaughter, C.D., Giles, D.K., & Downey, D. (2008). Autonomous robotic weed control systems : A review. Computers and electronics in agriculture, Vol. 61, N°1, pp. 63-78.
Suhartanto, M. (2002). Chlorophyll in tomato seeds: marker for seed performance? PhD
thesis, NL:Wageningen Universiteit.
Vigneau, N., Ecarnot, M., Rabatel, G., &Roumet.P. (2011).Potential of field hyperspectral imaging as a non destructive method to assess leaf nitrogen content in Wheat.Field
Crops Research, Vol. 122, N°1, pp. 25-31.
Vrindts, E., De Baerdemaeker, J., & Ramon, H. (2002). Weed Detection Using Canopy Reflection. Precision Agriculture, Vol. 3, N° 1, pp. 63-80.
Zygielbaum, A.I., Gitelson, A.A., Arkebauer, T.J., &Rundquist, D.C. (2009).Non-destructive detection of water stress and estimation of relative water content in maize.Geophysical Research Letters, Vol. 36, L12403.