HAL Id: hal-01110771
https://hal.archives-ouvertes.fr/hal-01110771
Preprint submitted on 28 Jan 2015
HAL is a multi-disciplinary open access
archive for the deposit and dissemination of sci-entific research documents, whether they are pub-lished or not. The documents may come from teaching and research institutions in France or abroad, or from public or private research centers.
L’archive ouverte pluridisciplinaire HAL, est destinée au dépôt et à la diffusion de documents scientifiques de niveau recherche, publiés ou non, émanant des établissements d’enseignement et de recherche français ou étrangers, des laboratoires publics ou privés.
Fewer Fish for Higher Profits? Price Response and
Economic Incentives in Global Tuna Fisheries
Management
Chin-Hwa Jenny Sun, Fu-Sung Chiang, Patrice Guillotreau, Dale Squires
To cite this version:
Chin-Hwa Jenny Sun, Fu-Sung Chiang, Patrice Guillotreau, Dale Squires. Fewer Fish for Higher Profits? Price Response and Economic Incentives in Global Tuna Fisheries Management. 2015. �hal-01110771�
Dale Squires
EA 4272
Fewer Fish for Higher Profits?
Price Response and Economic Incentives
in Global Tuna Fisheries Management
Chin-Hwa Jenny Sun*
Fu-Sung Chiang**
Patrice Guillotreau***
Dale Squires****
2015/03
(*) Gulf of Maine Research Institute, USA (**) National Taiwan Ocean University, Taiwan
(***) LEMNA, Université de Nantes (****) NOAA Fisheries, USA
Laboratoire d’Economie et de Management Nantes-Atlantique Université de Nantes
Chemin de la Censive du Tertre – BP 52231 44322 Nantes cedex 3 – France
www.univ-nantes.fr/iemn-iae/recherche Tél. +33 (0)2 40 14 17 17 – Fax +33 (0)2 40 14 17 49
D
o
cu
m
en
t
d
e
T
ra
va
il
W
o
rk
in
g
P
ap
er
1
Fewer Fish for Higher Profits?
Price Response and Economic Incentives in Global Tuna Fisheries Management
Chin-Hwa Jenny Sun
Senior Marine Resource Economist, Gulf of Maine Research Institute Portland, ME, USA
jsun@gmri.org, 1-207-228-1658. Fu-Sung Chiang*
Professor, Institute of Applied Economics, National Taiwan Ocean University 2 Pei-Ning Road
Keelung, Taiwan 20224
frank@ntou.edu.tw, +886-2-2462-2192 Ext. 5406 *Corresponding Author
Patrice Guillotreau Professor, University of Nantes
Nantes, France
Patrice.Guillotreau@univ-nantes.fr Dale Squires
Senior Scientist, Southwest Fisheries Science Center, NOAA Fisheries La Jolla, CA, USA
Dale.Squires@noaa.gov
D.G. Webster
Assistant Professor, Environnemental Studies, Dartmouth College, 6182 Steele Hall, Hanover, NH 03755
d.g.webster@dartmouth.edu and
Matt Owens
Managing Director, FishWise Non-Profit Organization Santa Cruz, CA, USA
2
Abstract
This paper evaluates industry-wide economic incentives arising from changes in product prices in an industry exploiting a common renewable resource under public regulation that sets total sustainable conservation targets. Changes in prices alter economic incentives through impacts upon revenues, profits, conservation, and nonmarket public benefits. Economic incentives in industries exploiting common resources have been examined along many margins, but not at the overall industry level from changes in market prices arising from public regulation. We analyse the impact upon economic incentives from changes in overall sustainable output level and market price through a study of a tuna fishery to estimate ex-vessel price and scale flexibilities for imported skipjack and yellowfin in Thailand’s cannery market. The unitary scale flexibility, estimated from the General Synthetic Inverse Demand Systems (GSIDS), indicates no loss in revenues and even potential profit increases resulting from lower harvest levels that could arise from lower sustainable catch limits. However, for this to work, three of the inter-governmental tuna Regional Fisheries Management Organization (tRFMOs), that manage majority of the yellowfin and skipjack tuna in Pacific and India Oceans, would have to coordinate their conservation measures on catch limit of both species together.
Highlight:
An optimal management is to align fishers’ incentives to comply with conservation targets.
Economic incentives could be generated by reducing catches in a global scale with globally integrated markets.
Any locally restricted fishing effort that aims to lower total catches faces the counter-incentives to fishers fished in other area to comply.
There are potential profit increases from more conservative global tuna catch limits. Coordinating three of the tRFMOs to set catch limits is needed to create economic incentives.
Keywords: Economic Incentives, Conservation policy, General Synthetic Inverse Demand
3
1. Introduction
One of the most important questions facing public regulation of common renewable resources is the set of incentives for conservation and management of the resource and industry. Since Gordon (1954), the economic literature’s emphasis has focused upon individual exploiters’ economic incentives to overexploit the resource when property rights are incomplete and the potential for property rights or Pigovian taxes to realign incentives with social objectives (Wilen, 2000; Grafton et al., 2006). Much of the incentive discussion has focused upon a single countrywide closed sector or perhaps a single autarkic economy.
Public regulation can impact product prices and thus industry-wide incentives affecting how producers respond, regardless of how the property rights are structured. While Pigovian output or input taxes utilize, at least indirectly, product price response, attention has yet to be given to price responses arising from other channels, notably through changes in industry-wide sustainable output limits. Sometimes, and especially in the international setting, distributional impacts can undermine the negotiation and implementation of sustainable limits, whether through stiffer command-and-control measures or market-based regulatory instruments (Barkin and Shambaugh, eds. 1999). In turn, a potentially underutilized channel opens up for public regulation.
Products arising from exploiting renewable common resources increasingly enter into global or regional markets, complicating product price formation. Forest products and many types of fish, such as tunas, whitefish, salmon, and small pelagic species (that enter into
aquaculture and animal feed) provide examples in competitive markets. Their aggregate supply, perhaps mediated through international trade or regional production or conservation agreements, can impact regional or global prices. Even changes in water supply through regulations upon
4
aquifer extraction, overall water flow limits in international and national water treaties, and dam construction or demolition can impact regional water prices, and through that affect incentives to supply and use water. Wildlife products and their derivatives such as skins, hides, tusks, and horns, also enter into markets, but much of it is illegally harvested and traded, and markets are often controlled by criminal elements and are non-competitive, and fall outside of the range of our discussion.
Price increases can undermine or reinforce incentives to comply with all types of
management, including property-based systems. For example, any locally restricted input usage that lowers total output faces counter (reinforcing) incentives for compliance emanating from the primary product market if revenues rises proportionately less (more) than the output decrease, which in turn impact incentives. Price increases also tend to increase political pressure that weakens restrictive conservation measures, including driving up catch limits well above scientifically recommended levels (Webster, in press). When primary products from the regulated industry enter into regional or global markets, such market price responses may diminish due to the larger volumes and increases substitution possibilities, but also means that a potential regulatory lever is removed unless efforts are coordinated across regional or global scales.
What has been missing in the literature on incentives in common resource industries regulated through sustainable conservation limits is public regulation’s impact upon industry supply and subsequent impact upon prices, revenues, and profits, and in turn the effect upon industry-wide economic incentives. A second missing element is the potential impact of global or regional production measures impacting supply and prices and thereby incentives within the context of increasingly global or regional integrated primary product markets. A third and related
5
question is the potential revenue gains or losses and consequent incentives generated under such measures.
This paper analyses the impact upon industry-wide economic incentives arising from changes in product prices in an industry globally integrated by prices and exploiting a common renewable resource, the fishery, due to public regulation that reduces the industry-wide sustainable catch limit. Changes in prices alter economic incentives through impacts upon revenues, profits, conservation, and nonmarket public benefits. We analyse a tuna fishery to estimate price and scale flexibilities of the inverse demand system for Thailand’s cannery market, which is the largest in the world and exerts global price leadership, importing more than half of the global skipjack tuna (Katsuwonus pelamis) and yellowfin tuna (Thunnus albaceres) catches for canneries and setting global price leadership.
The unitary scale flexibility we find indicates no loss in revenues and even potential profit increases stemming from lower sustainable overall catch limits, i.e., increase in landings of both species at the same time is accompanied by the same proportionate increase in price. The catch limits could be imposed by conservation and management policy through more conservative global measures for both yellowfin and skipjack if three of the inter-governmental tropical tuna Regional Fisheries Management Organization1 (tRFMOs) in Pacific and India Oceans, that manage majority of the global yellowfin and skipjack tuna resource, could coordinated their management measures to comply with the objectives of optimal management in a global scale. This is at once a roving bandit problem (Berkes et al. 2006), since tuna fleets can
1 There are five tRFMOs, including Intra-American Tropical Tuna Commission (IATTC), International Commission for Conservation of Atlantic Tuna (ICCAT), Western and Central Pacific Fisheries Commission (WCPFC), Indian Ocean Tuna Commission (IOTC) and Commission for Conservation of Southern Bluefin Tuna (CCSBT). Except CCSBT is solely managing global TAC of southern bluefin tuna, the other four tRFMOs all define their
conservation measure by managing the fishing effort of large scale tuna purse-seine fleet targeting skipjack and yellowfin tuna in each of their region, instead of global catch limits.
6
move between regions, and an economic issue, because our results also show that reductions of quantity supplied for only one species would not have the desired price effects due to substitution in the Bangkok market.
The paper is organized as follows. Section 2 reviews the literature on economic incentives for fisheries to show how our focus upon conservation targets, supply, prices, and incentives contributes to the literature. Section 2 also sets the stage for the tuna empirical analysis. Section 3 surveys demand systems and market delineation to justify separate estimations of the canned tuna value chains found by the market delineation literature. Section 4 presents the detailed demand model and Section 5 provides the empirical results. Section 6 discusses the elasticity and flexibility coefficients found in the empirical literature and their consequences for fisheries management, before Section 7 gives some concluding remarks.
2. Fisheries Incentives and Tunas
The primary incentive focus in the fisheries literature remains with individual and group property rights and their impact upon harvesters (see Segerson and Zhou 2014 for a review). Recent literature also considers incentives across other margins, such as within season, or joint multiple and higher valued species, or across heterogeneous space on product quality and form that would be needed to align harvester incentives with the objectives of optimal management (see Smith 2012 for a review)2. Another strand of literature examines the incentive structures and regulatory issues that arise in internationally managed fisheries that require self-enforcing multilateral cooperation (see Finnus and Schneider 2012 for a review). The literature also examines the impact upon incentives from spatial externalities (see Finnus and Schneider 2012 for a review) and discusses the impact of international trade upon incentives in open-access
2 Harvester incentives also arise out of asymmetric information in response to regulations and other policies (Vestergaard, 2010).
7
fisheries (see Copeland and Taylor 2009 for a review). One source of incentives that has been missing is the impact upon industry-wide incentives of changes in catch limits on prices and revenues, especially in globally or regionally integrated seafood markets; seafood is the food commodity most highly traded in international markets integrated by prices and commodity flows.
Tuna species represent a resource management challenge due to their extensive geographic distribution and migratory nature, but also because of their global market demand and the diversity of fisheries that exploit the resource. The tuna-Regional Fisheries Management Organizations (tRFMOs) have utilized different approaches and practices to curb overexploitation, but overcapacity remains (Joseph et al. 2010). Misalignment of economic incentives with conservation objectives and the allocation conflicts among fishing states having different targeted species and diverse gears have hampered conservation efforts. Miyake et al. (2010) reviews tuna fisheries, tuna markets, and tRFMOs.
Public regulation largely remains focused at the individual tRFMO level, but due to global tuna markets integrated by both price and commodity flows (Jeon et al. 2008 and Jiménez-Toribio et al. 2010), an unexploited avenue for conservation opens up through these globally integrated markets. Specifically, lowering formal or informal catch limits might impact prices and hence potential revenue gains or losses and consequent incentives to fish. Setting formal and informal catch limits tends to be less contentious than most other conservation and management measures. Reaching agreements on catch limits (with Bluefin tuna perhaps an exception) is much easier given the widely accepted focal point (and even international norm) of maximum sustainable yield (MSY) and the targets of resource stocks that are not overfished (below MSY) and without overfishing (mortality rates above that corresponding to MSY).
8
Moreover, the distributional impacts that impede regulatory measures affect virtually all parties but in ways that are often unknown and uncertain, which facilitates reaching agreement. Besides complementing tRFMOs, such an approach impacts free riding from nonmembers.
Part of the impact upon prices and revenues depends upon the shape of the yield curve when formal or informal conservation measures are set. However, both the cannery grade tropical skipjack and yellowfin tuna species exhibit a comparatively stretched flat area of the yield-effort curves at high effort levels before biomass reaching deterioration. The answer will depend mostly on the nature of the ex-vessel product price response to changes in catch levels, which is the aggregate supply in the market where ex-vessel product prices form. Depending on responsiveness of product demand prices to declines in catch limits, catch reductions, driven by the conservation measure set by tRFMOs jointly to favor conservation, can lead to prices that increase proportionately more than the fall in quantity, and revenue increases then follow. This statement is true under specific assumptions of effective markets where equilibrium prices and quantities can adjust in the long term. The tuna market for canneries at the global level has proved to be competitive enough to allow for such adjustments (Jeon et al. 2006; Jiménez-Toribio et al. 2010).
Reduced fishing can not only increase revenues but lower costs and boost profits. Cost reductions can both stem from the decrease of fishing effort and associated input costs at lower catch levels and from the marginal stock effect in the golden rule of renewable resources as lower catch limits rebuild resource stocks that lower search and fishing costs (Clark, 1990). Should prices raise proportionately more than quantities decline, the increased revenues can finance buybacks or side payments in both national and international fisheries that reduce participation. In short, conservation, in circumstances when reduced catch limits spurs price
9
gains more than quantities decline, can increase rents, lower costs, and thereby boost economic rents and generate incentives to comply with management measures, conservation, and cooperation.
Tighter catch limits impact not only producer benefits, but also consumer benefits that can decline, at least in the short run until stocks rebuild and reach long-term catch limits. Changes in prices do not always impact economic welfare to the extent that they are pecuniary rather than technological externalities. For example, part of the increase in producer benefits with a higher price and lower quantity can come through a transfer from consumer benefits with no change in overall welfare as long as welfare weights are unity. Higher prices can also adversely impact food security in low-income countries, which unfortunately could be subsumed under pecuniary externalities. Even when consumer benefits from direct use values decline due to a rise in price and fall in quantity, consumers can gain through increased non-market values, such as indirect use value and existence value, when larger resource stocks provide more public benefits. In short, the consumer picture is more complex and falls outside of our emphasis on economic incentives facing industry, regulators, states, and conservation groups from civil society. Finally, to the extent that the inverse demand curve estimated in this paper is an equilibrium demand curve, the welfare measures capture both consumer and producer surplus (Just et al., 2008).
The estimated global tuna price flexibility would also provide a comprehensive method for evaluating the economic tradeoffs between two key fisheries: tuna purse-seine fishery that supplies the skipjack tuna for canning and tuna longline fishery that supply the sashimi-quality yellowfin and bigeye tuna for direct consumption. This is an issue because majority of juvenile
10
yellowfin and bigeye tunas3 are caught along with skipjack tuna destined for the canned tuna market in the purse seine fisheries, but both juvenile yellowfin and bigeye tuna are caught at sizes too small to take full advantage of their individual growth and the higher price obtained for large fish in the sashimi market. Reducing skipjack harvests can effectively provide opportunity to have a sustainable production of sashimi-grade adult yellowfin and bigeye tuna resource (i.e. conservation of the resource versus profitability of alternative fisheries) (Sun et al., 2010).
3. Demand Systems and Global Tuna Market Delineation
Evaluating economic incentives of any catch constraints requires calculating the product price responsiveness, which in turn requires specifying a demand system. To model a demand system, a sequential choice of binary options has to be made before reaching a good model specification. The demand function can either be linear or logarithmic, ordinary or inverse, final or derived, Marshallian or Hicksian, static or dynamic, detailed or aggregated, etc. (Eales, Durham and Wessels 1997).
Previous estimates of price flexibilities, as the change in demand price when there is a 1% change in the quantity supplied of tuna for cannery based on the inverse demand for cannery-grade tuna landings, have largely been ad hoc, estimated at single species, and derived from the price elasticity of tuna can final products (King, 1986; Owen and Troedson, 1994; Campbell, 1998; Sun and Hsieh, 2000; Owen, 2001). Bertignac et al. (2000) utilized the derived demand elasticity provided by Campbell (1998) to get estimates of the price elasticity of demand for tuna harvested in the West Center Pacific Ocean, on the basis of deriving from the estimates of price elasticities of the US market demand for canned tuna, provided by King (1986) and Owen and
3 Bigeye tunas in all tRFMOs are all overfished and subject to growth overfishing because bigeye tunas are longer lived and slower growing than skipjack tuna (Miyake et al., 2010) and majority of juvenile bigeye and yellowfin tunas are caught along with skipjack tunas by purse-seine vessels when setting on floating objects and processed as the lower value cannery quality product.
11
Troedson (1994), instead of directly estimating the market demand for tuna raw material for canning.
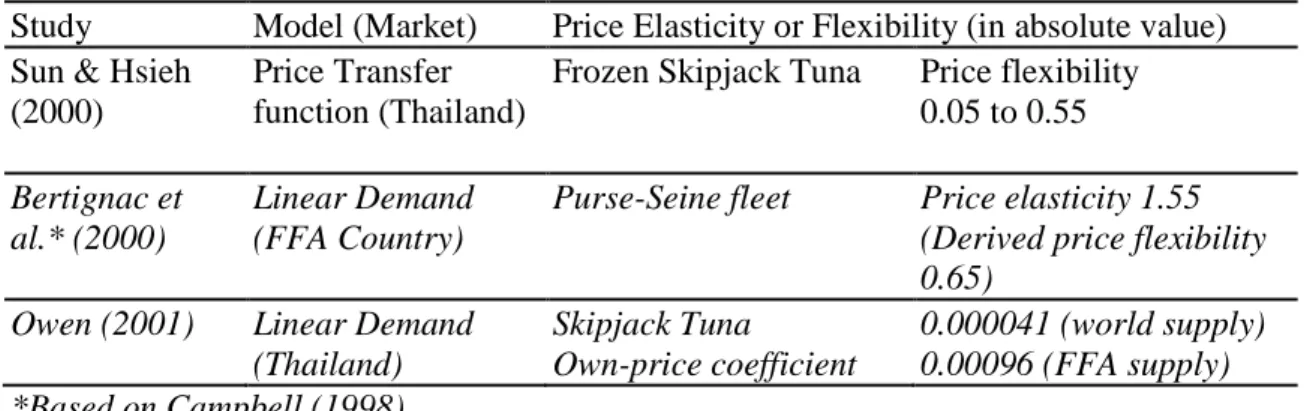
The estimates of price flexibility would be biased if it is derived from the reciprocal of the direct price elasticity, since it could only serve as an estimate of the lower bound of the flexibility (Houck, 1965) and the low flexibilities values, shown in Table 1, would suggest that without a systems approach, consumption substitution possibilities among different tuna species are excluded, the estimates of price flexibility could be biased, and estimates are less efficient (Wessels and Wilen, 1994; Chiang et al., 2001).
The demand system itself is subject to several analyst ex-ante decisions on appropriate market delineation (the relevant market – spatial and sectorial – boundaries). Several recent studies have shown the strong globalization of tuna markets (Jeon et al. 2006, Jiménez-Toribio et
al., 2010) and two separate market chains: purse-seine/cannery-grade and
long-line/sashimi-grade tuna markets (Miyake et al., 2010). Each of these two distinct markets is highly integrated at the worldwide level across locations and species, making any regional change of catches important for the entire industry. The concentration of processors and traders is high in the cannery-grade frozen skipjack and yellowfin tuna, and information is rapidly transmitted from one location to another, with a clearly identified leading market at the worldwide level, Thailand (Jiménez-Toribio et al., 2010).
Using Granger causality tests, Sun and Hsieh (2000) showed that frozen skipjack tuna caught by Taiwanese purse-seiners and exported to Thailand statistically determined the ex-vessel market prices between 1993 and 1996. A monthly time-series transfer function model of Taiwanese price was specified, and the resulting estimates of the price flexibility reach -0.55 when landings are high during the mass production season from April to May, which means
ex-12
vessel price would drop 0.55% if landings imported from Taiwan increase 1%. The demand is less flexible in price while landings are low during October to December. However, the data is incomprehensive to evaluate the price response to the imports from all sources. Other authors utilized cointegration bivariate and multivariate tests through an error-correction model to show that prices of frozen tuna for canning co-moved in the long-run (Jeon et al., 2008), that the law of one price holds between yellowfin and skipjack and that Bangkok was clearly a market leader (weak exogeneity) (Jeon et al., 2008), other places adjusting their prices over time (Jiménez-Toribio et al., 2010). However, none of the study has directly measure the responsiveness of prices to changes in the global supply of cannery-grade tuna and its substitution within the canning industry.
We estimate a General Synthetic Inverse Demand Systems (GSIDS) (Brown et al., 1995) and it could be used to compare to the substitution with sashimi-grade tuna in Japanese market (Chiang, Lee and Brown, 2001). This family of demand systems allows for several flexible specifications that give a more robust estimation than other demand system models (Laitinen and Theil, 1979; Barten and Bettendorf, 1989). The estimates of own- and cross-quantity demand price flexibility and scale flexibility can be used to examine the impact of global quota management control and other supply shifters.
4. A General Synthetic Inverse Demand System Approach
In a study of the price formation of fish, Barten and Bettendorf (1989) first developed a Hicksian inverse demand model, the Rotterdam inverse demand system (RIDS), using the direct utility function and the Wold-Hotelling identity. Barten (1993)compared the RIDS and almost ideal inverse demand system (AIDS), along with two mixed models - one with Rotterdam-type price effects and AIDS-type income effects and the other with AIDS-type price effects and
13
Rotterdam-type income effects. Barten (1993) proposed a synthetic direct model that combines the features of the latter four models and allows non-nested hypothesis testing among models. Brown et al., (1995) specified a family of the general synthetic inverse demand systems (GSIDS), which includes two flexible specifications: the RIDS and Almost Ideal Inverse Demand System (AIIDS) on the one hand (Barten and Bettendorf, 1989), and the inverse demand system proposed by Eales et al. (1997) on the other hand. The GSIDS can be written as:
wit d ln πit = (hi -d1 wit) dln Q + Σj (hij -d2 wit (δij -wjt)) d ln qjt (1)
where subscript t represents time; πit is the normalized price (πit = pit/mt) of good i; with pit and
mt being the price of good i and total expenditure at time t, respectively; qit is the quantity of
good i at time t; wit = qitπit is the budget share of qit; d ln πit = log(πit/πit-1); d ln qit = log(qit/qit-1);
where δij is defined as a dummy variable to determine the cross-product flexibility effect through
the impact of jth good on ith good, such as if it is for evaluating the own quantity then δij = 1 if i
= j, else for cross-quantity when i≠j then δij = 0; and dln Q = Σjwjt d ln qjt is the Divisia volume
index. The scale flexibility is calculated as:4
fi =hi / wi - d1 (2)
Scale flexibilities in inverse demand systems describe how marginal valuations change with proportional expansions in the quantity of the whole consumption bundle. Such effects clearly are related to income elasticities in direct demand systems. However, the link between
4
The scale flexibility is analogous to the total expenditure elasticity of direct demand (Anderson, 1980). It indicates how much price i changes in response to a proportionate increase in all commodities, i.e. it indicates how much a price changes when increasing the scale of the commodity vector along a ray originating from the origin through a commodity vector (in this case the new commodity mix resulting from a quantity change). Scale flexibilities are less than - 1 for necessities and greater than - 1 for luxuries. If scale flexibilities are -1 as unity then increase in landings of both species at the same time is accompanied by the same proportionate increase in price.
14
scale flexibilities and income elasticities is tight only if preferences are homothetic, a situation where neither measure is interesting, or if all elasticities of substitution are unitary (Park and Thurman, 1999).
The compensated cross-price flexibility is calculated as:5
fij* = hij/wi - d2(δij - wj) (3)
For simplicity, subscript t is deleted hereafter. The above inverse-demand system satisfies
and (adding-up)6, (homogeneity), and (Antonelli
symmetry). The adding-up condition is based on the reference quantity
vector or the reference quantity vector has a scale factor k = 1 (Anderson and Blundell, 1983). Other models and their flexibilities are obtained by restricting dl and d2 appropriately: (1) dl
= 0, d2 = 0 for the Rotterdam Inverse Demand System (RIDS) model; (2) dl = 1, d2 = 0 for the
Laitinen-Theil model (1979), known as Inverse Census Bureau of Statistics (ICBS) Model; (3) dl
= 1, d2 = 1 for the Almost Ideal Inverse Demand System model (AIIDS); and (4), dl = 0, d2 = 1
for the RAIIDS model with RIDS scale effects and AIIDS quantity effects, known as Inverse National Bureau of Research (INBR);
5 Anderson (1980) shows that the total change in prices for a change in quantity is comprised of a scale effect (a movement from an initial indifference curve to a new indifference curve measured on a ray from the origin through the new commodity mix) and a price effect reflecting a change in commodity mix in consumption (moving along the initial indifference curve from the initial to new commodity mix). Compensated flexibilities hold utility constant (keeping a consumer on the same indifference curve) thereby removing the scale effect, whereas uncompensated flexibilities allow both utility or scale and prices to change. Compensated inverse demand functions give the levels of normalized prices that induce consumers to choose a consumption bundle that is along the ray passing through the new commodity mix bundle and that gives a constant utility level.
6
Note that ; therefore, , or , or
. 1 1 d h i i =− +
∑
∑
=0 i ij h∑
=0 j ij h hij =hji 1 − = =∑
∑
ihi iwifi∑
iπiqi=1∑
i(qidπi+πidqi)=0∑
i(πiqi(dπi/πi)+xiπi(dqi/qi))=0∑
iwidlnqi=−∑
iwidlnπi15
The GSIDS model was estimated by full information maximum likelihood. Maximum likelihood is preferred over iterative seemingly unrelated regression when cross equation restrictions are imposed, and estimation requires dropping one equation from the estimation to avoid singularity (Greene 2002). The above restrictions provide the basis for likelihood ratio tests to compare models and develop a final specification (Barten (1993).
5. Results: Inverse Demand Analysis of the Bangkok Market
Global catches of skipjack and yellowfin tuna were 2.5 million mt and 1.2 million mt, respectively (FAO, 2012). More than 80% of skipjack and almost half of yellowfin tuna catches are landed by large-scale tuna purse-seiners and delivered to canneries. Large bigeye and yellowfin destined for the sashimi market are caught in the tuna longline fishery.
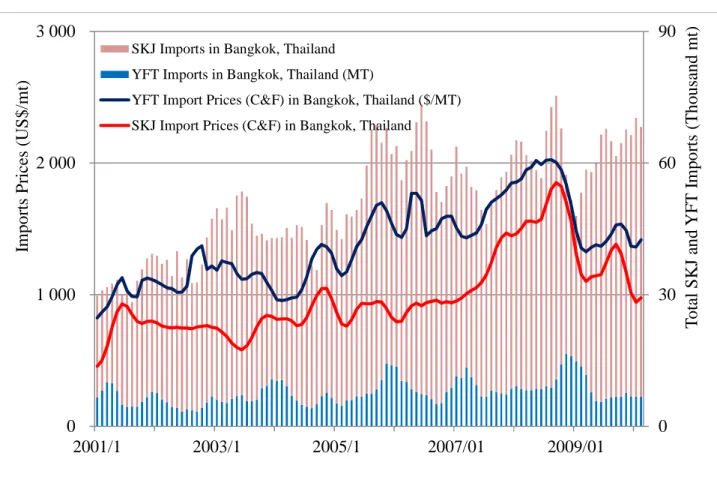
Thailand imports more than half of the global imports of frozen skipjack and yellowfin destined for canneries, and its processing companies increasingly dominate global production and trade. Its annual imports have doubled within the past decade. Monthly imports of yellowfin tuna represent less than 10,000 mt, but imports of skipjack are five times greater than yellowfin tuna, and even reached 62,000 mt in February 2010 (Figure 1). The right vertical axis of the Figure 1 shows the total of imports, which is stacked by imports of skipjack tuna in red bars on top of the imports of yellofin tuna in blue bars. The average import price of frozen yellowfin tuna, fetching 1,500 US$/mt in 2010-11, is about US$300 higher than the average import price of frozen skipjack. Thailand’s imports of both species have nearly doubled during the period 2001-2009 from 400,000 mt to 760,000 mt imported yearly to supply the fast-growing canning capacity.
Since the 1990s, Thailand has been the world’s largest producer of light tuna cans, primarily comprised of skipjack tuna. The top three importing countries of light tuna cans from
16
Thailand in both quantity and value are the United States, France, and the United Kingdom, which purchase over one-third of world imports of canned tuna. About 70 percent of U.S. canned tuna is imported from Thailand. Taiwan is the major supplier of this cannery market (20%), followed by the USA (19%), South Korea (17%), Japan, France and various other purse-seine fleet flag states from all over the world.
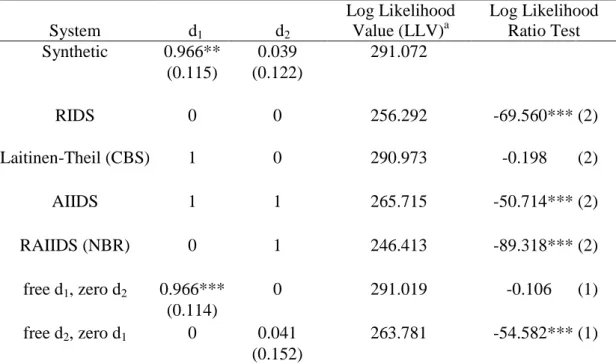
The price response analysis of cannery-grade frozen skipjack and yellowfin tuna markets is based on Thailand monthly import data collected from the National Customs7 between January 2001 and February 2010 (Table 2). Because the natural logarithms of import quantities and prices of both skipjack and yellowfin tuna were found non-stationary for all series in Table 3, first differences were taken to specify the inverse demand system. The system-wide analogue to the Wu-Hausman test was performed and the null hypothesis of landings treated as exogenous variables in the IDS is not rejected with of 4.2385 (p-value = 0.12). In testing for exogeneity in prices, the null hypothesis is rejected with of 4.9801 (p-value = 0.0829). Therefore, the specification of an inverse demand system is valid and a set of 7 synthetic models and restricted versions of IDS were estimated. Table 4 shows the logarithmic likelihood values (LLV) for each of the models. Based on the likelihood ratio test, only Laitinen-Theil (ICBS) and the synthetic IDS with free d1 and zero d2 models are not significantly different than the synthetic
model. The estimate of d1 for synthetic model with free d1 and zero d2 is equal to 0.966.
The synthetic inverse demand system satisfies the adding-up and homogeneity conditions, but the symmetry condition cannot be imposed and the negativity condition cannot be controlled (Barten 1993). Laitinen-Theil (ICBS) is not significantly different than the synthetic inverse demand system vis-á-vis goodness of fit performance. Further comparison of the parameter
17
estimates of scale and price flexibilities across the synthetic and the Laitinen-Theil (ICBS) models also shows no substantial differences in the estimated demand responses. The Laitinen-Theil (ICBS) model is identified as the preferable appropriate model since it is not constrained to the limitation of the synthetic inverse demand system.
The corresponding Laitinen-Theil (ICBS) estimated inverse demand scale, own-quantity, and uncompensated flexibilities are reported in Table 5. The statistically significant import price scale flexibilities for frozen skipjack and yellowfin tuna are -0.995 and -1.021. Based on the t-statistics with the standard errors of the estimated coefficients indicated in the parentheses underneath of the corresponding coefficients, neither of the coefficients is statistically different from 1. These two coefficients imply that both prices will increase (decrease) by 1% if total imports decrease (increase) by 1%, and consequently that revenues will remain constant for different catch limits levels.
Such as shown in Table 5, the statistically significant uncompensated own-quantity flexibilities of demand for frozen skipjack and yellowfin are estimated at -0.797 and -0.220, respectively, and both are significantly less than unity in absolute value. This means that reducing catch levels for a single species alone, especially for yellowfin, would not compensate the revenue loss issued by lower catches.
Using weak exogeneity tests in a Vector Error Correction Model, Jiménez-Toribio et al. (2010) showed that the yellowfin price was the leader in Bangkok, but due to the larger budget share of skipjack (79% on average) over yellowfin (21% on average) in this market, the skipjack price is more responsive to its own quantity than yellowfin. In other words, even though yellowfin could be first targeted by purse-seiners because of its higher market value, our results
18
show that catch changes for this species would not have the same market impact in terms of price levels as changes in skipjack catches.
All prices of all goods are inflexible in their own consumption. The corresponding price elasticities of ex-vessel demand are most likely elastic, since the reciprocal of the price flexibility values for skipjack and yellowfin are -1.25 and -4.54, respectively. Since the reciprocal of the price flexibility forms the lower limit, in absolute terms, of the price elasticity (Houck, 1996), the difference of the true price elasticity from the flexibility reciprocal depends on the entire matrix that characterized by the substitution and complementarity of price flexibilities with other commodities (Huang, 1994; Eales, 1996).
Depending on the responsiveness of prices to declines in quantities, individual reductions in either the skipjack or yellowfin tuna catches that favor conservation without a change in the other species’ catch level can lead to prices that increase less proportionately than the fall in quantity, and revenue decreases then follow. Because of substitution possibilities between the two species, the other fishery may even benefit from the shortage in the first one by maintaining its own catch level. However, if both skipjack and yellowfin tuna catches are simultaneously reduced, the unitary scale elasticity indicates that revenue stays the same but with an increase in profit, since costs can fall with reduced fishing. Moreover, gains in non-market benefits extend to ecosystem and biodiversity impacts from skipjack and yellowfin tuna and even more from the reduced bycatch associated with skipjack catch on floating objects, such as oceanic sharks (Dagorn et al., 2012).
6. Discussion
The present study provides the first comprehensive view of a global ex-vessel market for canned tuna by estimating the price flexibilities of demand for frozen tropical tuna for canneries
19
in Bangkok, the global price leader for light meat canned tuna (Sun, 1999). The estimated long-run scale flexibilities of demand for skipjack and yellowfin tuna are very close to unity and not significantly different from one. Similar values have been found in other studies through the use of inverse demand models applied to another global seafood market, i.e. the whitefish market (Asche and Zhang 2013). These authors found that own-quantity coefficients may vary substantially after structural changes such as the massive introduction of a farmed species like tilapia, but that scale coefficients were rather stable and close to unity at the overall group level for major and well-established fish species. Similarly, a 1% decrease of total supply of tuna, caused by a reduced catch limits level (e.g. caused by an environmental event or stricter conservation measures), would have the same proportional effect upon their prices in the cannery market in Bangkok and revenues would remain constant.
The yellowfin price flexibility, however, indicates strong own-quantity price inflexibility and hence revenue losses with lower TACs if acting alone. The skipjack price flexibility also indicates price inflexibility. Although it is not too far from unity and suggesting that the opportunity cost of foregone skipjack revenues due to the price effect is small if both of the species will not be simultaneously and proportionally managed. However, a marginal change clearly implies important variations, since it is measured using a logarithmic scale. Essentially, the unitary scale effect implies no revenue loss if the catch limits for both species could be simultaneously regulated. Simultaneous catch limits regulation is superior to unitary catch limits regulation, because under the latter there is a revenue loss for suppliers, particularly those targeting yellowfin tuna.
Increased non-market benefits from lower catch on floating objects, i.e. increased private provision of public juvenile bigeye tuna for longline fishery to target, could in principle even
20
make up for the decline in skipjack revenue in terms of total economic value if only reducing both the global skipjack and yellowfin’s catch limits. Singular skipjack regulation could create positive regulators’ incentives but negative individual fisher incentives due to the increased public benefits associated with increased provision of the public good of multispecies fishery accompanying catch limits reduction.8
Our results challenge most previous studies that estimated elasticity and flexibility coefficients for tuna (Table 1). Many direct or indirect (converted from elasticity coefficients) estimates of flexibility values find low flexibilities in the price of tuna products (Bertignac et al., 2000; Sun and Hsieh, 2000; Owen, 2001). Beyond the variety of functional forms and specifications of models, we consider both the stage of the value chains (final or derived demand) and, most of all, the scope and extent of the demand systems play a central role in the resulting estimations (Stigler and Sherwin, 1985). A thorough attention paid to market delineation studies in the first section allowed identifying the world-wide scale as the only relevant level to look at tuna markets divided in two distinct value chains of various tuna species (Sun and Hsu, 1998; Chiang et al., 2001; Jeon et al., 2008; Jiménez-Toribio et al., 2010). The price response of tuna markets to any supply shock (such as change in TACs) can only be observed at this level, justifying concerted management measures by all tRFMOs.
The evolution of skipjack prices in 1998-2000 illustrates perfectly what could be the market response if a few major fleets decided to reduce jointly their catches. By mid-1998, a combination of supply and demand factors created a market imbalance and the price of frozen skipjack in Bangkok plummeted from US$1,150/mt in August 1998 to US$380/mt in November
8 The increasing use of fish aggregating devices (FADs) when targeting skipjack substantially modifies the catch composition by species towards more bycatch of juvenile bigeye and yellowfin tunas, a major concern for tRFMOs (Dagorn et al. 2012; Hall and Roman 2013). Other bycatch species include oceanic sharks and other elasmobranches and many finfish species.
21
2000. The major European and Asian ship owners, representing 65% of purse-seine catches in the world, created the World Tuna Producers Organization (WTPO) after a first meeting in Paris in June 2000 (Morón, 2002). Soon after, by late November 2000, they adopted voluntary reduction measures (effort reduction, catch limitation, market oriented measures and time-area closures), resulting in a spectacular price recovery within the following months (the price of frozen skipjack in Bangkok fetched 940 US$/mt in April 2001). This example supports the finding of unitary scale flexibility in the Bangkok cannery market that could result in effective price adjustment.
The implications of price and scale flexibility are important for fishery management, and market incentives, such as the market price negatively response to catch level changes, should be taken into greater consideration by regulatory bodies. The estimated unitary scale flexibilities for cannery grade skipjack and yellowfin tuna could support the economic benefit of global quota management control and the impact of changes in fishing capacity and catch reduction upon the value of total landings. With fishers’ revenues held constant by a price-quantity scissor effect and the costs of fishing effort reduced, fishing rent would increase and be partly re-distributed for compensation schemes (buyback and side payments) between fisheries and coastal countries to promote capacity reduction. The success of quota control is also influenced by the possibility that fewer fish could ensure higher profit. If a fisher harvested when the market price is down, the net present value of the fishery resources in the long run would be maximized.
7. Concluding Remarks
Economic incentives count when conserving renewable resources. The primary focus of the common resource literature, and especially the fisheries literature, is on property rights and
22
the incentives they establish, and recent attention has been given to other margins. Nonetheless the relationship between catch limits and revenues, profits, and conservation has received insufficient attention, especially in globally integrated primary product markets such as fisheries, where local management measures can create counter incentives to limit the “race for fish”. This relationship centers on the price and revenue responsiveness to changes in aggregate quantities.
A global supply reduction of skipjack and yellowfin would be offset by a proportionate price response so as to keep fishers’ revenue constant if Thailand’s imports were to fall. Such a result has important consequences for tuna conservation policies. Catch limits for local and single species manage most industrial fisheries, and not all will be subject to rights-based management. The search for other economic and conservation incentives whose effectiveness can readily be conveyed to regulators and fishery participants provides an alternative, especially in the international arena where multilateral cooperation on management measures other than catch limits is difficult to reach because of distributional impacts. Such an unexploited incentive lies in the key relationship between changes in a global limit and price responsiveness, which we explore in the context of global tuna fisheries. After property rights, this catch limit-generated incentive may be among the most important in fisheries management, because it will be readily accepted and appeal to all parties involved, although it is counter-productive to generating desired economic incentives with catch limit reductions under low price flexibility conditions. The non-market biodiversity conservation benefits can extend beyond the species of concern to bycatch species whose catches would be concomitantly reduced when the catch limits of target (directed catch) species are reduced.
This study also confirms that management decisions need to be coordinated at the international level between RFMOs, as envisaged by the “Kobe process” since 2007 (Allen,
23
2010), to avoid adverse local spillovers stemming from an isolated decision taken somewhere else in the world. Tuna RFMOs can exploit comparatively flat areas of the yield-effort curves at high effort levels for several cannery grade tropical tuna species to conserve the resource and introduce a precautionary cushion, but at no revenue penalty, and in fact gain a boost in profit and rent.
Acknowledgement
This material is partly based upon work supported by the National Marine Fisheries Service, National Science Foundation under Dynamics of Coupled Natural and Human Systems Program “Fishscape: Complex dynamics of the eastern Pacific tuna fishery” Grant No. CNH-1010280, the National Science Council Grant No. NSC90-2621-Z-019-001 and Grant No. NSC95WFA2000217, the French Agence Nationale de la Recherche (ANR) under grant CEP (changements environnementaux planétaires) MACROES: MACROoscope for Oceanic Earth System (ANR-09-CEP-003), and the international projects MADE (Mitigating the Adverse Ecological Impact of Fishing funded by the European Commission under the 7th Research Framework Programme). We also acknowledge the community-building support of CLIOTOP (Climate Impact on Oceanic Top Predators) and IMBER (Integrated Marine Biogeochemistry and Ecosystem Research). The results are not necessarily expressing the views of the author’s organizations, countries, or sectors, and any remaining errors are the author’s responsibility.
24
Figures and Tables
Figure 1 Monthly Average Import Prices and Total Imports of Frozen Skipjack and Yellowfin Tuna for Canning in Bangkok, Thailand (source: Customs, Thailand)
0 30 60 90 0 1 000 2 000 3 000 2001/1 2003/1 2005/1 2007/01 2009/01 T o ta l S K J an d Y F T I m p o rt s (T h o u sa n d m t) Im p o rt s P ri ce s (U S $ /m t)
SKJ Imports in Bangkok, Thailand YFT Imports in Bangkok, Thailand (MT)
YFT Import Prices (C&F) in Bangkok, Thailand ($/MT) SKJ Import Prices (C&F) in Bangkok, Thailand
25
Table 1 Estimated Price Elasticity and Flexibility of Demand for Cannery-Grade Tuna landings in the Literature
Study Model (Market) Price Elasticity or Flexibility (in absolute value)
Sun & Hsieh (2000)
Price Transfer function (Thailand)
Frozen Skipjack Tuna Price flexibility 0.05 to 0.55
Bertignac et al.* (2000)
Linear Demand (FFA Country)
Purse-Seine fleet Price elasticity 1.55
(Derived price flexibility 0.65)
Owen (2001) Linear Demand
(Thailand) Skipjack Tuna Own-price coefficient 0.000041 (world supply) 0.00096 (FFA supply) *Based on Campbell (1998)
Table 2 Monthly Statistics of the Cannery-grade Tuna Market in Bangkok
Mean Standard dev. Minimum Maximum
Quantity Sold (metric tons; mt)
Frozen Skipjack 43,994 13,033 19,273 78,594
Frozen Yellowfin Tuna 7,736 3,363 2,532 21,216
Average Auction Price (US$/mt)
Frozen Skipjack 994 305 472 1,910
Frozen Yellowfin Tuna 1,388 316 755 2,205
Revenue Share
Frozen Skipjack 80.3% 78.9% 82.6% 76.2%
Frozen Yellowfin Tuna 19.7% 21.1% 17.4% 23.8%
Total 100.0% 100.0% 100.0% 100.0%
Source: Thailand Customs.
Table 3 Augmented Dickey-Fuller test statistic
Null Hypothesis: Unit Root of Variable in Natural Logarithm t-Statistic Prob.*
frozen skipjack tuna price -1.708916 0.4251
frozen yellowfin tuna price -2.009382 0.2825
frozen skipjack tuna quantity -0.622297 0.8615
frozen yellowfin tuna quantity -1.723449 0.4164
26
Table 4 Maximum Likelihood Test Statistics for Bangkok Cannery Market
System d1 d2 Log Likelihood Value (LLV)a Log Likelihood Ratio Test Synthetic 0.966** 0.039 291.072 (0.115) (0.122) RIDS 0 0 256.292 -69.560*** (2) Laitinen-Theil (CBS) 1 0 290.973 -0.198 (2) AIIDS 1 1 265.715 -50.714*** (2) RAIIDS (NBR) 0 1 246.413 -89.318*** (2) free d1, zero d2 0.966*** 0 291.019 -0.106 (1) (0.114) free d2, zero d1 0 0.041 263.781 -54.582*** (1) (0.152)
Note: Numbers in parentheses are standard errors of parameter estimates and *, ** and *** indicate statistically different from zero at 10%, 5% and 1%level, respectively. a
-2*(LLV-LLV for the synthetic model) b
Numbers in parentheses are standard errors of parameter estimates.
Table 5 Scale Flexibility and Uncompensated Own- and Cross-Quantity Flexibility for Bangkok Cannery Market
Scale Flexibility
Uncompensated Own- and Cross-Quantity Flexibility
Frozen Skipjack Frozen Yellowfin
Frozen Skipjack -0.995*** -0.797*** -0.198***
(0.009) (0.009) (0.006)
Frozen Yellowfin -1.021*** -0.801*** -0.220***
(0.036) (0.097) (0.029)
Note: Numbers in parentheses are standard errors of parameter estimates.
27
References
Allen, R., (2010) International management of tuna fisheries: arrangements, challenges and a way forward. FAO Fisheries and Aquaculture Technical Paper 36, Rome.
Anderson, G. and R. Blundell, (1983) Testing restrictions in a flexible dynamic demand system: an application to consumers' expenditure in Canada, The Review of Economic Studies, 50:397-410.
Anderson, R.W., (1980) Some theory of inverse demand for applied demand analysis, European
Economic Review 14: 281-290.
Asche, F. and D. Zhang (2013), Testing structural changes in the U.S. whitefish import market: an Inverse Demand System Approach, Agricultural and Resource Economics Review 42(3):453-470.
Barten, A.P., (1993) Consumer allocation models: Choice of functional form. Empirical
Economics 18: 129-158.
Barten, A.P. and L.J. Bettendorf, (1989) Price Formation of fish: an application of an inverse demand system. European Economic Review 33: 1509-1525.
Berkes, F., T.P. Hughes, R.S. Steneck, A.J. Wilson, D.R. Bellwood, L.H. Gunderson, H.M. Leslie, et al. (2006) “Globalization, Roving Bandits, and Marine Resources.” Science 311 (5767) (March 17): 1557–1558.
Bertignac, M., H.F. Campbell, J. Hampton, and A.J. Hand, (2000) Maximizing resource rent from the western and central Pacific tuna fisheries, Marine Resource Economics 15: 151-177
Brown, M. G., J.Y. Lee, and J.L. Seale Jr., (1995) A family of inverse demand systems and choice of functional form, Empirical Economics 20: 519-530.
Chiang, F.S., J.Y. Lee, and M.G. Brown, (2001) The impact of inventory on tuna prices: an application of scaling in the Rotterdam inverse demand system, Journal of Agricultural
and Applied Economics 33: 403-411.
Chu, C., (2009) Thirty Years Later: The global growth of ITQs and their influence on stock status in marine fisheries, Fish and Fisheries 10(2): 217-230.
Clark, C.W., (1990) Mathematical Bioeconomics: The Optimal Management of Renewable
28
Copeland, B. and M.S. Taylor, (2009) Trade, tragedy, and the commons, American Economic
Review, 99(3): 725-749.
Dagorn, L., K.N. Holland, V. Restrepo and G. Moreno, (2012) Is it good or bad to fish with FADs? What are the real impacts of the use of drifting FADs on pelagic marine ecosystems?, Fish and Fisheries, DOI: 10.1111/j.1467-2979.2012.00478.x
Eales, J.S. (1996) A further look at flexibilities and elasticities: comment. American Journal of
Agricultural Economics 78:1125-1129.
Eales, J., C. Durham and C.R. Wessels (1997), Generalized models of Japanese demand for fish,
American Journal of Agricultural Economics 79(4): 1153-1163.
Finus, M. and R. Schneider 2012. Scope and compatibility of measures in international fisheries agreements. Department of Economics, University of Bath.
Food and Agriculture Organization of the United Nations (FAO), (1996) Precautionary approach to fisheries. Part 2. Scientific Papers. FAO, Rome, Italy. FAO Fisheries Technical Paper 350/2.
FAO (2012), FishstatJ database, Fisheries and Aquaculture Department, Rome, Italy. http://www.fao.org/fishery/statistics/software/fishstatj/en
Gordon, H.S., (1954) The economic theory of a common property resource: the fishery. Journal
of Political Economy 62: 124-142.
Grafton, R.Q., R. Arnason, T. Bjorndal, et al. (2006) Incentive-based approaches to sustainable fisheries, Canadian Journal of Fisheries and Aquatic Sciences 63: 699-710.
Hall, M. A., Roman, M., 2013 Bycatch and non-tuna catch in the tropical tuna purse seine fisheries of the world. FAO Fisheries and Aquaculture Technical Paper No. 568: 249 pp. Houck, J. P., (1965) The relationship of direct price flexibilities to direct price elasticities.
Journal of Farm Economics 47: 789-792.
Huang, K.S. (1994) A Further Look at Flexibilities and Elasticities. American Journal of Agricultural Economics 76:313-317.
Jeon, Y., C. Reid, and D. Squires, (2008) Is there a global market for tuna? Policy implications for tropical tuna fisheries, Ocean Development and International Law 39: 32-50.
Jiménez-Toribio, R., P. Guillotreau and R. Mongruel, (2010) Global integration of European Tuna Markets, Progress in Oceanography 86: 166-175.
29
Just, R., D. Hueth, and A. Schmitz, (2008) The Applied Welfare Economics of Public Policy: A
Practical Approach to Project and Policy Evaluation. Edward Elgar, 712 pp.
Laitinen, K and H. Theil, (1979) The Antonelli matrix and the reciprocal Slutsky matrix,
Economic Letters 3: 153-157.
Miyake, P.M., P. Guillotreau, C.H. Sun, G. Ishimura, 2010, Recent Developments in Tuna
Industry: Stocks, Fishery, Management, Processing, Trade and Markets, FAO Fisheries
and Aquaculture Technical Paper. No. 543. Rome, FAO, 125p.
http://www.fao.org/fishery/publications/technical-papers/en
Morón, J., (2002) The WTPO and its significance in the world tuna purse-seine fishery, SCTB15 Working Paper FTWG-6, Honolulu, Hawaii.
Owen, A.D., (2001) The Relationship between the world price for skipjack and yellowfin tuna raw material for canning and supply from the WCPO and FFA Member Countries’ EEZs, Forum Fisheries Agency, Report 01/32.
Park, Hoanjae, Walter N. Thurman, (1999) On Interpreting Inverse Demand Systems: A Primal Comparison of Scale Flexibilities and Income Elasticities
Segerson, K. and R. Zhou (2014) Individual vs. collective quotas in fisheries management under uncertainty. Working paper, Department of Economics, University of Connecticut Storrs. Smith, M.D., (2012), The new fisheries economics: incentives across many margins, Annual
Review of Resource Economics, Vol. 4: 379-402, August 2012.
SPC, (2011) International Symposium of Tuna fisheries and FADs: Artisanal and industrial FADs: A question of scale, Tahiti, November 28 to December 2, 2011, Fish Newsletter. Stigler, G.J. and R.A. Sherwin, (1985) The extent of the market, Journal of Law and Economics
28(3): 555-585.
Sun, C.H., (1999) Analysis of the market structure and price cointegration of the tuna raw material markets for tuna canneries in the world, Agriculture and Economics 22: 51-72 (in Chinese).
Sun, C.H. and F.S. Chiang, (2010) Inverse demand analysis of the tuna sashimi market in Tokyo, Japan: An application of the Rotterdam inverse demand system, International Workshop on Global Tuna Demand, Fisheries Dynamics and Fisheries Management in the Eastern Pacific Ocean, La Jolla, California, USA, May 13-14.
30
Sun, C.H. and M.C. Hsieh, (2000) Analysis of the price response of Taiwan tuna purse seine fishery in the frozen tuna raw material market in Thailand, Journal of Fisheries Society of
Taiwan 27: 45-58 (in Chinese).
Sun, C.H. and W.H. Hsu, (1998) Analysis of the price cointegration across different countries for the frozen tuna sashimi market in Japan, Selected Paper of the Ninth International Conference of the International Institute of Fisheries Economics and Trade, Tromsø, Norway.
Sun, C.H., M.N. Maunder, A. Aires-da-Silva, and W.H. Bayliff, (2010), Increasing the economic value of the eastern pacific ocean tropical tuna fishery: tradeoffs between longline and purse seine fishing, International Workshop on Global Tuna Demand, Fisheries Dynamics and Fisheries Management in the Eastern Pacific Ocean, La Jolla, California, USA, May 13-14, 2010.
Vestergaard, N., (2010) Principal-agent problems in fisheries, Handbook of Marine Fisheries
Conservation and Management. Ed. R. Quentin Grafton, R. Hilborn, D. Squires, M. Tait
and M. Williams. Oxford University Press 563-571.
Webster, D.G. (in press) Beyond the Tragedy in Global Fisheries. Cambridge, MA: MIT Press. Wessels, C.R. and J.E. Wilen, (1994) Seasonal patterns and regional preferences in Japanese
household demand for seafood, Canadian Journal of Agricultural Economics, 42: 87-103. Wilen, J., (2000) Renewable resources economists and policy: what differences have we made?