HAL Id: hal-01084251
https://hal.inria.fr/hal-01084251
Submitted on 18 Nov 2014
HAL is a multi-disciplinary open access archive for the deposit and dissemination of sci-entific research documents, whether they are pub-lished or not. The documents may come from teaching and research institutions in France or abroad, or from public or private research centers.
L’archive ouverte pluridisciplinaire HAL, est destinée au dépôt et à la diffusion de documents scientifiques de niveau recherche, publiés ou non, émanant des établissements d’enseignement et de recherche français ou étrangers, des laboratoires publics ou privés.
Supramodal processing optimizes visual perceptual
learning and plasticity
Nicolas Zilber, Philippe Ciuciu, Alexandre Gramfort, Leila Azizi, Virginie van
Wassenhove
To cite this version:
Nicolas Zilber, Philippe Ciuciu, Alexandre Gramfort, Leila Azizi, Virginie van Wassenhove. Supramodal processing optimizes visual perceptual learning and plasticity. NeuroImage, Elsevier, 2014, 93, pp.32 - 46. �10.1016/j.neuroimage.2014.02.017�. �hal-01084251�
Supramodal processing optimizes visual perceptual learning and plasticity
Nicolas Zilbera,b, Philippe Ciuciua,b, Alexandre Gramforta,b,c, Leila Azizi a,d,e, Virginie vanWassenhovea,d,e,1
Author affiliations: a
CEA, DSV/I2BM, NeuroSpin Center, F-91191 Gif-sur-Yvette, France
b
INRIA, Parietal team, Saclay, France
c
Institut Mines-Télécom, Télécom ParisTech, CNRS LTCI, 75014 Paris, France
d
INSERM, U992, Cognitive Neuroimaging Unit, F-91191 Gif-sur-Yvette, France
e
Univ Paris-Sud, Cognitive Neuroimaging Unit, F-91191 Gif-sur-Yvette, France
Corresponding author: 1
CEA.DSV.I2BM.NeuroSpin - INSERM Cognitive Neuroimaging Unit NeuroSpin MEG, Brain Dynamics group
Bât 145 Point Courrier 156 F-91191 Gif-sur-Yvette France Phone: +33 (0)1 6908 1667
KEYWORDS: MEG, multisensory, audition, coherence, dual-stream, sensory substitution
ABSTRACT
Multisensory interactions are ubiquitous in cortex and it has been suggested that sensory cortices may be supramodal i.e. capable of functional selectivity irrespective of the sensory modality of inputs (Pascual-Leone and Hamilton, 2001; Ricciardi and Pietrini, 2011; Voss and Zatorre, 2012; Renier et al., 2013). Here, we asked whether learning to discriminate visual coherence could benefit from supramodal processing. To this end, three groups of participants were briefly trained to discriminate which of a red or green intermixed population of random-dot-kinematograms (RDKs) was most coherent in a visual display while being recorded with magnetoencephalography (MEG). During training, participants heard no sound (V), congruent acoustic textures (AV) or auditory noise (AVn); importantly, congruent acoustic textures shared the temporal statistics – i.e. coherence – of visual RDKs. After training, the AV group significantly outperformed participants trained in V and AVn although they were not aware of their progress. In pre- and post-training blocks, all participants were tested without sound and with the same set of RDKs. When contrasting MEG data collected in these experimental blocks, selective differences were observed in the dynamic pattern and the cortical loci responsive to visual RDKs. First and common to all three groups, vlPFC showed selectivity to the learned coherence levels whereas selectivity in visual motion area hMT+ was only seen for the AV group. Second and solely for the AV group, activity in multisensory cortices (mSTS, pSTS) correlated with post-training performances; additionally, the latencies of these effects suggested feedback from vlPFC to hMT+ possibly mediated by temporal cortices in AV and AVn groups. Altogether, we interpret our results in the context of the Reverse Hierarchy Theory of learning (Ahissar and Hochstein, 2004) in which supramodal processing optimizes visual perceptual learning by capitalizing on sensory-invariant
1
INTRODUCTION
Increasing evidence for multisensory integration throughout cortex has challenged the view that sensory systems are strictly independent (Driver and Spence, 2000; Ghazanfar and Schroeder, 2006), questioning in turn the innate specialization of sensory cortices. For
instance early in development, auditory neurons can respond to light patches when rewired to receive visual information (Roe et al., 1990; Mao et al., 2011) and cooling specific parts of auditory cortex in deafened cats selectively perturbs the detection of visual motion and localization (Lomber et al., 2010). In congenitally blind humans, the cortical area hMT+ responsive to visual motion (human homolog of MT/V5 in monkeys) is recycled for auditory or tactile processing (Poirier et al., 2005; Ricciardi et al., 2007; Bedny et al., 2010; Watkins et al., 2013) and the ventral and dorsal visual processing streams develop their functional
specificity even when deprived of direct visual experience (Striem-Amit et al., 2012). Consistent with these observations, the “metamodal theory” (Pascual-Leone and Hamilton, 2001) and the “supramodal hypothesis” (Ricciardi and Pietrini, 2011; Voss and Zatorre, 2012) have suggested that some cortical areas may be naturally capable of functional selectivity irrespective of the sensory modality of inputs, hence of functional recycling. However, several questions have been raised (Bavelier and Hirshorn, 2010) among which: is functional
recycling a consequence of sensory deprivation during a sensitive period or does it rely on pre-existing supramodal computational capabilities (Bedny et al., 2010; Morrone, 2010; Dormal and Collignon, 2011; Renier et al., 2013)?
In order to specifically address this issue, we trained non-sensory impaired individuals on a difficult and novel visual task and asked whether visual learning and plasticity would benefit from matched audiovisual stimulation. For this, three different groups of twelve individuals were recorded with magnetoencephalography (MEG) while they performed a visual
discrimination task. MEG blocks consisted of a pre-training, a 20 minutes individualized training and a post-training (Figure 1A). It should be stressed that a short-training (20 minutes total) was used in all three training conditions; hence, we were interested in the possible effects of multisensory learning within a very short time period which may not match those obtained over days of training (e.g. (Shams and Seitz, 2008)). The main task consisted in determining which of a red or green intermixed population of random-dot-kinematograms (RDKs) was most coherent in the visual display (Figure 1B); hence, this task implicated motion-color binding (what/where integration) and visual motion coherence discrimination. The pre- and post-training sessions were exclusively visual and tested the same RDK
coherence levels for all three groups of participants; on the other hand, training sessions were individualized with regards to the RDK coherence levels and the training context.
Specifically, participants could be trained in silence (V), with correlated acoustic textures (AV), or with auditory noise (AVn, control group). In the AV group, AV stimuli sharing redundant temporal regularities were designed using auditory analogs of visual RDKs i.e. acoustic textures (Overath et al., 2010) (Figure 1C). In the control AVn group, the auditory stimulus was filtered noise. Both AV and AVn groups were told to neglect the sounds played in the background; in the AV group and unbeknownst to participants, the coherence of acoustic textures matched that of the target RDK (see Materials and Methods, Figure 1C).
Crucially, and for all participants, the RDK coherence levels were the sole criterion enabling to properly perform the task: first, the direction taken by the coherent dots was randomized
across trials and orthogonal to the coherence level; second, acoustic textures could not inform on the color of the most coherent RDK albeit shared their dynamics; third, acoustic textures were kept minimally accessible to participants’ awareness. Additionally, all reported results exclusively focus on the comparison of pre- and post-training data in which no acoustic information was delivered to any of the participants (Figure 1A): hence, we do not address the issue of multisensory integration per se (which takes place a priori during the training blocks) and instead focus on the effect of participants’ training history on perceptual learning and cortical plasticity.
Figure 1. Experimental design and stimuli. Panel A: An MEG session for one individual was composed of
several blocks: first, the luminance of the red and green Random Dot Kinematograms (RDKs) was calibrated using Heterochromatic Flicker Photometry (HFP). Luminance calibration was followed by a few familiarization trials to the task during which participants received feedback. In the pre-training block, all participants were presented with stimuli that were solely visual. The pre-training data established the set of coherence levels for the training session based on an individual’s coherence discrimination threshold. In the following four training blocks, participants were trained with four levels of RDK coherence. The four training blocks lasted 20 minutes and were without feedback. The training could be visual only (V), audiovisual using acoustic textures (AV) or audiovisual using acoustic noise (AVn). In the post-training block, each individual’s coherence discrimination threshold was established with visual stimulation only. In the last block, a localizer provided an independent
means to source localize the Human motion area hMT+ using combined functional MEG localizer data and anatomical MRI (see Methods). Panel B: An experimental trial consisted in the presentation of a fixation cross followed by the appearance of two intermixed and incoherent RDKs (red and green populations). After 0.3 to 0.6 s, one of the two RDKs became more coherent than the other: the red RDK is here illustrated as the most coherent. Participants were asked to indicate which of the red or green population was most coherent irrespective of the direction of motion. Panel C: Sample spectrogram in log(frequency) as a function of time depicting an acoustic texture. By analogy to a visual RDK, the level of coherence in an acoustic texture was defined as the number of frequency ramps sharing the same slope in a given frequency range. Here, the spectrogram illustrates an incoherent acoustic texture lasting 500 ms followed by a 75% coherent acoustic texture lasting 1 s. Three groups of participants underwent three types of training. During V training, participants were solely provided with visual stimuli; during AV training, an acoustic texture was paired with the most coherent RDK population and the acoustic transition from incoherent to coherent was synchronized with the visual transition in the RDKs; during the AVn control training, the sound was a white noise unrelated to the visual RDKS. Inter-stimulus intervals were randomly drawn from 0.6 to 0.8 s. min = minutes; s = seconds; ms = milliseconds.
2
MATERIALS AND METHODS
2.1
Participants
All participants were right-handed, had normal hearing and normal or corrected-to-normal vision. Participants’ ages ranged between 18 and 28 years old (mean age: 22.1 ±2.2 s.d.). Prior to the study, participants were randomly split into three training groups, namely: an only visual training group (V, n=12, 4 females), an audiovisual training group using acoustic textures (AV group, n=12, 6 females) or using acoustic noise (AVn which is also a control group, n=12, 6 females). Before the experiment, all participants provided a written informed consent in accordance with the Declaration of Helsinki (2008) and the local Ethics Committee on Human Research at NeuroSpin (Gif-sur-Yvette, France).
The magnetoencephalography (MEG) experiment was conducted in a darkened soundproof magnetic-shielded room (MSR). Participants were seated in upright position under the MEG dewar and faced a projection screen placed 90 cm away. We used a Panasonic DLP projector (model PT-D7700E-K, Panasonic Inc, Kadoma, Japan) with a refresh rate of 60 Hz. The sound pressure level was set at a comfortable hearing level (~65 dB) for all participants. Participants were explained the task and stayed in contact at all times with the experimenter via a microphone and a video camera. Stimuli (see videos S1 and S2 for AV and AVn, respectively) were designed using Matlab (R2010a, Mathworks Inc.) with Psychtoolbox-3 (Pelli, 1997) on a PC (Windows XP).
The experiment consisted of eight consecutive blocks (Figure1a). First, Heterochromatic Flicker Photometry (HFP) was used for luminance calibration of the red and green Random Dots Kinematograms (RDKs) on a per individual basis. Second, participants were
familiarized with the task and the stimuli: they were presented with 16 easy trials displaying two intermixed Random Dot Kinematograms (RDKs). One of the two RDKs was 100% coherent – i.e. all dots took the same direction of motion. Participants were asked to report the color of the most coherent RDK by pressing a “green” (green RDK) or a “red” (red RDK) button. During this short familiarization block, participants were provided with feedback on their performance. No other feedback was provided in the remainder of the experimental session.
After this familiarization block, participants underwent a 12 minutes pre-training session, hereafter referred to as PRE training. As in the familiarization block, participants were asked to report as accurately as possible which of the two RDKs was most coherent by selecting the “green” (green RDK) or “red” button (red RDK). This task was subsequently used in all experimental blocks (i.e. PRE, POST and training blocks). Additionally in PRE and POST training (see below), participants were asked to evaluate their confidence on a scale of 1 to 5
after they provided their main response. No feedback was provided. Inter-trials intervals (ITI) ranged from 0.6 to 0.8 s. Crucially, during PRE and POST training, all participants (V, AV and AVn) were tested with visual stimuli i.e. without any sound. In the PRE training block, the initial coherence discrimination threshold of participants was assessed by testing seven levels of visual RDK coherence, namely: 15%, 25%, 35%, 45%, 55%, 75% and 95%. PRE training was followed by four training blocks of 5 min each for a total of 20 minutes of training. The training consisted of the same task as in the PRE and POST training. Stimuli were presented without any sound (V group), with correlated acoustic textures (AV group) or with uncorrelated acoustic noise (AVn group). During training, four visual RDK coherence levels were tested and corresponded to ±10% and ±20% of the individual’s PRE training coherence discrimination threshold. Hence, participants underwent individualized training. 28 trials of each coherence level were presented for a total of 112 trials in a given training block. The training was followed by a 12 minutes post-training session (POST training). POST training evaluated participants’ threshold after training. As in the PRE training block, POST training was solely visual for all groups (V, AV, and AVn) and participants were asked to rate their confidence after providing their response. In PRE and POST training, a total of 196 trials were tested (28 trials / coherence level).
Participants never received any feedback after the familiarization trials. Rest periods were provided to participants after each experimental block. Crucially, the color of the most coherent RDK was counterbalanced and the directions of coherent motion were pseudo-randomized across all trials – hence, the direction of motion was orthogonal to the main task (“coherence”).
After the POST training block, a localizer was used to provide an accurate source localization of the hMT+ area with MEG. For this, participants passively viewed a sequence in which a RDK was either fully incoherent for 1.5 s or fully incoherent for 0.5s followed by 95%
coherence for 1s. Each sequence was presented 60 times for a total of 120 presentations during the localizer block.
2.3
Visual stimuli
The red and green RDKs were individually calibrated to isoluminance using HFP. To prevent local tracking of dots, a white fixation cross was located at the center of a 4° gray disk acting as a mask (Figure 1B). RDKs were presented within an annulus of 4°-15° of visual angle. Dots had a radius of 0.2°. The flow of RDKs was 16.7 dots per deg2 × sec with a speed of
10°/s. During the first 0.3 to 0.6 s of a given trial, both RDKs were incoherent (0% of coherent motion). The duration of the incoherent phase was pseudo-randomized across each trial in order to increase the difficulty of the task specifically by preventing participants from expecting the onset of the transition from incoherent to coherent motion. After the incoherent phase, one RDK became more coherent than the other during one second. The direction of coherent dots was comprised within an angle of 45°-90° around the azimuth. 50% of the trials were upward coherent motion and the remaining 50% of the trials were downward coherent motion. At each frame, 5% of all dots were randomly reassigned to new positions and
incoherent dots to a new direction of motion. Dots going into collision in the next frame were also reassigned a new direction of motion. On average, the life-time of the dots was set to 180 ms (±165 s.d.) and could be approximated by a Weibull distribution of parameters α= 172 ms and β=1.04.
A sample spectrogram of an auditory stimulus is provided in Figure 1C. All auditory stimuli were created with a sampling frequency of 44.1 kHz. Acoustic textures (Overath et al., 2010) were developed to be analogous and congruent to visual RDKs. Specifically, each visual dot was designed as if to emit a sound s(t) corresponding to a linear frequency-modulated ramp whose slope depended on the direction taken by the visual dot: 2 . e . . where 2 ! . The angle between the direction of the dot and the azimuth is denoted by φ and the initial sound frequency is denoted by f0. For instance, a visual motion direction
of 45° would correspond to a slope of 2 octaves per second in the acoustic space. The maximal slope authorized in acoustic space was set to 16 octaves/s corresponding visual motion directions of 82.9°-90°. Each ramp f0 was attributed according to the initial vertical
position of the corresponding visual dot: the lower the position of the dot on the screen, the lower the f0 in acoustic space. Hence, a visual dot moving upwards was associated with an
ascending acoustic ramp, whereas a visual dot moving downwards was associated with a descending acoustic ramp. Note that sensory substitution devices (e.g., the vOICe (Meijer, 1992) and the EyeMusic (Levy-Tzedek et al., 2012a)) have also started capitalizing on such intuitive perceptual associations (Melara and O’Brien, 1987; Maeda et al., 2004)). The auditory frequencies that were used ranged between 200 and 5000 Hz. Should a ramp cross one of these limits, it "continued" at the other extreme of this frequency band. The duration of a ramp was identical to the life-time of a visual dot. Importantly, when visual dots moved coherently, they did not necessarily emit the same sounds because the initial auditory frequencies were likely different. However, the variations of the acoustic elements (i.e. the slopes of the ramps) were identical. Hence, the quantification of visual coherence in RDK matched the proportion of ramps having the same slope in acoustic space.
In the AVn training, acoustic noises with the same duration and amplitude of acoustic textures were used to test whether the simple presentation of a sound could account for the results. We
specifically designed this control to test the hypothesis that the introduced correspondences (matching the spectral characteristics of the acoustic textures with the spatial characteristics of the visual stimuli) were relevant for learning in this task. Hence, the noise y(t) was
conservatively designed within the same frequency range (200-5000 Hz) as the acoustic textures used in the AV group: y 2 . e"#$%& '() * '+, '+, . , where
rand denotes the uniformly distributed pseudorandom function whose values are contained in
the interval -0, 11, fmin = 200 Hz and fmax= 5000 HZ.
2.5
Psychophysical analysis
The coherence discrimination threshold was set to 75% of correct performance and quantified by fitting a Weibull function (Wichmann and Hill, 2001) to each individual’s data using:
2 3, 4, 5 1 6 0.5 *89:;< =
>
. With coh as motion coherence level, ψ as the fitted
psychometric function, and α and β the parameters determined by the damped Gauss-Newton method. A mixed-design ANOVA containing the within-subject factor test (pre-and post-training) and the between-subjects factor training group (V, AV and AVn) was carried out separately on the perceptual thresholds, the confidence ratings and the RTs using the software
R (R Core Team 2013). If a main effect of the factor test was found, a post-hoc analysis using
Bonferroni-corrected paired t-tests on each group was conducted. Likewise, a main interaction between the two factors test and training was analyzed with a Bonferroni-corrected two-sampled t-test between each pair of groups.
2.6
MEG data acquisition
Brain magnetic fields were recorded in a MSR using a 306 MEG system (Neuromag Elekta LTD, Helsinki). MEG recordings were sampled at 2 kHz and band-pass filtered between 0.03-600 Hz. Four head position coils (HPI) measured the head position of participants before each block; three fiducial markers (nasion and pre-auricular points) were used for digitization and
anatomical MRI (aMRI) immediately following MEG acquisition. Electrooculograms (EOG, horizontal and vertical eye movements) and electrocardiogram (ECG) were simultaneously recorded. Prior to the session, 5 minutes of empty room recordings were acquired for the computation of the noise covariance matrix.
2.7
Anatomical MRI acquisition and segmentation
The T1 weighted aMRI was recorded using a 3-T Siemens Trio MRI scanner. Parameters of the sequence were: voxel size: 1.0 x 1.0 x 1.1 mm; acquisition time: 466s; repetition time TR = 2300ms; and echo time TE= 2.98 ms. Cortical reconstruction and volumetric segmentation of participants’ T1 weighted aMRI was performed with FreeSurfer
(http://surfer.nmr.mgh.harvard.edu/). This includes: motion correction, average of multiple
volumetric T1 weighted images, removal of non-brain tissue, automated Talairach
transformation, intensity normalization, tessellation of the gray matter white matter boundary, automated topology correction, and surface deformation following intensity gradients (Dale et al., 1999; Fischl and Dale, 2000). Once cortical models were complete, deformable
procedures could be performed including surface inflation (Fischl et al., 1999a) and
registration to a spherical atlas (Fischl et al., 1999b). These procedures were used with MNE (Gramfort et al., 2013a, 2013b) to morph current source estimates of each individual onto the FreeSurfer average brain for group analysis.
2.8
MEG data preprocessing and Event Related Fields (ERFs) analysis
Data analysis was done in accordance with accepted guidelines for MEG research (Gross et al., 2012). Signal Space Separation (SSS) was carried out using MaxFilter to remove external interferences and noisy sensors (Taulu and Simola, 2006). Ocular and cardiac artifacts wereremoved by creating signal space projections (SSP) based on average-locked responses to the QRS heart complex recorded with ECG and to the blinks recorded with EOG. About 2 to 3 components were projected out of the raw data. Next, raw data were band-pass filtered between 1-40 Hz and down-sampled to 250 Hz.
For the main analysis, data were epoched from -200 ms (baseline) to +1000 ms around the onset of coherent RDK. Epochs were averaged for each individual according to the conditions of interest, namely: across all coherence levels (196 trials) or for each coherence level (28 trials). Trials corrupted by muscle or movement artifacts (less than 10% of all trials) were rejected by visual inspection using Fieldtrip (Oostenveld et al., 2011). Additionally, epochs were averaged according to each individual’s pre- and post-training thresholds into three categories: ‘hard’ (coherence levels below the POST-training threshold), ‘learned’ (coherence levels between the PRE- and the POST-training thresholds) and ‘easy’ (coherence levels above the PRE-training threshold). Evoked responses were smoothed with a Savitzky-Golay filter (Savitzky and Golay, 1964) consisting of fitting a 2nd order polynomial to each sliding
window of 35 samples. This procedure is approximately equivalent to the application of a low-pass filter of 3 dB cutoff frequency set to 37.5 Hz (Schafer, 2011) without reduction of peak amplitudes.
2.9
MRI-MEG coregistration and source reconstruction
The co-registration of MEG data with an individual’s aMRI was carried out by realigning the digitized fiducial points with the multimodal markers visible in MRI slices. We used a two-steps procedure to insure reliable coregistration between MRI and MEG coordinates: using MRILAB (Neuromag-Elekta LTD, Helsinki), fiducials were aligned manually with the multimodal markers visible on the MRI slice; an iterative procedure was then used to realign
all digitized points (about 30 more supplementary points distributed on the scalp of the subject were digitized) with the scalp tessellation using the mne_analyze tools within MNE (Gramfort et al., 2013b). Individual forward solutions for all source reconstructions located on the cortical sheet were next computed using a 3-layers boundary element model (Hämäläinen and Sarvas, 1989; Mosher et al., 1999) constrained by the individual aMRI. Cortical surfaces were extracted with FreeSurfer and decimated to about 5,120 vertices per hemisphere with 4.9 mm spacing. The forward solution, noise and source covariance matrices were used to
calculate the depth-weighted (parameter γ = 0.8) and noise-normalized dynamic statistical parametric mapping (dSPM) (Dale et al., 2000) inverse operator. This unitless inverse
operator was applied using a loose orientation constraint on individuals’ brain data (Lin et al., 2006) by setting the transverse component of the source covariance matrix to 0.4. The
reconstructed current orientations were pooled by taking the norm, resulting in manipulating only positive values. The reconstructed dSPM estimates time series were interpolated onto the FreeSurfer average brain for group analysis (Fischl et al., 1999b) and common referencing.
Figure 2. MNE (dSPM) source reconstruction and regions of interest (ROIS). Panel A: Evoked Response
Fields (ERF) in sensor space (gradiometers) obtained in response to the presentation of the hMT+ localizer. Specifically, we report the evoked component obtained by subtracting the ERF in response to fully incoherent motion (0%) from the ERF in response to a 95% coherent motion. These data were collected during the localizer block and pooled across all individuals (i.e. all three training groups: V, AV, and Avn; n=36 participants).The time course of all gradiometers is provided in the top graph. The topography of the differential evoked
component averaged over 100 to 300 ms post-stimulus onset is provided for the norm of the gradiometers in the middle graph. The corresponding current source estimates (MNE, dSPM) is provided in the bottom graph. Panel
B: ERF in sensor space (gradiometers) obtained in response to the presentation of incoherent visual RDKs. PRE
and POST training data were pooled together across all three training groups (n=36) in order to define the regions of interest (ROIs). The time course of the evoked response obtained at the onset of all visual stimuli is depicted in the top graph for all gradiometers. Distinct evoked components can be seen starting at 100 ms. The topography of the ERF is provided in the middle graph for the norm of gradiometers averaged over 100 to 300 ms post-incoherence onset. The corresponding current source estimates (MNE, dSPM) are provided in the bottom graph. The extent of a given label or region of interest (ROI) in source space was defined by thresholding the dSPM estimates at the 90th percentile of all dSPM values. FEF: Frontal Eye Field. IPS: Inferior Parietal Sulcus. pSTS: posterior Superior Temporal Sulcus. AC: Auditory Cortex. mSTS: middle Superior Temporal Sulcus. ITC: Inferior Temporal Cortex.
2.10
Functional localizer for hMT+ and selection criteria for the regions of
interest (ROIs)
One major prediction in this study was the that perceptual improvements in coherence
discrimination thresholds would be commensurate with post-training activity in hMT+ which is known to be responsive to global (Watson et al., 1993; Zeki et al., 1993; Tootell et al., 1995) and translational (Morrone et al., 2000) motion processing. Hence, after source reconstruction, hMT+ was localized on a per individual basis by contrasting the current source estimate obtained to the presentation of 95% coherent motion against the incoherent (0%) portion of the hMT+ localizer. Specifically, the evoked response fields (ERFs) elicited by the transition to full coherence in the visual display (i.e. going from 0% to 95% coherence) were contrasted with the ERFs elicited at the same latency but in the absence of transition (i.e. 0% of coherence). A first inspection of the ERF contrast averaged over all individuals in sensor space (Fig. 2A, upper and middle panel) showed a main evoked response spanning ~100 to ~300 ms post-transition onset. The evoked response was source reconstructed using MNE-dSPM; the extent of the area hMT+ in source space was determined by thresholding the average source estimate amplitudes over 100-300 ms above the 90th percentile of all dSPM
values covering the entire cortex (Fig. 2A, lower panel).
Figure 2B reports additional regions of interest (ROI) or labels which were identified at the group-level by source reconstructing the grand average evoked field response to the
presentation of incoherent visual RDKs which combined data from all three training groups (V, AV and AVn) in the pre- and in the post-training sessions. The most responsive areas (selected by thresholding to the 90th percentile of all dSPM values) were manually labeled using the Freesurfer neuroanatomical parcellation. The obtained ROIs comprised: bilateral primary and secondary visual cortices (V1 and V2, respectively), precuneus, visual area V4,
hMT+, Inferior Temporal Cortex (ITC), Auditory Cortex (AC), posterior Superior Temporal Sulcus (pSTS), Inferior Parietal Sulcus (IPS), frontal eye-field (FEF) and the right middle Superior Temporal Sulcus (mSTS). The time courses reported in a label were computed by averaging dSPM estimate time courses over all vertices within the label. It is worth noting that dSPM values are here only positive and hence do not cancel out after averaging.
2.11
Neurometric functions
For each individual, neurometric curves (Britten et al., 1992; Gold et al., 2010) were computed using pre- and post-training current source estimates in hMT+ averaged between 200 and 500 ms after coherence onset. The amplitudes of the cortical responses to the presentation of each of the 7 levels of coherence were fitted by a Weibull function:
? 3, @, A, 4, 5 @ 6 @ 6 A *89:;< =
>
. With coh as motion coherence level, Y as the
fitted neurometric function, and M, m, α and β the parameters determined by the damped Gauss-Newton method. Individual neurometric thresholds were defined as the level of coherence corresponding to the half-amplitude of the sigmoid.
2.12
Statistics
The effect of training was tested using the POST minus PRE contrasts across all coherence levels separately for each ROI using F-tests combined with non-parametric permutation tests (Maris and Oostenveld, 2007) that provide corrected p-values for multiple comparisons. For each signed permutation (N= 20000), time clusters were defined on the basis of temporal adjacency by regrouping samples whose F-statistic was larger than 3.3 (i.e. p-value inferior to 0.05 for an F-test with 2 x 33 degrees of freedom). Cluster-level statistics were then calculated
by taking the sum of the F-values within the cluster. Only temporal clusters with corrected p-values ≤0.05 are reported. The significance of the contrasts were also tested in each group using non-parametric pairwise two-tailed permutation tests with the cluster threshold set to 2.2 (i.e. p-value inferior to 0.05 for a two-sided t-test with 11 degrees of freedom).
All correlation tests were assessed with Pearson correlation coefficients ρ under the null hypothesis Ho: ρ=0 and with the alternative H1: ρ≠0 using a Student t-test on the statistic
B√ 6 2 D1 6 BF E, where n is the number of samples. Outliers were automatically
detected and rejected by using a leave-one-out approach (Weisberg, 2005) consisting of estimating the distribution N(m,σ) of residuals based on (n-1) observations (each observation is left out one after another). Extreme residuals (i.e. above and below m± k.σ, where k= 2.5 is considered to be a reasonable choice (Rousseeuw and Leroy, 1987)) are identified and the corresponding observations set as outliers.
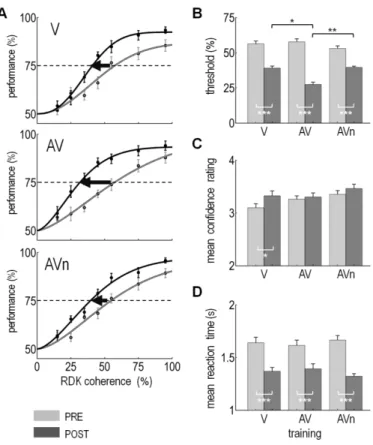
Figure 3. Behavioral results as a function of training type (V, AV, or AVn). Panel A: Mean psychometric
curves (± 1 s.e.m.) before (PRE, light grey) and after (POST, dark grey) training. Mean performance as a function of visual coherence levels in V (top), AV (middle) and AVn (bottom) training. Each group included 12 individuals. The mean perceptual threshold corresponds to the mean coherence value of one RDK population with a correct response rate of 75% (black dashed line). Perceptual threshold improvements were significant in all groups (black arrows). Panel B: Each individual psychometric curve was fitted with a Weibull function in order to extract an individual’s discrimination threshold. Here, we report the mean threshold obtained in PRE (light grey) and POST (dark gray) training data. In PRE training, no significant differences in perceptual
thresholds were found among the three groups (F2,33= 1.12 , p = 0.34, mixed-design ANOVA); in POST training, all three groups showed a significant difference in their mean perceptual threshold as compared to the PRE training data (F1,33= 132, p= 4.5e-13, mixed-design ANOVA). A significant interaction between training groups was found (F2,33= 8.3, p= 1.2e-3, mixed-design ANOVA): as can readily be seen, the post-training threshold in the AV group was significantly lower than the one obtained in the V and in the AVn groups (post-hoc analysis, with Bonferroni correction). Panel C: Mean confidence ratings across all coherence levels in the V, AV and AVn groups in PRE and POST training. In PRE, no significant differences of confidence ratings were observed across the three groups (F2,33= 0.61 , p = 0.55, mixed-design ANOVA). In POST, a significant improvement of confidence rating was observed (F1,33= 7.2, p= 0.011) but solely in the V group after post-hoc analysis
(Bonferroni). No significant interaction was found between training groups (F2,33= 1.35, p= 0.27) . Panel D: Mean reaction times (RTs) across all coherence levels in the V, AV and AVn groups in PRE and POST training. In PRE, no significant differences of RTs was observed across training groups (F2,33= 0.007 , p = 0.99, mixed-design ANOVA). In POST training, all three training groups showed a significant decrease of their RT (F1,33= 95, p= 3e-11) but no significant interaction was found between the training groups (F2,33= 1.5, p= 0.23). ‘*’:
corrected p value inferior to 0.05; ‘**’: corrected p value inferior to 0.01; ‘***’: corrected p value inferior to 0.001.
3
RESULTS
3.1
AV training improves performance best
First, we tested whether participants improved on the task by comparing each individual’s coherence discrimination threshold before and after training (Fig. 3A) using a mixed-design ANOVA (see Materials and Methods). The post-training thresholds of individuals are also given as a function of training thresholds in all three groups in Supp. Fig. 1A. In pre-training, all participants performed similarly well on the coherence discrimination task and the observed perceptual thresholds did not significantly differ between the three groups of
individuals (F(2,33= 1.12) , p = 0.34). In all three groups, training successfully improved the performance of participants when comparing pre- and post-training coherence discrimination threshold (F(1,33)= 132, p= 4.5e-13). Crucially, a significant interaction between training type and pre/post-training (F(2,33)= 8.3, p= 1.2e-3) showed that perceptual improvements in the AV group significantly outperformed those observed in the V and AVn groups only in post-training (Fig. 3B, post-hoc analysis with Bonferroni correction). It is important to note that since the pre- and post-training coherence discrimination thresholds were solely
established on the basis of visual RDK presentation, any differences in post-training
performance can be solely accounted for by training history and not by the mere presence of AV stimuli. Additionally, no significant changes in the slope of the psychometric function (i.e. the beta parameter) were observed after training (F1,33= 0.36, p=0.55, mixed-design
ANOVA), no interactions between the slope of the psychometric function and the training type was observed (F2,33= 1,63, p= 0.21) (cf. Supp. Fig. 1B) and no significant correlation
reported in Supp Fig 1C). Altogether, these results strongly support a genuine change in participants’ sensitivity to motion coherence.
A similar mixed-design ANOVA was carried out using the reaction times (RTs) of
individuals as dependent variable. All participants showed shorter post-training RTs (Fig. 3B, F(1,33)= 132, p= 4.5e-13) but no significant interactions between RT and training type was found (F(2,33)= 1.5, p= 0.23). The mean RT for each group was otherwise comparable before and after training (F(2,33)= 0.007 , p = 0.99, mixed-design ANOVA).
During pre- and post-training, participants were asked to rate their confidence level following their coherence discrimination response. Contrasting the mean confidence ratings before and after training across all coherence levels (Fig. 3D), a mixed-design ANOVA revealed a main effect of session (2: pre- and post-training) on confidence rating (F(1,33) = 7.2, p = 0.011); no significant interaction between session and training type was observed (F(2,33) = 1.35, p = 0.27). However, post-hoc analysis revealed that the main effect of session could be solely attributed to the V group although the groups were not statistically distinguishable (F(2, 33) = 0.61, p = 0.55). Thus, and surprisingly, while AV learners showed the largest improvement in performance after training, they were not aware of their own improvements contrarily to participants in the V group (Figure 3D).
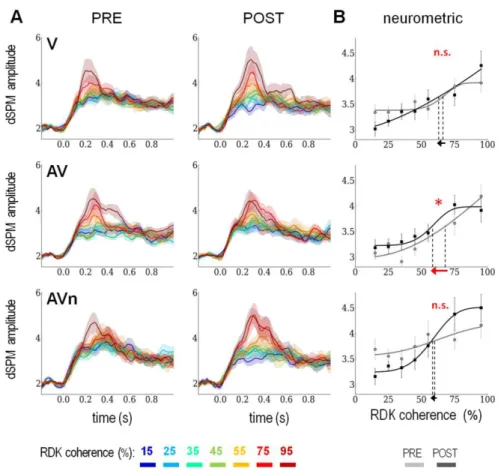
Figure 4. Pre- and post-training hMT+ response as a function of visual RDK coherence levels and
neurometric functions. Panel A: Time course of current source estimates (dSPM amplitudes) in bilateral hMT+
for the different training groups (V: top, AV: middle and AVn: bottom panels) as a function of RDK coherence levels (cf. color scheme legend). Data obtained in the pre- and post-training blocks are reported in the left and right panels, respectively. A prominent evoked response peaking at ~200 ms post-coherence onset can readily be seen in all groups and for all coherence levels. Additionally, the higher the visual coherence, the higher the amplitude of the cortical response. While the profile of responses was similar across the three groups before training, a distinct response pattern was found after training. Specifically, the V and AVn showed an increased spread of the response amplitudes as a function of visual coherence levels whereas the AV group did not. In order to characterize this response pattern, a 200 to 500 ms time period was selected, averaged and used to construct the individual neurometric curves consisting of the amplitude of the current source estimate as a function of stimulus coherence level. Panel B: The current source estimates (dSPM) in hMT+ were averaged from 200 to 500 ms post-coherence onset as a function of the seven coherence levels in V (top), AV (middle) and AVn (bottom). This quantification was performed separately for the pre- and post-training data (grey and black, respectively). The brain response in hMT+ of each individual was quantified for each coherence levels. To obtain the neurometric function of an individual, the amplitudes of the current source estimates in hMT+ were plotted as a function of visual RDK coherence level. Each neurometric function allowed deriving a neurometric threshold via Weibull fits (i.e. the level of coherence corresponding to half the amplitude of the sigmoid curve). For illustration purposes, we report the averaged fits together with the grand average data. The neurometric thresholds obtained in pre- and post-training were compared by carrying out a two-tailed paired t-test. Using this method, we show that neither V or AVn showed a significant change in neurometric threshold (V: t11= -0.2, p=
0.84; AVn: t11= -0.36, p= 0.72) whereas AV showed a significant decrease of neurometric threshold (t11 = -2.34, p= 0.039). This suggests that the neural response to a given coherence level, hence the neural selectivity in hMT+, has significantly changed according to the type of training provided to the participants. Specifically, the sensitivity to coherence discrimination in hMT+ significantly improved solely in the AV group.
3.2
hMT+ plasticity and sensitivity profiles
According to previous reports (Ahlfors et al., 1999; Lam et al., 2000; Maruyama et al., 2002; Nakamura, 2003; Aspell et al., 2005; Amano et al., 2006; Händel et al., 2007; Mercier et al., 2009), the amplitude of the evoked responses in hMT+ increases with RDK coherence levels irrespective of participants’ performance. As a first approach, we thus separately classified trials as a function of the physical coherence of the visual stimuli (i.e. 7 RDK coherence levels ranging from 15% to 95%) per training type and as a function of pre- and post-training. After source reconstruction, a similar pattern of response in hMT+ could be seen in all three groups with a clear evoked response in hMT+ from ~200ms to ~500ms post-stimulus onset (Fig. 4A).
One hypothesis on the origin of perceptual improvements was that the sensitivity of hMT+ response to RDK coherence would improve after training. When contrasting the average hMT+ response profiles in pre- and post-training (Fig. 4A), the spread of the hMT+ response amplitudes as a function of RDK coherence after training appeared much larger in the V and AVn groups; surprisingly however, the AV group did not show such changes. A linear regression of the hMT+ amplitude estimates as a function of RDK coherence levels clearly indicated that the AV group showed no significant differences in pre- vs. post-training (Supp. Fig S2A, beta values). At first glance then, these results suggested that the perceptual
improvements in the AV group could not be accounted for by hMT+ plasticity.
Using a similar approach to psychometric characterization, it is well known that hMT+ sensitivity to coherent motion can be characterized by a neurometric function (Britten et al.,
1992); one advantage of neurometric thresholds is that they are comparable to psychometric functions depending on the experimental conditions (Britten et al., 1992). Hence, to better understand the evolution of the response profiles observed in hMT+, we selected the 200-500 ms time period post-coherence onset and fitted a Weibull function to the averaged source estimate amplitudes as a function of RDK coherence levels on a per individual basis, and separately for pre- and post-training data (see Materials and Methods). From each fit, the neurometric threshold of an individual could thus be defined as the stimulus coherence level corresponding to half the amplitude of the sigmoid curve (see Supp. Fig S2B for examples of individual fits and Fig. 4B for the group data). Using this procedure, a significant decrease in neurometric threshold was observed solely in the AV group (t11 = -2.34, p= 0.039; Fig. 4B).
Altogether, these results suggest a particular neural strategy in hMT+ that depends on the training history of participants, namely: in V and AVn, sensitivity affected the extreme levels of RDK coherence whereas in AV a better selectivity was seen for RDK coherence close to perceptual threshold. Although no direct correlation could be found between neurometric and psychometric thresholds when separately considering the pre- and post-training data,
significant correlations between perceptual and neurometric threshold changes were observed in each group and across all individuals irrespective of their training history (Fig. 5).
Figure 5. Changes in visual coherence discrimination thresholds as a function of changes in neurometric thresholds pre- and post-training. Differences in the perceptual thresholds of individuals before and after
training are reported as a function of the changes in neurometric thresholds on a per training group basis (V: top left; AV: top right; AVn: bottom left; all groups combined: bottom right). In all three training groups, the individual improvements in coherence discrimination thresholds were significantly correlated with the observed changes in neurometric thresholds derived from source estimate activity in bilateral hMT+. Specifically, correlations were the highest in the V and AV groups (V:r= 0.71, p= 0.014 and AV: r= 0.75, p= 8.3e-3) but also in the AVn group (r= 0.56, p= 0.05). When grouping all individuals, a significant correlation was preserved (bottom right, r= 0.61, p= 1.1e-4) . ‘x’ denotes statistical outliers.
Altogether, these results strongly suggest that the hMT+ response profile to a given RDK coherence level significantly changed as a function of the training history of the individual. Crucially, the sensitivity of hMT+ response to RDK selectively improved in the AV group but not in the V and control AVn groups.
3.3
Enhanced hMT+ selectivity for learned coherence levels only after AV
training
In order to narrow down the specific effects of training on the hMT+ response profile, we classified data according to the perceptual improvement of each individual. Specifically, participants underwent individualized training so that each individual was trained on a selected set of four RDK coherence levels based on the initial discrimination threshold measured in pre-training. Hence, participants were not trained on the same set of coherence levels although all were tested on the same 7 coherence levels in pre- and post-training
blocks. On this basis, we classified the 7 RDK coherence levels into three sets solely based on their learned discriminability – i.e. irrespective of the physical RDK coherence levels – in order to sort data in the pre- and post-training blocks. The three categories were ‘hard’, ‘easy’ and ‘learned’: the ‘hard’ category consisted of all stimuli that remained below an individual’s perceptual threshold after training - i.e. RDK coherence levels that never benefitted from training and did not become perceptually discriminable for a given participant. Conversely, the ‘easy’ category corresponded to those stimuli that were already above the discrimination threshold before training. Most importantly, the ‘learned’ category consisted of all RDK coherence levels that became discriminable – i.e. above the discrimination threshold of the individual after training. We then hypothesized that plasticity should be precisely reflected by a change of neural activity elicited by the ‘learned’ category and not others.
Examining the changes of hMT+ responses over 200 to 500 ms revealed significant
differences between the three groups in the 'learned' (F2,33 = 5.4, p= 0.0091) and in the 'hard'
(F2,33 = 4.8, p= 0.015) categories. Specifically, the V and AVn groups shared a similar pattern
of responses across all three categories: opposite variations in 'hard' and 'easy' categories were observed in the V and AVn groups consistent with the increased spread of hMT+ response as a function of RDK coherence levels (Fig. 4A). In contrast, and consistent with the reported shifts in neurometric thresholds (Fig. 4B), the AV group presented a significant change in response profile to the 'learned' category (t11 = 3.23, pcor = 2.4e-2, bilateral paired t-test with
Bonferroni correction). In addition, these results were confirmed by a finer analysis of the entire time course differences in hMT+ (Fig. 6, first column) when carrying out a pairwise cluster permutation algorithm (cf. Table 1): AV was indeed the only group to show a significant response increase for the 'learned' coherence levels from 160 to 390 ms post-coherence onset.
With this analysis, we thus consistently observe that only AV trained individuals showed a significant change in hMT+ activity that directly related to the observed perceptual
improvements and to those stimuli that underwent a significant change in perceptual discriminability.
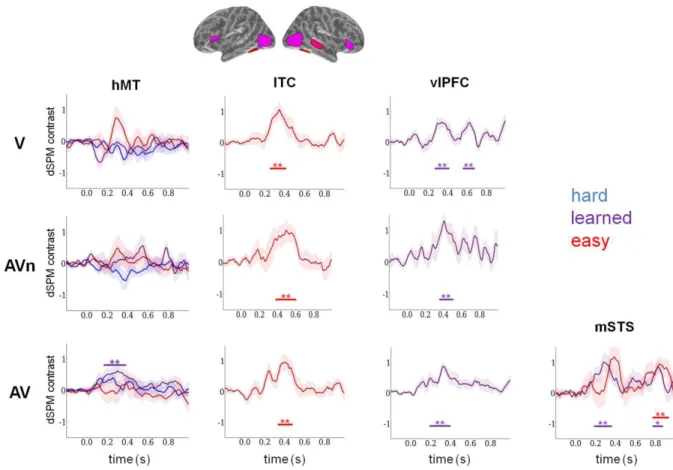
Figure 6. Functional selectivity in hMT+ and other regions of interest (ROIs) after V, AV and AVn training. Visual coherence levels were classified into three groups according to participants’ changes in
perceptual thresholds, namely: “hard” coherence were those coherence levels that remain below the individual’s post-training threshold (blue); “easy” coherence levels were those that remain above the pre-training threshold (red); “learned” coherence were those that went from below the perceptual threshold in pre-training to above the threshold of the participant after training (purple). Post- minus pre-training mean dSPM contrasts (± 1 s.e.m.) are
reported for all three groups (V: top; AVn: middle; AV: bottom). In hMT+, all categories are reported while in other ROIs only categories with significant differences are shown for clarity. Strikingly, only AV presented a significant difference in hMT+ observed as an increase of amplitude of the response to the 'learned' coherence levels. When considering all other ROIs defined in Fig. 2B, only AV presented significant time clusters for the 'learned' category in right mSTS while all groups presented significant increases in response to the 'easy' category in ITC. The analysis was extended to bilateral ventro-lateral PreFrontal Cortex (vlPFC) which strikingly revealed significant time clusters for all three groups but solely for the learned coherence levels. Significant clusters were determined using a pairwise cluster permutation algorithm and are indicated below the curves with bars (cf. Table 1). ‘*’: corrected p values inferior to 0.05, ‘**’: corrected p values inferior to 0.01.
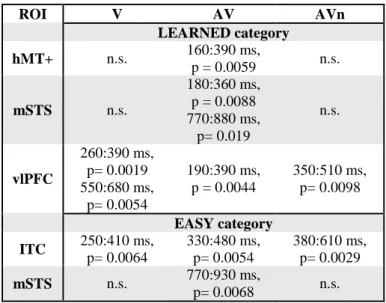
ROI V AV AVn LEARNED category hMT+ n.s. 160:390 ms, p = 0.0059 n.s. mSTS n.s. 180:360 ms, p = 0.0088 770:880 ms, p= 0.019 n.s. vlPFC 260:390 ms, p= 0.0019 550:680 ms, p= 0.0054 190:390 ms, p = 0.0044 350:510 ms, p= 0.0098 EASY category ITC 250:410 ms, p= 0.0064 330:480 ms, p= 0.0054 380:610 ms, p= 0.0029 mSTS n.s. 770:930 ms, p= 0.0068 n.s.
Table 1. Summary of significant clusters observed in Figure 6. Latencies and corrected p values are provided
for each ROIs (rows) and for each training group (columns).
Considering that hMT+ did not present selective changes to the ‘learned’ coherence levels notably in the V and AVn groups, we asked whether other cortical regions could significantly contribute to the obtained perceptual improvements. To this aim, neural responses in the observed regions of interest (ROIs, Figure 2B) were quantified and contrasted in pre- and post-training as a function of the defined perceptual categories (Fig. 6).
As previously done for hMT+, contrasts of post- minus pre-training were separately tested for each training group and for each perceptual category by using a pairwise cluster permutation algorithm. For clarity, only those ROIs and time courses presenting significant differences are reported in Fig. 6 and a summary of significant cluster values and latencies is also provided in Table 1.
First, and common to all three groups, a significant response increase in post-training was observed in ITC but solely for the ‘easy’ category. Interestingly, different latencies were noticeable in each group (Fig.6, second column): ~250 to 410 ms in the V group, ~330 to 480 ms in the AV group and ~380 to 610 ms in the AVn group. This pattern suggests that in this task, color-motion binding may have equally improved in all participants irrespective of their training but solely when coherence discrimination was easiest. No significant differences were otherwise seen for any other perceptual categories in these ROIs.
As no other significant changes for the ‘learned’ category were seen in all ROIs to account for V and AVn perceptual improvements, we added a selection criterion for our analysis.
Specifically, several lines of research have shown that the lateral prefrontal cortex is a major site of convergence for the dorsal and ventral visual (Ungerleider and Mishkin, 1982) and auditory (Rauschecker and Tian, 2000) streams but also an important site of multisensory convergence (Romanski, 2004, 2007; Romanski and Hwang, 2012). We thus extended our analysis to bilateral vlPFC using Freesurfer neuroanatomical parcellations to define the ROI. Strikingly, significant time clusters were found in this region specifically for the ‘learned’ category and for all three groups (Fig. 6, third column). Two significant clusters were seen in V spanning ~260 to 390 ms and 550 to 680 ms; one surprisingly early significant cluster was seen in AV spanning ~190 to 390 ms and one significant cluster in AVn spanning ~350 to 510 ms. In addition, the AV group (Figure 6, fourth column) was the only group which presented
a significant response increase in both the learned and the easy category in right mSTS at late latencies (770 to 930 ms) but also, and crucially, significant changes for the ‘learned’
category at the same latencies as in hMT+ (i.e. ~200 to ~400 ms).
Altogether, these results strongly suggest that the boost in sensitivity observed in hMT+ may not result from local plasticity but from the engagement of a larger network in the
computations of color-motion binding and coherence discrimination including prefrontal regions.
Figure 7. Main effects of training in all three groups across all coherence levels. Post- minus pre-training
contrasts of mean current source estimates (dSPM, ± 1 s.e.m.) across all RDK coherence levels and for each region of interests (see Fig. 2). Differential time series are reported in light grey for V, in black for AV and in dark grey for AVn. The effect of training in a given group was tested with a two-tailed paired t-test combined with a cluster permutation algorithm: significant differences are indicated with light grey bars (V), black bars (AV) and dark grey bars (AVn). In V, main effects of training irrespective of coherence levels can be seen in ITC from ~200 to 400 ms post-coherence onset. In AV, main effects are seen in several regions including hMT+, ITC, mSTS, V4, pSTS and AC. In AVn, main effects are seen in ITC, pSTS, and AC. In order to test the main effects of training type (V, AV or AVn) irrespective of coherence levels, a F-test was performed in combination with a cluster permutation algorithm for all ROIs. The shaded areas highlight the latencies of significant
differences between the training groups; red stars indicate the corresponding degree of significance. As can be seen, four main regions capture the main differences across the three training groups, namely: middle and posterior STS, V4 and AC. * corrected p values inferior to 0.05; ** corrected p values inferior to 0.01 ; *** corrected p value inferior to 0.001.
pre- vs. post-training – all coherence levels
t-tests F-tests
ROI V AV AVn V, AV, AVn
hMT+ n.s. 130:290 ms, p= 0.0044 n.s. n.s. mSTS n.s. 250:440 ms, p = 0.0083 600:900 ms, p= 0.0015 n.s. 680:880 ms, p= 0.0055 pSTS n.s. 320:560 ms, p = 0.016 120:320 ms, p= 0.0078 120:520 ms, p= 0.0007 V4 n.s. 160:400 ms, p= 0.0068 n.s. 150:420 ms, p= 0.00095 ITC 260:500 ms, p= 0.007 300:540 ms, p= 0.0049 500:630 ms, p= 0.029 n.s. AC n.s. 210:340 ms, p= 0.0088 60:280 ms, p= 0.0049 80:340 ms, p= 0.00075
Table 2. Summary of significant clusters observed in Figure 7. Latencies and corrected p values are provided
for each ROIs (rows) and for each training group (columns).
3.5
A larger network distinctively dissociate the three training groups
We now ask whether a non-selective training effect can be observed irrespective of the RDK coherence levels across all three groups, thereby reflecting an overall effect of taskimprovement. Similar to previous analyses, the evoked responses elicited by the presentation of all RDK coherence levels were grand-averaged, source reconstructed and averaged within each ROI as defined in Fig. 2.
The time courses in pre- and post-training are illustrated in Supplementary Figures S3 and S4, respectively. With the exception of visual area V4, no significant differences were observed between the three groups before training (Supp. Fig. S3); in post-training, the time courses across the three groups significantly differed only in right mSTS (Supp. Fig. S4). The source amplitudes in the different ROIs were then contrasted between the pre- and post-training blocks and tested with a cluster permutation algorithm in each group (Fig. 7 and Table 2).
First, all three groups presented a main effect of training in ITC corresponding to positive clusters at increasing latencies, namely in V: 260 to 500 ms; in AV: 300 to 540 ms and in AVn: 500 to 630 ms. Second, no additional effects were found for the V group. Third in the AV group, a large network was observed revealing significant post-training responses increase in hMT+ (130 to 290 ms post-coherence onset), in right mSTS with two temporal clusters (250 to 440 ms and 600 to 900 ms) post-coherence onset, in V4 (160 to 400 ms), in pSTS (320 to 560 ms) and in AC (210 to 340 ms). Fourth and interestingly, pSTS and AC presented opposite effects for AVn, with a significant decrease of activity in post-training for latencies of 120 to 320 ms in pSTS and of 60 to 280 ms in AC.
In order to directly contrast the three training groups, an F-test was combined with a cluster permutation algorithm: the earliest effect was observed in AC starting at 80 ms
post-coherence onset (and lasting 260 ms), rapidly followed by a long sustained differentiation in pSTS from 120 to 520 ms and in V4 from 160 and 400 ms; a late main effect was observed in the right mSTS from 680 to 880 ms.
Figure 8. Main effects of training in bilateral pSTS and right mSTS are uniquely observed in the AV group. Mean dSPM contrasts in bilateral pSTS (left column) and right mSTS (right column) as a function of
individuals’ mean performance increases over all coherence levels in V (top), AV (middle) and AVn (bottom). dSPM contrasts were computed by collapsing all RDK coherence levels and averaged over the time windows corresponding to significant differences in AV (i.e. over 320-560 ms in pSTS and 250-440 ms in mSTS) as reported in Figure 7. Significant positive correlations between overall performance and source estimate amplitude were observed solely in the AV group specifically in pSTS (r = 0.63, p= 0.036) and in mSTS (r = 0.75, p= 0.0077). ‘x’: automatically detected outliers.
To better comprehend the role of mSTS and pSTS, the post- minus pre- contrasts of source estimate amplitudes were plotted as a function of post- minus pre- performance separately for each group (Figure 8). A significant correlation was observed in both ROIs but again, solely for the AV group. This result suggests that while mSTS and pSTS are not selective to the RDK coherence levels, these regions play a significant role in the task improvements observed in the AV group but not in the other groups. Altogether, our results highlight the distinct contribution of different cortical areas either selective to the RDK coherence levels or to the training history of the participant. A summary and working hypothesis is provided in
Figure 9 on the functional role of the ROIs contribution to perceptual improvements observed in the three groups of participants.
Figure 9. A working hypothesis for supramodal processing and reverse hierarchy plasticity. Panel A:
Synthetic illustration of ROIs showing significant post-training changes in neural responses after training in the V, AVn and AV groups. Significant changes in hMT+, V4, ITC and vlPFC were common to all three groups whereas pSTS, mSTS, and AC were specific to the multisensory AV and AVn groups. The network observed in post-multisensory training was thus more extensive than in visual training. Strikingly, the pattern of activation in the control AVn group and in the AV group was notably reversed in several regions including pSTS, AC, mSTS and V4: this suggests selective modulations of these cortical regions based on the stimuli presented during training. Panel B: Synthetic summary of latency of main significant effects obtained when contrasting post- vs. pre-training data irrespective of coherence levels. The temporal overlaps of significant effects over the extensive network observed in the AV trained groups suggest a complex pattern of communication between these brain regions. Importantly, a major latency difference can be observed between the AV and AVn groups in AC and pSTS with an early decreased activity in these regions in the AVn group and a later increase activity in the AV group. We contend that this difference is consistent with pSTS acting as a « switch » allowing the implication of mSTS in the computation of coherence motion. Panel C: A basic hypothesis for the functional network
implicated in visual learning in the V, AV and AVn groups. The distinctive pattern of cortical activity that significantly dissociated the three training groups was a significant increase and decrease of activity in AV and AVn, respectively for the pSTS, mSTS, AC and V4, suggesting direct functional connectivity between these regions (blue/red boxes). No significant changes of activity were observed in these regions for the V group.
Common to all three training groups, hMT+ and vlPFC showed discriminable cortical responses as a function of the learned coherence levels. Additionally, all three groups showed an increased activity in ITC only for the easy coherence levels suggesting an improvement in color-motion binding. In hMT+, the increase spread of neural response was shared by V and the control AVn, whereas selective activity was seen solely for the AV group. Altogether, our results suggest a regulation of hMT+ activity by upstream computations notably in the AV and AVn groups. The specific implications of V1/V2, IPS and FEF (ROIs obtained in Fig. 2) remain to be
determined.
4
DISCUSSION
In this study, we asked whether learning to discriminate visual coherent motion would rapidly benefit from hearing matched acoustic features. To this end, three groups of participants underwent training with visual (V), correlated (AV) or arbitrary (AVn) audiovisual pairings while being recorded with MEG. First, all three groups showed a significant decrease of their visual coherence discrimination thresholds after a very short training. However, AV
participants significantly outperformed participants in the V and AVn groups although V participants were the only ones showing a significant increase in confidence rating. Second, all three groups showed a common activation pattern in two distinct cortical regions (ITC and vlPFC): a comparable post-training increase of neural activity in the ventral visual stream (ITC) suggests that color-motion binding consistently improved when coherence
discrimination was easily achieved. One interpretation is that easy detection of coherent motion allowed for more efficient motion-color binding. All three groups showed increased post-training activity in vlPFC specifically for the learned coherence levels, suggesting a strong and selective implication of prefrontal cortex in learning. Conversely, distinct patterns of activity distinguished the three groups of participants with the multisensory trained groups (AV and AVn) showing an opposite pattern of post-training activity in a network comprising pSTS, mSTS, and AC (cf. Figure 9). This suggests that multisensory training fundamentally altered the network implicated in the analysis of visual coherent motion stimuli and that a uni-
vs. a multi-sensory training can selectively shape the activity of the implicated network.
Third, and crucially, AV participants were the only group showing a post-training gain of selectivity in hMT+ as captured by a significant shift in their neurometric thresholds.
Altogether, we thus interpret our results as evidence for supramodal processing elicited by the presentation of coherent audiovisual features during training. Our results suggest that
supramodal processing allowed the fine-tuning of downstream selectivity in visual cortices in agreement with the reverse hierarchy hypothesis (Ahissar and Hochstein, 2004; Proulx et al., 2012); if this hypothesis is correct, multisensory training can open new empirical venues for the understanding of top-down plasticity in implicit perceptual learning and greatly speed up the use of sensory-substitution devices in sensory-impaired population.
4.1
Supramodal objects and cross-sensory feature matching
Statistical contingencies across sensory modalities can be learned (Seitz et al., 2007; Mitchel and Weiss, 2011) and multisensory information has been shown to benefit perceptual learning (e.g. Shams and Seitz, 2008; for an extensive review, see Proulx et al., 2012). However, the observed perceptual improvements are generally small and can require a long training time: with ten days of training, presenting auditory motion cues has been shown to improve visual direction discrimination (Seitz et al., 2006) and acoustic cues can alter the direction of visual motion (Freeman and Driver, 2008; Hidaka et al., 2011). Here, consistent with the hypothesis that using redundant multisensory information should yield greater benefits (Alais and Burr, 2004), we capitalized on cross-sensory feature matching, namely the temporal coherence between auditory spectral changes and visual spatial patterning over time. The temporal coherence of audiovisual information is inherent to natural stimuli: in particular, the envelope of auditory speech is known to correlate with the speaker’s facial gestures (Grant and Seitz,
2000; Grant and Greenberg, 2001; Schwartz et al., 2004; Chandrasekaran et al., 2009) and more generally, auditory pitch and visual spatial frequency undergo automatic cross-sensory matching (Maeda et al., 2004; Evans and Treisman, 2010). The comodulation of audiovisual signals is thus a fundamental attribute of natural scenes that enables the brain to appropriately bind sensory features belonging to the same physical object, albeit processed through different sensory processing streams. Hence, by using matched audiovisual correspondences, we
expected rapid cross-sensory mapping allowing for efficient learning in the AV group as compared to the control AVn and the V groups. In agreement with this hypothesis, the AV group significantly outperformed the V and the control AVn groups, suggesting that the mere presence of sound is not sufficient to improve visual coherence discrimination and rather, that the correlated temporal structure imposed on the audiovisual stimuli during training largely benefitted visual discrimination and did so in a very short exposure time.
4.2
Implicit learning
An additional intriguing feature was that unlike V learners, the confidence rating of the AV and AVn groups did not change after learning. Confidence ratings are a well-established means to assess conscious knowledge in decision making (e.g. Dienes, 2008) and have recently been argued to be most reliable in assessing the lowest level of subjective awareness (Wierzchoń et al., 2012). The lack of increased confidence rating in participants undergoing multisensory training strongly suggests that cross-sensory mapping occurred at an implicit level during training, which is consistent with the notion of automatic binding in multisensory integration (Talsma et al., 2010; Kösem and van Wassenhove, 2012) and with prior report of unconscious transfer between auditory and visual sensory modalities (Levy-Tzedek et al.,
2012b). These results indicate that no cognitive strategy was used by participants trained in multisensory conditions to accomplish the task. One possibility is that differences in confidence ratings may be accounted for by inter-individual differences irrespective of learning (Song et al., 2011). The dissociation of subjective awareness observed here – i.e. improved performance without improved confidence rating - could be tentatively explained by the nature of what has been learned: the response pattern observed in ITC suggests that color-motion binding has improved in all participants irrespective of their training whereas visual coherence discrimination was solely observed in the AV group. Additionally, the pre- and post-training perceptual thresholds specifically focused on data collected in visual alone conditions in all three groups, thereby alleviating the possibility of divided attentional effects in task performance.
4.3
Supramodal object representation in vlPFC?
As previously mentioned, the audiovisual stimuli used during training were specifically designed to mimic the correspondences of auditory and visual attributes predicted from natural communication stimuli such as speech and monkey vocalizations although we arguably avoided possible overt semantic categorizations (face, speech). These audiovisual features rely on the correlated temporal structuring of acoustic and visual information and focused on the spectrotemporal attributes of the signals requiring color-motion binding for overt response (“red (green) RDK is most coherent”). Hence, during training (data not reported), the matching between visual and acoustic features would likely be comparable to the one taking place in the context of natural stimuli.