O R I G I N A L PA P E R
The Training Evaluation Inventory (TEI) - Evaluation
of Training Design and Measurement of Training
Outcomes for Predicting Training Success
Sandrina Ritzmann&Vera Hagemann&
Annette Kluge
Received: 8 November 2012 / Accepted: 22 August 2013 / Published online: 3 September 2013 # Springer Science+Business Media Dordrecht 2013
Abstract Training evaluation in research and organisational contexts is vital to ensure informed decisions regarding the value of training. The present study de-scribes the development of a valid and reliable training evaluation inventory (TEI), as it does not exist so far. The objectives were a) to construct an instrument that is theoretically and empirically founded, but at the same time applicable within typical organisational constraints, and b) to include the assessment and perception of training design as a formative evaluation aspect. Based on previous research, ten scales were constructed, covering the training outcome dimensions subjective enjoyment, per-ceived usefulness, perper-ceived difficulty, subjective knowledge gain, and attitude towards training, as well as the training design dimensions problem-based learning, activation, demonstration, application, and integration. Reliabilities of the scales were satisfactory. Data from two training studies show that the training outcome dimen-sions were related to external training outcome measures, underlining the validity of the TEI. Two survey samples were used to predict training outcomes based on training design. Demonstration, application, and integration emerged as the most important design dimensions. The TEI is applicable in both training research projects and in organisational contexts. It can be used for formative and summative training evaluation purposes.
Keywords Organisational training . Training evaluation . Training outcomes . Training design . Questionnaire development . Evaluation instrument
DOI 10.1007/s12186-013-9106-4
S. Ritzmann (*)
Institute Humans in Complex Systems, University of Applied Sciences and Arts Northwestern Switzerland, Riggenbachstrasse 16, CH-4600 Olten, Switzerland
e-mail: [email protected] V. Hagemann
:
A. KlugeBusiness and Organizational Psychology, University of Duisburg-Essen, Lotharstr. 65, D-47057 Duisburg, Germany
Training in Organisations
In the last few decades, training in organisations has been an important topic for scholars and practitioners alike. Technological progress, structural labour-market changes and an ageing workforce necessitate continuous professional education to
warrant innovation and productivity (Billett2008; European Centre for the
Develop-ment of Vocational Training2010).
Evaluation of Training and Levels of Training Outcomes
Given the importance of vocational education and professional training, there is an ongoing need to evaluate training to ensure that investments have the highest possible degree of efficiency. Evaluation, as the systematic collection of descriptive and judg-mental information on training, is necessary for making informed decisions regarding the implementation, modification or value of organisational training (Goldstein and Ford
2002, p. 138). Important decisions that need to be made concern for example the choice
of an external training provider or the course the revisions of an existing training programme should take. The starting point for most evaluation efforts is Kirkpatrick’s
hierarchical model of training outcomes (Kirkpatrick1998), which provides a rough
taxonomy for training criteria (Alliger and Janak1989; Shelton and Alliger 1993).
According to Kirkpatrick (1998), training can be evaluated at four outcome levels: 1)
reactions, 2) learning and attitudes, 3) behaviour, and 4) organisational results. Ideally, comprehensive evaluation considers data on multiple levels (Tannenbaum and Woods
1992), but to save time and costs, organisations often restrict evaluation to the
distribu-tion of reacdistribu-tionnaires, primarily measuring whether or not participants enjoyed a
partic-ular programme (Blanchard et al.2002; Twitchell et al.2000). This fact has been widely
criticised in the training literature (Blanchard et al.2002; Shelton and Alliger1993;
Tannenbaum and Woods1992), based on results showing that enjoyment of a training
course does not necessarily lead to learning or transfer of behaviour (Alliger and Janak
1989; Alliger et al.1997). However, it has also been emphasised that evaluation efforts
should not be guided by an obligation to cover all evaluation levels, but rather by
predefined objectives in the respective organisational context (Alliger and Janak1989;
Kraiger2002), and that researchers should offer methods that are“practical, systematic,
and perceived as feasible by trainers” (Twitchell et al.2000, p. 104). We can thus identify
a gap between cost-effective organisational evaluation practices and postulations of training scholars regarding the measurement of training effectiveness on multiple levels and related to training objectives. Against this background, the first objective of the present article is to introduce an approach to training evaluation that is theoretically and empirically founded on the one hand, but meaningful to training decision makers and applicable within typical organisational constraints on the other hand.
Impact of Training Design on Training Outcomes
The function of training is to facilitate learning through the design of adequate
instructional events (Gagné et al.2005). Correspondingly, a number of studies have
investigated the impact of training design on training outcomes and have shown that the choice of training design has a relevant influence on training effectiveness (Blume
et al.2010; Salas and Cannon-Bowers2001). For example, the medium effect size of
training found in a meta-analysis by Arthur and colleagues (Arthur et al.2003) varied
considerably not only depending on the criterion measured (reactions, learning, behaviour, results), but also on the training method used (lecture, simulation etc.).
In a meta-analysis on the effectiveness of managerial training (Burke and Day1986),
different training methods were found to yield different effect sizes, and the magni-tude of the effects also depended on the criteria used to operationalize training outcomes. Further meta-analyses focussed on particular training methods and showed
that error training (Keith and Frese2008), behavioural modelling (Taylor et al.2005),
or practice in training (Arthur et al.1998) lead to effective training outcomes.
Despite the impact of training design on training outcomes, in the past, barely any training evaluation studies have included training design. The reason for this might lie in the fact that an outcome view of training validity has dominated evaluation designs
(Goldstein and Ford2002). This view is the result of a summative approach to evaluation
with a focus on the effectiveness of completed interventions. Conversely, evaluating training design is a reflection of a formative approach to evaluation that aims at
under-standing why certain kinds of results were achieved (Goldstein and Ford2002). The
second objective of this article is thus to include the assessment and perception of training design features as a formative evaluation aspect in our approach to training evaluation. The Training Evaluation Inventory: Defining Requirements
The initial motivation for our research was a joint project with an organisation with
around 5’000 employees. The mandate was to advance a training programme targeting
non-technical teamwork knowledge, skills, and attitudes (e.g. decision making, com-munication, or coordination) of employees. As the project demanded large-scale eval-uations of training modules with several hundred participants, which could only be accomplished by applying a questionnaire directly after training, we decided to design a paper-and-pencil training evaluation inventory (TEI) that should fulfil a range of predefined requirements: 1) It should be based on past empirical results and theoretical considerations regarding training evaluation and design in order to be maximally informative with respect to the quality and effects of the evaluated training modules. 2) It should allow a comparison of different training modules with different content and objectives, designed for different target groups, in different organisations or organisational units. It should thus be generic and independent of training content. 3) We aimed to compare not only the outcomes of the training modules in question, but also their design and the impact of training design on training outcomes. The question-naire should thus measure training outcome and training design variables alike. 4) It should also be accepted as meaningful and feasible by members of organisations (training decision makers, trainers, and trainees).
Given these requirements, the literature on training evaluation was reviewed in order to find suitable constructs that could be operationalized in a paper-and-pencil inventory to be filled out by participants immediately after training and tested by confirmatory factor analyses. Based on the literature review, we then formulated hypotheses regarding the constructs included in the questionnaire and their interrelations. This hypothesis-testing approach was adopted to assess the construct validity of the instrument (Nunnally
Training Outcomes: Theoretical and Empirical Background
An important and influential framework for categorising training outcomes is
Kirkpatrick’s hierarchical model (Kirkpatrick1998; Tannenbaum and Yukl1992). The
basic reactions level measure is enjoyment of training, but several studies have further differentiated reactions into enjoyment of training (affective reaction), usefulness of
training (utility reaction), and perceived difficulty (Alliger et al.1997; Warr and Bunce
1995). On the level of learning and attitudes, evaluations focus on the acquisition of
declarative or procedural knowledge, but also on attitude changes. A more fine-grained classification for the learning and attitude level distinguishes cognitive (knowledge or cognitive strategies), skill-based (proceduralisation, automaticity etc.), and affective
outcomes (attitudes, motivation, self-efficacy etc.; Kraiger et al.1993). The behavioural
level covers job-related behaviour and performance after training and indicates transfer
of training to the job (Warr et al.1999). Finally, organisational results such as reduced
costs, an increase in production or sales, or a decrease in accident rates relate the training programme to organisational objectives.
Kirkpatrick’s framework has inspired a great deal of research, but it has also
under-gone substantial criticism in the past two decades. The model’s simplicity is appealing,
but can also turn into a liability when its coarseness leads to overgeneralisations and
misunderstandings (Alliger et al.1997; Alliger and Janak1989; Kraiger2002). Holton
(1996) furthermore stated that the four levels should rather be considered a heuristic
taxonomy than a theoretically informed and experimentally confirmed model. Despite the critical appraisal of the framework, it remains the prevalent classification scheme in academic research and the most influential evaluation approach among practitioners
(Aguinis and Kraiger2009; Hochholdinger et al.2008). It was thus established as point
Prob Act Dem App Integ
Enjoy Useful Diff Knowl Att
Learning Attitudes Behaviour
TEI: Training design dimensions TEI: Training outcome dimensions External training outcome measures H1 H2 H3 H4
Notes. Prob = problem-based learning; Act = activation; Dem = demonstration; App = application; Integ = integration; Enjoy = subjective enjoyment; Useful = perceived usefulness; Diff = perceived difficulty; Knowl = subjective knowledge gain; Att = attitude towards training
of departure in the present study because of the large body of literature and research to it. This corresponds to the requirement defined for the inventory that it should be based on past empirical results and theoretical considerations. Moreover, its simplicity, making it readily understandable also by practitioners, made it feasible with regard to the require-ment that the resulting inventory should be accepted by members of organisations. Based on a review of the literature, reactions as well as learning and attitudes were chosen for inclusion in the TEI. These two outcome levels are traditionally measured in a paper-and-pencil format, which again was a pre-defined requirement for the evaluation questionnaire.
Level 1: Reactions
Reactions are the most commonly collected training criteria in organisations (Bassi
et al.1996; Blanchard et al.2002; Twitchell et al.2000), but at the same time, they
have been criticised by training scholars as insufficient to suggest learning or
behavioural change (Tannenbaum and Yukl 1992). From a practitioner’s point of
view, evaluating reactions is appealing for several reasons. First, using standard
reaction questionnaires is time- and cost-efficient (Hochholdinger et al.2008).
Sec-ond, training practitioners seem to lack expertise in how to conduct evaluations of
other levels (Tannenbaum and Woods1992; Twitchell et al.2000). Third, collecting
information on trainee reactions is important to win participants over to a training
programme and influence more distant variables such as“word-of-mouth”
advertis-ing (Alliger et al.1997).
From a scholarly point of view, the important question regarding reactions is to what extent they can be used as surrogate indicators of learning or behaviour change
(Alliger et al. 1997, p. 343). When reactions are treated as a single, not further
differentiated construct, meta-analytic studies have shown mixed results. Alliger
and Janak (1989) found only very small correlations between reactions and learning
or behaviour in their early meta-analysis, while a recent meta-analysis showed that reactions predicted post-training declarative and procedural knowledge (Sitzmann
et al.2008). Other studies looked at different facets of reactions. They found that
affective reaction measures (“enjoyment”) correlate only weakly with learning or behaviour transfer measures, while utility reactions (“usefulness”) are more strongly related to immediate learning and transfer and seem to be as good a predictor of
transfer as behaviour/skill demonstrations (Alliger and Janak 1989; Alliger et al.
1997; Warr and Bunce1995; Warr et al.1999). A very recent meta-analysis came to
similar conclusions by showing that expectancy and instrumentality (Vroom1964),
which are motivational constructs that are closely related to utility judgments, were
strong predictors of transfer of training in professional contexts (Gegenfurtner2011).
Another aspect of reactions that has been distinguished in the literature is perceived difficulty. It was shown to correlate significantly with self-reported competence, knowledge, self-reported use of training content on the job and perceived value of
training (Warr et al.1999).
Based on these results, we conclude that reaction data can provide valuable infor-mation in training evaluation, especially when not only affective reactions, but also utility reactions and perceived difficulty are measured. Taking also their high acceptance in organisations into account, enjoyment, perceived usefulness, and perceived difficulty
were thus included in the training evaluation inventory. Moreover, within the framework
of our hypothesis-testing approach to construct validation (Nunnally1978), the
follow-ing hypothesis was formulated:
1. H1: The three reaction components enjoyment, perceived usefulness, and
per-ceived difficulty as measured by the TEI are significantly and positively related to learning, attitudes, and behavioural transfer.
If indeed reactions can serve as a surrogate indicator for learning or attitude and behavioural change, then we should be able to confirm this hypothesis in a training study by applying the TEI and measures of learning, attitudes, and behavioural transfer. Level 2: Learning and Attitudes
Learning as the acquisition of declarative or procedural knowledge, or a change in
attitudes or values are common objectives of training (Warr et al.1999), and effects on
behaviour on the job or organisational results cannot be achieved without some form of
cognitive, affective or skill-related change (Kraiger2002). On level 2 of Kirkpatrick’s
model, learning has been measured considerably more often as an outcome of training than changes in attitudes, and the sample-weighted mean effect size d for studies measuring learning as a criterion of training effectiveness was shown to be medium to
large (Arthur et al.2003; Cohen1992, describes d of 0.20, 0.50, and 0.80 as small,
medium, and large effect sizes, respectively). Meta-analytic studies on the relationship between learning and behaviour or transfer found relationships ranging from small
(Alliger et al.1997) to moderate to high (Colquitt et al.2000).
Learning and attitudes can be assessed through a variety of methods, e.g.
question-naires, exercises, or work samples (Kraiger2002; Salas et al.2006b). Usually, tests of
learning and knowledge target the content discussed in training (e.g. declarative
knowl-edge of health and safety regulations; Gegenfurtner2012), and attitude questionnaires
typically assess attitudes towards the attitude object discussed in training (e.g. attitudes
toward disability and accessibility; Lewis2009). As outlined above, it was established
that the instrument we designed should be generic and content-independent. It was thus not feasible to include items measuring learning of and attitudes towards specific training content. Instead, we chose to measure self-reported, subjective knowledge gain and attitude towards the training module as a whole.
Self-assessments of knowledge have been defined as learners’ estimates of how much they know (current knowledge level) or have learned (increase in knowledge
level) about a domain (Sitzmann et al.2010). In research on instructional
communi-cation, the use of students’ self-assessments of knowledge has had a long tradition in terms of enabling the study of cognitive learning in teaching settings while
generalising across subject areas (Chesebro and McCroskey 2000). Measures of
students’ perception of learning as used in this strand of research showed a moderate to strong correlation with students’ test scores in an experimental teaching setting
(Chesebro and McCroskey2000). A recent meta-analysis by Sitzmann et al. (2010)
also showed that self-assessments of knowledge correlated moderately with cognitive learning. Self-reported knowledge gain can thus serve as a proxy for learning, although the relationship is less than optimal and results have to be interpreted with caution. We included subjective knowledge gain as an outcome in the TEI in order to
gather information which is impossible to obtain through other channels in a generic training evaluation setting. We therefore aimed at reducing the criterion deficiency of
the entire evaluation effort (Campbell and Lee1988). The following hypothesis was
formulated to enable us to assess the relationship of self-assessments of knowledge and objective learning measures within the hypothesis-testing approach to construct
validity (Nunnally1978):
2. H2: Subjective knowledge gain as measured by the TEI is significantly and
positively related to objective learning measures as criteria of training outcome. With regard to attitudes, we again chose a generic approach and measured attitudes
towards the training modules as a whole, i.e. participants’ opinion of the fact that
training is offered. To the best of our knowledge, there are no previous studies which have investigated the relationship between general attitudes towards training on the one hand and attitudes towards specific training topics on the other hand. We argue that these two forms of attitudes are related. A central component of attitudes is evaluation, defined as the degree of favour or disfavour expressed towards the
attitude object (Olson and Zanna1993). As the degree of favour towards a training
module is at least partly determined by the degree of favour towards its different topics, we assume that the general attitude towards a training module is related to the attitudes towards specific training topics, leading to the following hypothesis:
3. H3: Attitudes towards training as measured by the TEI are significantly and
positively related to attitudes towards specific training topics.
In summary, we included subjective enjoyment, perceived usefulness, and per-ceived difficulty as components of reactions in the TEI. Additionally, subjective knowledge gain and attitude towards training as components of learning are mea-sured. These five constructs are henceforth referred to as training outcome dimen-sions. In line with the hypothesis-testing approach to construct validity (Nunnally
1978), three hypotheses were formulated to test the relationship of the dimensions
with other constructs.
Training Design: Theoretical and Empirical Background
Instructional and training design deals with the question of what it takes to help
participants learn effectively in terms of instructional activities (Gagné et al.2005).
Such considerations are important because instructional factors such as
learner-centred environments are positively related to transfer (Gegenfurtner2011).
Conse-quently, evaluating the design features of training is important to shed light on the reasons why certain training outcome effects were produced. This approach is in line with a formative conceptualisation of evaluation and provides the organisation with important feedback about how a training programme could be improved (Goldstein
and Ford2002). To enable the measurement of training design in the TEI, we had to
take a normative approach by specifying generally valid and accepted instructional principles that could then be operationalized in a questionnaire. In an effort to find the
essence of a wide range of recent instructional design theories, Merrill (2002)
principles of instruction”: problem-based learning, activation, demonstration,
appli-cation, and integration. Descriptions of these principles are given in Table 1. Past
research adapted the first principles in a questionnaire and showed significant rela-tionships between learner ratings of the first principles of instruction and learning time, self-reported learning progress, satisfaction with the course, mastery of course
objectives, and overall course quality (Frick et al.2009). Based on these results, we
chose to focus on the five first principles as evaluation dimensions of training design, asking for participants’ subjective perception of their application. According to
Merrill (2002, pp. 43–44), the first principles always hold under appropriate
condi-tions, regardless of instructional practices or programmes. Learning by a given programme will be fostered in direct proportion to the implementation of the first principles. We adopted these propositions for the scales covering the five first principles of instruction, henceforth referred to as training design dimensions, which led us to the following hypothesis regarding the TEI within the hypothesis-testing
approach to construct validation (Nunnally1978):
4. H4: The training design dimensions serve as antecedents of training outcomes.
Training design thus predicts training outcomes. The higher the ratings for training design, the better the training outcomes of participants as measured by the TEI.
Method
Questionnaire Development
Questionnaire development was conducted within a larger study in collaboration with a European Airline with roughly 5’000 employees and a German fire service with 700 employees. The training programmes which served as the data source were all variations
Table 1 Description of the“five first principles of instruction” (Merrill2002) Principle Description
Problem-based learning
- Learning is facilitated when learners work on real-world cases or problems - Learners should be shown what they will be able to do after completion of training Activation - Learning is promoted when previous experience of the learners is activated or when the learners are provided with relevant experience that can serve as a foundation for new knowledge (or skills or attitudes)
Demonstration - Learners should be demonstrated with what has to be learned, and not merely told, using multiple representations and suitable media
- Demonstration should be consistent with learning goals and direct attention to the relevant information
Application - Learning is facilitated when learners can practise their new knowledge consistently with the learning goals and receive (gradually diminishing) feedback
Integration - Learning is promoted when learners can integrate their new knowledge into their existing knowledge and transfer it to everyday life
- Integration is facilitated by discussions, creations of new and own ways to use the knowledge, or the possibility to demonstrate new knowledge and skills
of team training programmes, which seek to improve team coordination, teamwork skills, and team performance in order to reduce human error and increase safety
(Helmreich et al.1999; Salas et al.2006a) in high reliability organisations (Weick and
Sutcliffe2007). Training content consisted of teamwork competencies such as
commu-nication skills, situation awareness or decision making (Salas et al.1999).
The questionnaire development began in 2008 and was guided by the predefined requirements which the instrument should fulfil: It should be a) based on empirical results and theoretical considerations, b) generic and independent of training content, c) able to measure training outcome and training design variables alike, and d) accepted as meaningful and feasible by members of the organisation.
Development included three main phases. In the first phase, items for the five training outcome and the five training design dimensions were formulated in the form of
state-ments (e.g.“Contents were illustrated with concrete examples”). As for the answer format,
a five-point Likert scale ranging from 1 (“strongly disagree”) to 5 (“strongly agree”) was chosen. The aim of this phase was to develop a short and concise instrument with as small a number of items as possible. This resulted in a first version of the questionnaire with 26 items. The number of items per scale was (number in brackets): subjective enjoyment (3), perceived usefulness (3), perceived difficulty (5), subjective knowledge gain (2), attitude towards training (3), problem-based learning (2), activation (2), demonstration (3), appli-cation (1), and integration (2). The first version was tested in a pre-study in four different team training modules with differing contents (55 participants in total; 68.5 % male). The mean age was 33.1 years (SD=9.3). Analysis of the reliability of the scales covering the dimensions (internal consistency: Cronbach’s α) showed that three scales had a
consis-tency below .6 (see Table2), which is the lowest value considered as acceptable in the
literature for low-stakes instruments designed for programmatic decision-making that do not have direct consequences for individuals, such as in this case (Wasserman and
Bracken2003). Furthermore, training observations by the authors showed that the existing
items did not cover every relevant aspect of the different training design dimensions (e.g. the aspect of training objectives in the demonstration dimension, or the feedback aspect in the application dimension). Minor changes were also made to the training outcome dimensions. Although the questionnaire was indeed concise, with completion times rarely exceeding 10 min, it was decided that inclusiveness was more important.
Thus, in the second phase, 20 additional items in eight scales were formulated and one redundant item was removed. Two surveys were then conducted using the extended scales, with 482 and 470 training participants, respectively. Both surveys are presented in more detail below. The reliabilities of the extended scales were deemed acceptable, and the feedback from organizational stakeholders was positive with regard to the applicability of the questionnaire and to the conclusions that could be drawn based on the results. The whole questionnaire in its extended form was subsequently used in two training study samples, also explained in more detail below. Reliability values for all samples and the mean overall reliability are displayed in
Table2. The complete questionnaire can be found in the appendix.
In the third and final phase, the data from the second survey was subjected to two
confirmatory factor analyses1in order to determine the factor structure of the
ques-tionnaire (the final models are described in the results section). A Missing Value 1
T able 2 Desc riptive statistics and reliability (inte rnal con sistency: Cronbach ’s α ) o f all TEI dime nsion s for the pre-study and sam ples S1, S2, T rS 1 , and T rS 2 Pre-study (N =55) Sa mple S1 (N =482) Sample S2 (N =470) Sample TrS1 (N =81) Sample TrS2 (N = 46) Mea n reliability a (ex cluding pre-study) M (SD) r M (SD) r M (SD) r M (SD) r M (SD) r T rain ing outc ome dime nsions Sub jective enjoyme nt 4.30 (.64 ) .85 4.1 1 (.64) .82 4.17 (.61 ) .81 3.93 (.69) .85 3.85 (.61 ) .76 .81 Pe rceived usefulness 4.1 1 (.79 ) .88 4.04 (.75) .87 4.09 (.74 ) .90 3.82 (.81) .88 3.43 (.81 ) .91 .89 Pe rceived dif ficu lty 4.30 (.57 ) .79 4.52 (.45) .70 4.42 (.50 ) .63 4.46 (.54) .81 3.89 (.54 ) .75 .73 Sub jective knowledg e gain 3.67 (.70 ) .54 3.73 (.73) .63 3.67 (.73 ) .80 3.48 (.75) .72 3.31 (.73 ) .83 .75 A ttitude towar ds training 4.05 (.68 ) .77 4.00 (.75) .81 3.92 (.75 ) .81 3.73 (.67) .73 3.56 (.77 ) .87 .81 T rain ing desi gn dime nsion s Pr oblem-b ased learning 3.63 (.82 ) .58 3.75 (.64) .71 4.00 (.58 ) .75 4.08 (.55) .75 –– .74 A ctivation 3.81 (1.0 2) .86 3.87 (.70) .81 3.89 (.63 ) .77 3.76 (.83) .85 3.70 (.60 ) .80 .81 D emonstration 4.21 (.67 ) .68 4.23 (.53) .74 4.41 (.45 ) .76 4.47 (.47) .81 3.96 (.46 ) .74 .76 A pplication 3.61 (1.0 2) single item 3.00 (.95) .81 3.25 (.82 ) .82 3.26 (.72) .70 3.04 (.67 ) .74 .77 Inte gration 3.96 (.75 ) .52 3.84 (.60) .60 3.88 (.60 ) .74 3.83 (.57) .66 3.64 (.50 ) .62 .66 Sc ales ranged from 1 to 5 ; aCalculated using Fish er ’s Z transformation; S1 surv ey sam ple 1; S2 survey sample 2; TrS1 training study sample 1; TrS2 training study sam ple 2
Analysis with the software SPSS Statistics 20 showed that values in the dataset were
missing completely at random (Little’s MCAR test: χ2
=6624.7, df=6,629, p=.51). Thus, only complete cases (N=245) were used to avoid problems arising from data
imputation procedures (Tabachnick and Fidell2007). The scales of the two parts of
the questionnaire were analysed separately because they cover conceptually distinct aspects. Data were transformed into a correlation-covariance matrix within SPSS and imported into Amos. Model convergence was an iterative process and the final models were overidentified. The method of estimation applied was the maximum likelihood (ML) method, because it is also suitable for small samples. To determine the goodness of fit, the model fit indicators Comparative Fit Index (CFI), Tucker Lewis Index (TLI), Root Mean Square Error of Approximation (RMSEA), and Standardized Root Mean Residual (SRMR) were used. A model fit of CFI and TLI above .80 is considered acceptable; above .90 the fit is good. A RMSEA weaker than .08 is acceptable, while a value of .06 and lower is good. SMRS values below .08 are
good. Regarding Chi2, a value between 1 and 3 should follow from dividing the value
by the degrees of freedom (for detailed description of model fit indicators see Hu and
Bentler1999). Hu and Bentler (1999, p. 27) recommend examining the combination
of the two indicators TLI/CFI and SRMR in particular. Data Collection
To test the hypotheses, the TEI was used in four samples between 2008 and 2010, of which two were large survey samples and two were drawn from quasi-experimental training studies. In the surveys, solely the TEI was implemented on a large scale basis, while in the smaller scale training studies, further variables in addition to the TEI were measured. The training study samples served to test hypotheses 1 to 3, which are concerned with the interrelations of the TEI training outcome dimensions and their relationships with other outcome measures such as objective learning. Hypothesis 4, introducing training design as an antecedent of training outcomes, was tested using a merged dataset including the survey samples and one training study sample. The second training study sample was not part of the merged dataset. Due to the setting of the study, no data had been collected on the training design dimension of problem-based learning. Hence, the data could not be used to test hypothesis 4.
Survey Samples
Data for the first survey sample (S1; see Table 3 for descriptive statistics) were
collected from April to December 2008. The objective of this survey was to gain a complete picture of the status quo of all team training activities conducted by the collaborating airline regarding subjective perception of their training design, reactions of participants, and learning and attitudes of participants. Based on the results, modifications of certain training activities were planned (for results concerning
cockpit and cabin crews, see Ritzmann et al.2009; Ritzmann2012). Thirteen team
training modules were included, and data of N=482 course participants could be collected. Professional groups included were pilots, cabin crew members, mainte-nance technicians, and air traffic controllers. The course length varied from half a day
to three days. Questionnaires were administered by course instructors and regularly collected by the authors or sent to them per mail.
Data for the second survey sample (S2; see Table3for descriptive statistics) were
collected in October and November 2009 as well as from April to July 2010 with participants of the annual refresher team training 2009 (N=190 cabin crew members) and 2010 (N=196 cabin crew members, N=84 pilots), respectively. The objective of this second survey was to compare the training module of 2009 with the training module of 2010 regarding the training design and training outcome dimensions covered in the questionnaire. The two training modules differed in their format and training design, with the training module of 2010 being more problem-oriented and linking non-technical skills training with more technical safety skills with the aim of
creating an integrated training experience (Ritzmann et al. 2011). In both data
collection periods, trainers were asked to distribute questionnaires in three of four courses per week. Completed questionnaires were collected and handed to the authors. Training lasted for half a day.
Training Study Samples
The first training study sample (TrS1) stems from a study carried out from June to September 2010. Four classes of newly hired junior flight attendants (N=81) in their four-week initial cabin crew member course served as participants. Data were collected from their one-day initial team training module. Questionnaires were distributed after training and collected directly from the participants after completion.
The sample is described in further detail in Table 3. The aim of the study was to
compare the effects of two different team training conditions (attitude-oriented vs. competency-based training). The training conditions and results are described
else-where (Ritzmann2012). The trainer was held constant for all four groups to minimise
the influence of instructor style on trainee reactions (Sitzmann et al. 2008). In
Table 3 Frequencies and descriptive statistics regarding profession, gender, and age from samples TrS1, TrS2, S1, and S2 Sample TrS1 (N=81) Sample TrS2 (N=46) Sample S1 (N=482) Sample S2 (N=470) Training condition 1 ‘Training condition 2 Training module 2009 Training module 2010 Profession Cabin Crew: 38 Cabin Crew: 43 Fire Fighters: 46 Pilots: 146
Cabin Crew: 259 Maintenance: 58 ATC: 19
Cabin Crew: 190 Cabin Crew: 196 Pilots: 84 Gender Male: 6 Female: 32 Missing: -Male: 4 Female: 36 Missing: 3 Male: 43 Female: 3 Missing: -Male: 256 Female: 220 Missing: 6 Male: 44 Female: 147 Missing: 4 Male:130 Female: 147 Missing: 6 Mean Agea (SD) 26.1 (6.0) 23.2 (3.4) ≤ 20: 1 21–30: 14 31–40: 16 41–50: 9 > 50: 6 30.6 (10.2) 33.9 (11.1) 40.9 (9.6)
addition to the administration of the TEI, teamwork attitudes, knowledge, and behavioural intentions were measured. Data were collected before training in order to establish a baseline (T0), directly after training (T1), and again 8 weeks later (T2). Between training and data collection 8 weeks later, junior flight attendants completed
a phase of introductory flights (for more information, see Ritzmann2012).
Data for the second training study sample (TrS2) were collected in July 2010 in collaboration with a German fire service. Participants, all fully qualified fire fighters (N=46), received a half-day team training module in groups of 10 to 15 people. Questionnaires were distributed one day after training and collected directly from the participants after completion. Descriptive statistics of the sample can be found in
Table3. The aim of the study was to evaluate the acceptance and success of team
training within the fire service. For the results, see Hagemann (2011) and Hagemann
et al. (2012). Again, the trainer was held constant for all four groups in order to
minimise the influence of instructor style (Sitzmann et al.2008). Due to the different
professional category, the wording of questionnaire items was adapted if necessary
(e.g. “I know the importance of the different crew resource management topics in
various situations” vs. “I know the importance of different team competencies in various situations”). Due to time constraints, no problem-based learning could be implemented within the training and the corresponding training design dimension was not included in the questionnaire for this sample. In addition to the administration of the TEI, knowledge as well as attitudes towards leadership, debriefing, appraisal of stress and human fallibility were measured (for more information, see Hagemann
2011). Data were collected before training in order to establish a baseline (T0) and
one day after training (T1). An additional experimental variation with an impact on knowledge and attitudes (a form of team debriefing) took place before the second post-test T2. Hence, data from T2 were not used, because they were influenced by the
second experimental variation as well (see Hagemann2011).
Measures
In all four samples, the TEI was used to collect data on training design and training outcomes as perceived by the participants. The descriptive statistics and reliabilities
of the scales can be found in Table2. All items of the TEI had to be answered on a
five-point Likert scale ranging from“strongly disagree” to “strongly agree”. Except
for perceived difficulty, where a higher score indicates less difficulty, higher scale scores represent higher values assigned to the underlying dimension.
Additional measures of external training outcomes (henceforth referred to as external training outcome measures) were used in the training studies to test
hypoth-eses 1 to 3. They are described in more detail in Table4.
Results
Confirmatory Factor Analyses
The results of the confirmatory factor analyses are displayed in Figs.2and3. The factor
T able 4 Description of exte rnal training outcome measur es used in the training study sam ples T rS1 and T rS2 Measur e Description Sample item Format Sample T rS 1 (C abin Crew) T eamw ork attitudes -9 items adapted fro m exis ting attitude questionnair es (e.g. Operating Room Manag ement Attitude s Ques tionnaire (ORMA Q); Y ule et al. 2004 ) -2 items constructed for the study I a m asham ed when I m ake a m istake in fr ont of othe r team membe rs Five-point Li kert scale (strongly disagre e to strongly agree ) Knowle dge -7 knowle dge que stions tailored to training content Please indicate whether the following statement is corr ect or not: ‘Str ess is the resul t o f the appraisal of a situation and arise s when you fee l you don ’t have eno ugh resou rces to manag e the demands ’. 1 ope n question 1 shor t open question 5 true -false que stions Beha vioural inten tions -3 shor t scenarios in written for m, req uiring open answ ers in own words -1 scenar io where the most adequate reaction had to be cho sen from a given selection During boar ding, you notice that th e passeng er on seat 29C is sweating and br eathing heavily . H e looks off-c olour . What do you do? 3 ope n questions 1 multiple-choice que stion Sample T rS 2 (F ire Figh ters) Knowle dge -1 3 knowle dge que stions tailored to training content Please specify wh y feedback is importa nt for teamw ork. 7 ope n questions 5 true -false que stions 1 map ping task Attitude s Lead ership -5 items adapted fro m O RMAQ (S exton et al. 2000 ; Y ule et al. 2004 ) Sen ior staff shou ld encour age questi ons fr om junio r staff durin g m issions: Five-point Li kert scale (strongly disagre e to strongly agree ) Debr iefing -2 items adapted fro m O RMAQ (S exton et al. 2000 ) A regu lar debriefing of pr ocedur es and decision s after a mission is an im portant part of teamw ork. Appr aisal of Stress -2 items adapted fro m C rewmember A ttitudes Ques tionnaire (C AQ; McD onnald and Shadow 2003 ), 1 item adapte d fro m ORMA Q (Sexton et al. 2000 ) Perso nal pr oble ms can adv ersely affect my perf orman ce Huma n Fallibility -2 items adapted fro m O RMAQ (S exton et al. 2000 ) I a m mor e likely to make err ors in tense or hostile situations.
acceptable model fit for the five training outcome dimensions (χ2=261.02, df=101,
p=.000,χ2/df=2.58, CFI=.97, TLI=.95, RMSEA=.059, CI=.050–.067, SRMR=.055).
The indicators also showed acceptable model fit for the five training design dimensions
(χ2
=708.22, df=302, p=.000, χ2/df=2.35, CFI=.92, TLI=.92, RMSEA=.054,
CI=.049–.059, SRMR=.062). The final questionnaire consisted of 45 items.
According to Hair et al. (2006), a construct shows convergent validity if
variance-extracted measures exceed the 50 % level and Cronbach’s α is larger than .70. Reliability estimates show that the average variance extracted (AVE) regarding reported enjoyment (58 %), perceived usefulness (66 %), perceived difficulty (46 %), learning knowledge (59 %), and learning attitudes (60 %) almost reached or exceeded the 50 % level. Also the AVE regarding problem-based learning (46 %),
diff1 diff2 diff3 diff4
Enjoyment Usefulness
Knowledge
Attitudes Difficulty
enjoy1 enjoy2 enjoy3
.61 .77 .76 .42 knowl1 knowl2 knowl3 .76 .74 .72
att1 att2 att3
.59 .46 .74 .40*** .82*** .87*** .97*** .34*** .86*** .76*** .98*** .24*** .34*** .87 .61 .78 .78 .87 .79 .80
useful1 useful2 useful3 useful4
Fig. 2 Results of the confirmatory factor analysis of the training outcome dimensions
act1 act2 act3 act4 act5
dem1 dem2 dem3 dem4 dem5 dem6 dem7
Problem Based Activation
Integration
Application Demonstration
prob1 prob2 prob3 prob4 prob5 prob6
.59 .46 .63 .68 .39 .52 .49 integ1 integ2 integ3 integ4 integ5 .62 .32 .45
app1 app2 app3 app4 app5
.99 .95 .88 .49 .55 .87*** .76*** .74*** .59*** .44*** .54*** .82*** .51*** .72*** .79*** .52 .66 .61 .43 .60 .68 .66 .76 .75 .58 .48 .58 .75
activation (49 %), demonstration (44 %), application (64 %), and integration (45 %) almost reached or exceeded the 50 % level. We did not exclude more variable indicators for increasing AVE due to training relevant information of the items. The
values of Cronbach’s α are displayed in Table2 and exceedα=.70, except for one
scale (training design dimension“integration”). These values are also acceptable for
low-stakes instruments designed for programmatic decision-making (Wasserman and
Bracken 2003). Thus, the theoretically developed structure of the two parts of the
inventory measuring training outcomes and training design could be supported. Testing of the Hypotheses
Following our hypothesis-testing approach to assess construct validity (Nunnally
1978), the four hypotheses formulated for relations of the TEI dimensions with other
measures and with each other were tested after the confirmatory factor analyses. Correlational Analyses of Training Outcome Dimensions and External Training Outcome Measures
Correlational analyses involving the training outcome dimensions of the TEI and external training outcome measures implemented in the training study samples were performed on the respective datasets to test hypotheses 1 to 3. The descriptive
statistics and the correlations of the variables involved are displayed in Table5.
First-order partial correlations were calculated between the training outcome dimen-sions and the external outcome measures after training (T1 and T2), controlling for the baseline level at T0 to isolate effects of training independent of prior attitudes,
knowl-edge, or behavioural intentions (see Warr et al.1999, for a discussion of this procedure).
Table5shows the first-order partial correlations of the five training outcome dimensions
with the training effectiveness measures employed in the two training studies. A range of significant positive relationships with small to large effect sizes can be reported, with
r=.10 being a small, r=.30 being a medium and r=.50 being a large effect (Cohen1992).
To test hypothesis 1, correlations involving the three reaction components subjec-tive enjoyment, perceived usefulness and perceived difficulty were analysed first. Subjective enjoyment showed significant correlations with knowledge of training content. Generally speaking, participants who enjoyed the training course more had more knowledge of its content. In sample TrS1, comprising flight attendants, the effect was not significant immediately after training at T1, but was significant 8 weeks later at T2. In sample TrS2, comprising fire fighters, subjective enjoyment was significantly related to knowledge immediately after training at T1. Thus, the more participants enjoyed the training, the more of the training content they remembered. Perceived usefulness showed a significant correlation with attitudes towards teamwork and knowledge of training content. The relationship with attitudes was found in sample TrS1, comprising flight attendants. The more useful trainees rated the training, the more positive were their attitudes towards teamwork immediately after training (T1) and also 8 weeks later (T2). The relationship between perceived usefulness and knowledge could be observed in sample TrS2, comprising fire fighters, meaning that the more useful these participants rated the training, the more knowledge of training content they showed after training.
T able 5 Co rrelations of the training outcome and training design dimensions with external training outc ome measur es of the training study sam ples T rS1 and T rS2 (pairwise N is give n below cor relation coe fficients) T raining outcome dimensions T raining design dime nsions M (SD) Subjective Enjoyment Perceived Usefulness Perceived Diff iculty Subje ctive Knowle dge Gai n Attitud e towar ds T raining Proble m-based learning Act ivation D emonstration Applica tion Integ ration Sa mple T rS1: Junio r Flight A ttendants Attitude tow ards teamwork (scale: 1– 5) T1 (T0 held con stant) 4.05 (.30 ) .089 .246* .1 12 .156 .258 * .181 .1 14 .060 .226 + .107 76 75 77 74 77 74 70 74 69 74 T2 (T0 held con stant) 4.01 (.30 ) .098 .255* .148 .155 .255 * .085 − .043 .216 + − .069 − .012 73 73 74 71 74 71 69 70 68 73 Knowle dge of training content (0 –16 pts.) T1 (T0 held con stant) 7.91 (2.9 1) − .050 .025 .198 + .048 .042 .179 .078 .160 .250 * .143 72 72 73 69 73 68 64 69 64 70 T2 (T0 held con stant) 6.44 (2.2 4) .248* .196 .271 * .290 * .247 * .347 ** .262 * .443 ** .187 .284 * 69 69 70 66 70 67 63 66 63 68 Behaviour al intentions (− 3.5 –12.5 pts.) T1 (T0 held con stant) 4.47 (1.5 3) .022 .042 .166 .1 10 .204 .176 − .034 .212 .180 .364 ** 56 55 56 53 56 54 50 54 49 53 T2 (T0 held con stant) 4.05 (1.6 4) .010 − .140 − .089 − .059 − .051 .008 − .091 .088 .003 .153 60 59 60 57 60 58 54 58 54 58 Sa mple T rS2: Fir e Figh ters Knowle dge (0 –60 pts.) T1 (T0 held con stant) 35.41 (8.9 4) .430* .518** .369 + .408 * .546 ** – .488 * .489 * .364 + .449 * 28 27 27 28 28 28 27 28 28 Attitude (sc ale: 0– 4) 3.06 (.37 ) .427* .365+ .124 .208 .292 – .317 .384 + .632 ** .240
T able 5 (co ntinued) T raining outcome dimensions T raining design dime nsions M (SD) Subjective Enjoyment Perceived Usefulness Perceived Diff iculty Subje ctive Knowle dge Gai n Attitud e towar ds T raining Proble m-based learning Act ivation D emonstration Applica tion Integ ration Leader ship T1 (T0 held con stant) 28 27 27 28 28 28 27 28 28 Debriefing T1 (T0 held con stant) 3.32 (.55 ) .447* .293 .066 .267 .253 – .136 .239 .299 .373 + 28 27 27 28 28 28 27 28 28 Appraisa l Stress T1 (T0 held con stant) 2.77 (.61 ) .332+ .249 − .142 .142 .302 – .347 + .284 .441 * .239 28 27 27 28 28 28 27 28 28 Human Fall ibility T1 (T0 held con stant) 2.40 (.62 ) .462* .380+ .1 16 .269 .396 * – .368 + .658 ** .417 * .450 * 28 27 27 28 28 28 27 28 28 T0 baseline before training; T1 mea sureme nt imme diately after training; T2 measur ement 7.5 weeks after training; + p< .10, * p <.05, ** p <.01 (two-tailed)
Perceived difficulty, the third reaction component, correlated significantly with knowledge of training content. The relationship could be observed at T2 in the flight attendant sample TrS1, meaning that the easier trainees found the training, the more of it they remembered after 8 weeks. No significant correlations of perceived difficulty and other outcome measures could be found in the fire fighters sample TrS2.
To sum up, we found significant relationships between reactions, as measured with the TEI, and learning and attitudes after training, as measured with other instruments. Subjective enjoyment showed the highest number of significant correlations, and perceived difficulty the lowest. These results are in line with our first hypothesis. However, contrary to our expectations, we did not find any significant relationships between reactions and behavioural intentions. Furthermore, the correlations that emerged were not entirely consistent between the samples. We thus consider hypoth-esis 1 as partially confirmed.
Hypothesis 2 stated that subjective knowledge gain as measured by the TEI is related to objective learning measures. In support of the hypothesis, significant correlations of subjective knowledge gain and knowledge of training content could be found in both samples, TrS1 and TrS2, although in the flight attendant sample TrS1, the relationship was only significant at T2, 8 weeks after training, and not at T1. In terms of the discriminant validity of the dimension, it can be noted that it did not significantly correlate with any other external outcome criteria (i.e. attitudes and behavioural inten-tions). In summary, these results show strong, albeit incomplete support for hypothesis 2. Hypothesis 3 was tested by examining the relationships between attitudes towards training as measured by the TEI and attitudes towards the training topics covered in the two training studies. In sample TrS1, with flight attendants as participants, attitudes towards training indeed correlated significantly with attitudes towards teamwork at both times of measurement (T1 and T2). The more positive the attitude towards training was as a whole, the more positive were the specific attitudes towards teamwork. Looking at sample TrS2, comprising fire fighters, attitude towards training correlated significantly with attitudes towards human fallibility. Although the remaining attitude measures were not significantly related to the TEI attitude dimen-sion, two of three correlations showed medium effect sizes around r=.30. Regarding the discriminant validity of the dimension, significant correlations with knowledge of training content could be observed in both samples. The discriminant support is thus less strong than for subjective knowledge gain. Summing up, the evidence for hypothesis 3, it was confirmed in sample TrS1 and partially confirmed in sample TrS2, leading to an overall partial confirmation.
Multiple Regression Analyses of Training Design Dimensions as Antecedents of Training Outcomes
Multiple regression analyses were performed to test hypothesis 4, which assumes that the training design dimensions serve as antecedents of training outcomes. To accom-plish this, it was decided to combine the dimension scores as well as demographic information on sex, age, and prior experience with team training from all suitable samples in one dataset. Data of sample TrS2 were not included, as it did not contain information on the problem-based learning dimension, which had been excluded from the questionnaire for this particular study. The combined dataset consisted of
N=1,041 respondents (43.1 % male). The mean age was 33.5 years (SD=11.1). Approximately three quarters of respondents (75.9 %) had prior experience with team training. Intercorrelations of the TEI dimensions and age were calculated. Due to the large sample size, almost all of the 55 correlations were significant but the correlations showed no multi-collinearity. All the correlations between the TEI dimensions were significant at p<.01 (ranging from r=.13 to r=.82) with the excep-tion of applicaexcep-tion and perceived difficulty (r=.02, ns). Age resulted in eight out of ten significant correlations with the dimensions, but all of them showed a small
magnitude (ranging from r=−.15 to r=.21).
Five hierarchical multiple regression analyses on the combined dataset were then carried out using the demographic variables and the five training design dimensions as predictor variables and the training outcome dimensions as criteria. Demographic
variables were entered in the regression to control for“third variable” effects (Field
2005). Sex was coded as 0 (male participants, 45.4 % of the sample) and 1 (female
participants). Prior experience with team training was coded as 0 (no prior experi-ence, 27.5 % of the sample) and 1.
Subjective Enjoyment
Sex, age, and prior experience with team training were able to account for 6.1 % of the
variance in enjoyment of training (p<.001, ƒ2=.06). The training design dimensions
accounted for another 26 % of variance, leading to a total explained variance of 32.2 %
(p<.001,ƒ2=.47; see Table6). Prior experience in team training and the training design
dimensions demonstration, application, and integration emerged as significant predictor variables in the model. As the positive beta values show, more prior experience as well as more demonstration, application, and integration led to more enjoyment of training. Perceived Usefulness
With regard to perceived usefulness, the demographic variables entered in the first step
accounted for 2.4 % of the variance. This small effect was significant (p<.01,ƒ2=.02).
The training design dimensions were able to explain a further 24.2 % of variance,
resulting in 26.6 % of explained variance in the final model (p<.001, ƒ2=.36; see
Table6). Looking at the significant predictor variables, the positive beta value of sex
indicates that male respondents seemed to find the training more useful for their job, as males were coded as zero. Furthermore, higher values of problem-based learning, demonstration, application and integration resulted in higher perceived usefulness. Perceived Difficulty
Sex, age, and prior experience with team training accounted for 2.6 % of the variation in
perceived difficulty of training, again a small but significant effect (p<.001,ƒ2=.03). An
additional 15.5 % was explained by the training design dimensions, leading to 18.2 % of
explained variance (p<.001,ƒ2=.22; see Table6). The significant demographic predictor
variables in the model show that female respondents and younger participants in our sample perceived training programmes to be less difficult. With regard to training design, activation, demonstration, and integration made training easier for participants.
However, respondents perceived training with higher application ratings to be more difficult, as evidenced by the negative beta value.
Subjective Knowledge Gain
Demographic variables only explained 1.8 % of variation in subjective knowledge
gain, but despite its small size, the effect was significant (p<.01,ƒ2=.02). The training
design dimensions entered in the second step of the regression accounted for a further
24.9 % of variance, resulting in 26.7 % of overall variance explained (p<.001,ƒ2=.36;
see Table 6). Sex proved to be a significant demographic predictor, with male
respondents in our sample reporting more knowledge gain than female respondents. Regarding the training design dimensions, higher values in problem-based learning, demonstration, application, and integration predict higher subjective knowledge gain. Attitude Towards Training
Sex, age, and prior experience with training accounted for 2.6 % of the variance in
attitude towards training (p<.001,ƒ2=.03). An additional 25.9 % could be explained
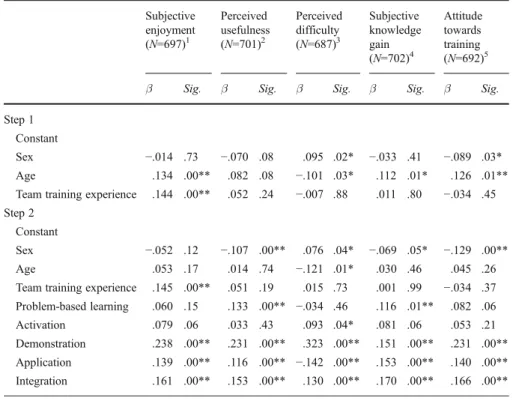
Table 6 Multiple regressions of demographic variables and training design dimensions on training outcome dimensions Subjective enjoyment (N=697)1 Perceived usefulness (N=701)2 Perceived difficulty (N=687)3 Subjective knowledge gain (N=702)4 Attitude towards training (N=692)5
β Sig. β Sig. β Sig. β Sig. β Sig.
Step 1 Constant
Sex −.014 .73 −.070 .08 .095 .02* −.033 .41 −.089 .03* Age .134 .00** .082 .08 −.101 .03* .112 .01* .126 .01** Team training experience .144 .00** .052 .24 −.007 .88 .011 .80 −.034 .45 Step 2
Constant
Sex −.052 .12 −.107 .00** .076 .04* −.069 .05* −.129 .00**
Age .053 .17 .014 .74 −.121 .01* .030 .46 .045 .26
Team training experience .145 .00** .051 .19 .015 .73 .001 .99 −.034 .37 Problem-based learning .060 .15 .133 .00** −.034 .46 .116 .01** .082 .06 Activation .079 .06 .033 .43 .093 .04* .081 .06 .053 .21 Demonstration .238 .00** .231 .00** .323 .00** .151 .00** .231 .00** Application .139 .00** .116 .00** −.142 .00** .153 .00** .140 .00** Integration .161 .00** .153 .00** .130 .00** .170 .00** .166 .00** 1R2=.061 for Step 1 (p<.001);ΔR2=.260 for Step 2 (p<.001);2R2=.024 for Step 1 (p<.01);ΔR2=.242 for Step 2 (p<.001);3 R2=.026 for Step 1 (p<.001);ΔR2=.155 for Step 2 (p<.001);4 R2=.018 for Step 1 (p<.01);ΔR2=.249 for Step 2 (p<.001);5 R2=.026 for Step 1 (p<.001);ΔR2=.259 for Step 2 (p<.001) * p<.05; **p<.01 (two-tailed)
by the training design dimensions. The final model thus accounted for 28.6 % of the
variation in attitude towards training (p<.001,ƒ2=.40; see Table 6). The significant
demographic predictors show an influence of sex (male respondents in the sample had a more positive attitude towards training) and age (older participants showed a more positive attitude towards training). The design dimensions demonstration, application, and integration were also linked to more positive attitudes.
To sum up, training design dimensions explained around 25 % of the variance in the training outcome dimensions when the variance explained by the demographic variables was held constant, with the exception of perceived difficulty. Given the wide variety of possible factors that have an influence on training outcomes beside training design (e.g. factors relating to the trainee such as motivation, or factors
stemming from the organizational context; see Cannon-Bowers et al.1995for more
details), this can be considered a rather high value. The most important training design dimensions predicting the reaction, learning, and attitude dimensions were demonstration, application, and integration. Generally speaking, when these instruc-tional design principles were implemented, more favourable reactions, a higher subjective knowledge gain, and more positive attitudes towards training were achieved. The only exception was the effect of application on perceived difficulty, with higher values in application corresponding to a subjectively more difficult training for participants. In terms of the remaining two design dimensions, problem-based learning had a positive effect on subjective knowledge gain and perceived usefulness, and activation reduced perceived difficulty of training. All
models showed medium to large effect sizes (Cohen 1992). Overall, these results
confirm hypothesis 4. The higher the ratings for the training design were, the more positive were the training outcomes, although application apparently made training subjectively more difficult.
Post-hoc Analyses
To broaden the scope of hypothesis 4, we explored the correlations between training design dimensions and external training outcome measures in a post-hoc analysis. This procedure lowers the risk of confirming hypothesis on the basis of common method variance, as both the training design and the training outcome dimensions
were measured in a single questionnaire (Podsakoff et al.2003).
The correlations between training design and external training outcomes and their
significance can be found in Table5. To summarise the results for the flight attendant
sample TrS1, the training design dimensions mainly had an impact on knowledge after 8 weeks, but in the case of application also on knowledge directly after training. Participants who perceived the training to be well designed were thus able to memorise and remember more of the discussed topics. Furthermore, the possibility to integrate what was learned into their own knowledge was positively related to more successful behavioural intentions. Integration is thus the only dimension in the TEI that showed an impact on behavioural intentions in the flight attendant sample. Summarising the results for the fire fighter sample TrS2, three of the four training design dimensions showed a positive correlation with knowledge, mirroring the results of sample TrS1. Moreover, a positive impact of training design on attitudes, especially on attitudes towards human fallibility, could be observed. Overall, we thus
found support for the notion that a well-planned training design with a focus on instructional principles has a positive effect on training outcomes, also when external outcome measures were used. The effect mainly emerged for the knowledge mea-sures, and to a lesser extent for attitudes and behaviour.
Discussion
As stated in the introduction, the objective of this article was to introduce an approach to training evaluation that is theoretically and empirically founded, but at the same time meaningful to training decision makers and applicable within typical organisational constraints that do not permit to use more specific evaluation mea-sures. Furthermore, with the inclusion of training design dimensions, the TEI sup-ports formative evaluation and the exploration of design-related questions.
The results showed that the reliabilities of the training outcome dimensions (subjective enjoyment, perceived usefulness, perceived difficulty, subjective knowl-edge gain, and attitude towards training) and the training design dimensions (prob-lem-based learning, activation, demonstration, application, and integration) of the TEI were satisfactory, with all values deemed acceptable for low-stakes instruments designed for programmatic decision-making with only minor or indirect
conse-quences for individual examinees (Wasserman and Bracken2003, p. 55). It can be
argued that once a test meets a reliability criterion set for its area of application, the benefits of further increasing reliability are limited because of the risk of producing a
narrow scale with compromised validity (Clark and Watson 1995; cited after
Wasserman and Bracken2003, p. 55). The items of the TEI were also subjected to
two confirmatory factor analyses. The CFA supported the theoretically developed structure of the two parts of the inventory measuring training outcomes (five factors) and training design (five factors).
The first hypothesis that was tested concerned the three reaction dimensions included in the TEI and their relationship with other measures of training outcomes. As hypothesised, they showed a range of significant correlations with knowledge of training content and attitudes towards teamwork skills. Our results are thus in line with studies and meta-analyses showing substantial relationships between reactions
and other training outcomes (Alliger et al.1997; Sitzmann et al. 2008; Warr et al.
1999). Although reactions have been described as neither necessary (Kauffeld2010)
nor sufficient (Tannenbaum and Yukl 1992) for subsequent changes in attitudes,
knowledge, or behaviour, they do possess informational value, based on our results and other published work in this area. Furthermore, the aspect of reactions ensures face validity from the perspective of training practitioners. Despite the encouraging results, the hypothesis could only be partially confirmed because the correlations in the data differed between the two samples used to test our assumptions. One reason for this might be that differing external measures of knowledge and attitudes were used. Future research to meet this limitation should ideally use the same instruments along with the TEI in different samples and across different types of training. However, the latter is difficult to realise, as the outcome measures have to be adapted to the content of training. An innovative method to overcome this problem could be
results from different samples and to seek generalisation regarding the relationship of the TEI with other training outcome measures. Moreover, possible moderator
vari-ables such as training motivation (Colquitt et al.2000) or learning styles (Gully and
Chen2010) that are known to influence training outcomes should be assessed.
The second hypothesis stated that the TEI dimension subjective knowledge gain would be significantly related to objective learning measures. This was confirmed in both samples, although in the flight attendant sample, the correlation between subjective knowledge gain and knowledge of training content was only significant after a transfer period of 8 weeks. One possible explanation for this finding is that immediately after the training course all participants had a high level of knowledge, leading to a ceiling effect masking the true relationship. An indicator for the high discriminant validity of the scale is that it was not related to any other training outcome (attitudes or behavioural intentions). Our results thus show that subjective knowledge gain can be useful as a proxy for knowledge of training content when the use of knowledge tests is not possible or different courses with different knowledge content have to be compared. Our data are in line with research in the area of instructional communication, where the use of self-assessments of knowledge has
had a long tradition (Chesebro and McCroskey2000), and with meta-analytic results
showing moderate correlations of self-reports of knowledge and cognitive learning
(Sitzmann et al.2010).
In the third hypothesis, we assumed that the general attitude towards training as measured in the TEI would be significantly correlated with the more specific attitudes towards the training content. We indeed observed significant relationships, and even though in the fire fighter sample, this was only true for one of four specific attitude scales, two of the other scales showed medium effect size correlations as well. The discriminant validity of the attitude dimension was lower than the discriminant validity of the subjective knowledge gain dimension; we observed significant corre-lations of attitude towards training and knowledge of training content in both samples. This result might be due to the fact that attitudes towards training are
formed in an evaluative process (Olson and Zanna 1993), which is positively
influenced by high knowledge gain (the more participants learn, the more favourable their attitude). More research regarding the inclusion of attitude towards training in evaluation is needed, but our results are promising and show that attitudes as part of the learning level of evaluation can be included in a generic training evaluation instrument.
Our fourth hypothesis stated that training design following sound instructional principles is an antecedent of positive training outcomes, and was confirmed by hierarchical regression analyses. Around 25 % of variance in the training outcome dimensions could be explained by training design, with demonstration, application, and integration being the most important design dimensions. The final models all
showed medium to large effects (Cohen 1992). Our results are thus in line with
previous studies showing a relationship between training design and the outcomes of
instruction (Frick et al. 2009). Furthermore, significant relationships of training
design dimensions, knowledge of training content, and specific attitudes towards teamwork could be observed in a correlational post-hoc analysis. We regard these results as an important indication that the outcomes of the regression analyses were
would be valuable in future studies to run similar hierarchical regression analyses with training outcome data that was not collected using the TEI. To sum up the results regarding the hypotheses, they were all completely or partially confirmed and support the construct validity of the TEI.
Concerning the generic, context-independent nature of the TEI, it can be argued that this approach risks being superficial because training outcome measures should match what is being learned to assure the relevance of results (Goldstein and Ford
2002; Kraiger et al. 1993). We agree with this notion. However, when choosing a
methodology for training evaluation, available resources, the intended purpose of the evaluation, and the needs of the intended audience have to be considered (Aguinis
and Kraiger2009). The TEI is not suitable to answer questions such as whether or not
trainees are able to apply a learned technique in practice, to name an example. However, the TEI can be used to answer questions such as whether or not trainees found training useful or have gained knowledge through training. Additionally, training design aspects can be appraised. Thus, the TEI should not replace more outcome-specific, tailored evaluation measures, but be a reliable and valid comple-mentary tool for contexts with restraints that make a generic questionnaire the most feasible option.
Implications for Further Research
First, using the TEI and other paper-and-pencil outcome measures, the problem of common method variance has to be considered. To mitigate consistency effects as a source of common method variance, the TEI contains a number of items high enough
to prevent participants from deliberately “tuning” their answers to be consistent
(Podsakoff et al. 2003). Additionally, we used external training criteria to test
hypotheses 1 to 3. These criteria had a different format and were presented as separate questionnaires or tests to ensure that they were perceived as distinct from the TEI
(Podsakoff et al.2003). We can thus assume that the influence of common method
variance was minimised.
Second, no higher-order evaluation with regard to feasibility of the instrument was done with practitioners, although organizational stakeholders were asked for feed-back regarding the applicability of the questionnaire. Therefore, further research is needed to investigate the subjective acceptance of the questionnaire by trainees and to identify the possible application of the questionnaire in all kinds of seminars and trainings for trainees with various cognitive qualifications.
Third, the data analysed in this paper stems from different team training contexts. It would be beneficial to conduct further studies using the TEI in other training areas. Currently, our research group applies the TEI in a range of contexts, for example in the evaluation of blended learning or of undergraduate statistical courses. This data can serve to further validate the TEI in the future.
Fourth, the TEI does not explicitly include the transfer motivation of trainees, although two items within the dimensions of attitude towards training and integration consider aspects of the intention to transfer the training content to the workplace (att1,
int5, seeAppendix). Previous work has shown the influence of transfer motivation as
a moderator variable on training outcomes such as work effectiveness or knowledge