Designing Policy Feedback: Experimental Evidence
on the Everyday Politics of the Social Contract
by
Olivia Anna Kristina Bergman
B.A., Wellesley College (2012)Submitted to the Department of Political Science in partial fulfillment of the requirements for the degree of
Doctor of Philosophy in Political Science at the
MASSACHUSETTS INSTITUTE OF TECHNOLOGY May 2020
c
2020 Olivia Anna Kristina Bergman. All rights reserved. The author hereby grants to MIT permission to reproduce and to distribute publicly paper and electronic copies of this thesis document
in whole or in part in any medium now known or hereafter created.
Author . . . . Department of Political Science May 20, 2020 Certified by . . . .
Kathleen Thelen Ford Professor of Political Science Thesis Supervisor Accepted by . . . .
Fotini Christia Professor of Political Science Chair, Graduate Program Committee
Designing Policy Feedback: Experimental Evidence
on the Everyday Politics of the Social Contract
by
Olivia Anna Kristina Bergman
Submitted to the Department of Political Science on May 20, 2020 in partial fulfillment of the requirements forthe degree of Doctor of Philosophy in Political Science
Abstract
For most of history, people had only infrequent personal contact with their governments. The modern social contract generates everyday interactions between citizens and states. In this dissertation, across three papers and three countries, I examine when and how such policy experiences shape attitudes toward government, using experimental methods grounded in a comparative perspective. I explore traditional policy design factors—the defining aspects of policies that shape “who gets what”, which I term ‘macro design’—alongside factors receiving less attention in the literature—those that often shape “when and how”, which I term ‘micro design’. In the first paper, I compare the experience of filing taxes in the US and Sweden, showing that design focuses citizens’ attention in very different ways: on tax compliance and payment in the US, on refunds in Sweden. In a nationally-representative survey experiment, I link a US-style tax environment with perceptions that the government is wasteful. In the second paper, I conduct a large-scale randomized field experiment that shifts administrative burdens away from citizens. Using a highly scalable digital intervention that simplifies the claiming of a means-tested benefit, I substantially increase reported satisfaction with both the bank and government among 195,414 low-income customers of an Australian bank. This is true even though effects on take-up, ascertained by linking bank data to government records, are modest. In the third paper, I situate these findings within a new theory of how the design of policy experiences shapes government attitudes. I propose that two dimensions affect attribution of credit for policies: the valence of the experience, and the salience of the government’s role. After outlining how macro and micro design factors shape experiences, I present a nationally-representative survey experiment showing that channeling benefits through the tax code results in government not getting credit where due. Together, these experiments illustrate the powerful effects of subtle design factors on citizens’ views of government. More broadly, this dissertation suggests that, in addition to how policy content affects politics—“who gets what”—studying “when” and especially “how” citizens experience policies in their everyday lives illuminates attitudes underpinning democracy.
Thesis Supervisor: Kathleen Thelen Title: Ford Professor of Political Science
Acknowledgements
When I got into MIT, I thought they had sent the letter to the wrong person. It wasn’t until Kathy Thelen called me that I realized it wasn’t a mistake. Ever since, Kathy has been a guiding light—an exceptional scholar, a kind human being and a brilliant, supportive advisor. I am lucky that Devin Caughey and Peter Hall also joined my committee. Devin, who started as an assistant professor when I got admitted, has modeled a stellar example of how to transition from grad school to faculty to tenure, whilst remaining helpful and thoughtful to everyone around. Peter Hall has been incredibly generous with his time, feedback, and humor. In class and outside, he has made me laugh and think at the same time, the best combination. His comments have vastly improved my work at every stage.
Many others have gone above and beyond to be helpful. As my lovely peers at MIT can attest to, the department has a fantastic administrative team. Special mentions are in order for the wonderful Kate Searle, who has been a friendly face and magical helping hand from day one, and Susan Twarog, who has been invaluable in guiding me through personal struggles, cross-country moves, and completing my degree in the midst of Covid-19. Paul Pierson has shaped my thinking about American politics—first with a very fun course on comparative political economy, co-taught with Kathy via video conference, and then at UC Berkeley. Michael Hiscox has been a godsend—a kindred spirit who introduced me to applied work in Australia, showed me how to travel like a boss, and reminded me that research should be fun. It is not lost on me how much you help junior scholars. Thanks also to the Harvard STAR Lab, Catherine Nehring, and the phenomenal team at CBA who make work fun.
Pursuing a PhD is a professional endeavor, but also a personal one. Though I didn’t realize it at the time, for me it started 15 years ago when I left small-town Sweden. I have benefited from the wisdom and encouragement of countless people since then.
Some made a difference at a pivotal moment: Inger Larsson in Varberg, Summer Go-van in Flekke, Joy Renjilian-Burgy and Elena Gascon-Vera at Wellesley, Aynn Setright in Nicaragua, and Bill Slotnik and Sylvia Saavedra-Keber who took a chance on me in Boston. Though I’ve often felt like an alien in unknown territory—as many first generation stu-dents can relate to—I’ve never felt alone. I thank my lucky star that I found family away from home: Mattie Govan, Disa Hynsjö, Maja Stilling and Rochelle Wacklin, thanks to RCN United World College; Irem Yoruk and Gerta Malaj became essential to my happiness at Wellesley and have remained so beyond; as has Rachel Brown, whom I met on Craigslist, of all places. Thanks for being the best of friends and for having my back all these years.
Friends made life outside grad school not just bearable but hilarious: Christopher Leighton, Amber Batata, Anja Saloranta, Amitabh Chandra, David Drott, Lisa Yanagizawa-Drott, Oeindrila Dube, Kate Baicker, Alan Durell, Sophie Powell-Westra, Christian Westra, Torkel Spade, Tea Zakula, Michelle Shkedi, Semir Beyaz, Tuğba Bozçağa, Özgür Bozçağa, Jason Spicer, Scott Veidenheimer, Will Wacklin, and many others. Amanda Elfström, Celina
Lazo, and Camilla Sandström cheered from Sweden. Sendhil Mullainathan stands out for sage advice, often at anxiety-filled junctures, such as a reminder that some things—just like “words, fantasies and bureaucrats”—both “matter tremendously and matter not at all”.
Thanks to all California friends, who punctured the myth that nice weather means more fun but less productivity: Supreet Kaur, Narinder Singh (and Guneeve!), Elizabeth Linos, George Mitselos, Danny Yagan, Meredith Bock, Ned Augenblick, Annika Todd-Blick, Jon Kolstad, Katrina Abuabara, Josh Blumenstock, Annie Youngerman, Jana Gallus, Gregor Martynus (and the triplets!), Paul Klingenstein, Kathleen Bole, Steve Tadelis, Avi Feller, Jessie Weiser, Evan White, Ingrid Hägele, and many others. Thanks also to the UC Berkeley campus for letting me finish my PhD surrounded by palm trees and humming birds.
I am grateful that I’ve gained a wonderful bonus big brother (Kim), nieces (Asha and Luna), a nephew (Soleo), and parents-in-law. Carla and Gerald, thanks for welcoming me like a daughter, for helping beyond producing a perfect human for me to marry, and for being excited about having another real doctor in the family.
In the time it took me to get here, my loving grandparents left this world much emptier. Their life stories remind me of the enormous transformations Sweden has undergone in the last century. None of them got to stay in school very long, so they would all be pleased that their granddaughter can choose to never get out of school. Barbro, älskade farmor: thanks for teaching me to replace “I don’t know” with “Let’s find out!” It’s not only an excellent way to raise (grand)children, but as it turns out, also the very creed of being an academic.
I feel such gratitude toward those who never asked how my ‘disser-what?’ was going. To family, thanks for always reminding me that I could come home whenever. Linnéa, who doubles as my cooler little sister and best friend, has thankfully overlapped with me in the Americas for periods of time. Besides being the most fun company, she is also incredibly thoughtful: for my last stretch of dissertating she sent me a custom-made sweater so that every time I looked in the mirror, my reflection would tell me “du är bäst”. Watson provided great cuddles. Viktor is the type of big brother who buys you dessert, gets you into clubs, and binge-watches the entire season of House of Cards with you on Valentines Day just because you ask. He claims he beat me on an IQ test when we were kids. Thank God I finally have a higher degree to beat him over the head with.
To my parents, Ewa and Henrik, who barely have a competitive bone in their bodies, but would win any parenting competition in the world: words cannot describe the gratitude I feel. How lucky that I somehow ended up with both the nicest mom and the nicest dad in the universe. Thanks for letting me go out into the world, for visiting often, and for accepting that two years slowly turned into fifteen.
Ziad, these acknowledgements are in alphabetical order; I am not procrastinating because yours is hardest to put into words. You’ve been my biggest fan and best critic. You can correct my standard errors and pitbull wounds. I’ve no clue how I got this lucky, but I’m for-ever grateful. Don’t tell anyone, but our relationship is probably my biggest accomplishment over the past 6 years. Thanks for being the best teammate imaginable. Ixxxtchtx.
Lastly, in the spirit of not moving the goalpost without celebrating, I also thank my past self, who didn’t know I could do this. “Opportunity is missed by most people because it is dressed in overalls and looks like work”. Well, it was definitely work, but also one of the best opportunities I’ve ever been given. I hope to pay it forward.
Contents
List of Figures 9
List of Tables 10
Introduction 13
1 Feeling Taxed?
Comparative Tax Experiences and Policy Feedback in the US and Sweden 18
1.1 Introduction . . . 18
1.2 Policy Design as a Political Force . . . 21
1.3 Comparing Sweden and the United States . . . 24
1.4 Evidence on the Salience of Taxation . . . 27
1.5 Experimental Evidence . . . 35
1.6 Discussion and Conclusion . . . 42
2 Benefits of Design: A Field Experiment on Effects of Shifting Burden from Citizens to a Bank 45 2.1 Introduction . . . 45
2.2 Theory and Literature . . . 47
2.3 Setting and Background . . . 53
2.4 Empirical Design and Data . . . 55
2.5 Results . . . 63
2.6 Discussion and Conclusion . . . 78
3 Credit Where Due? Theory and Evidence: Design of Policy Experiences Shapes Attitudes Toward Government 82 3.1 Introduction . . . 82
3.2 Theory: Policy Experiences Affect Attitudes . . . 83
3.3 Design Factors Shape Policy Experiences . . . 86
3.4 Experiments: How Design of Policy Experiences Shapes Government Attitudes 88 3.5 An Experiment Making Hidden Benefits Salient . . . 92
3.6 Discussion and Conclusion . . . 99
A Appendix for Paper 1 102 A1 Experimental Instrumentation . . . 102
A3 Robustness Checks and Extensions . . . 112
B Appendix for Paper 2 118
B1 Experimental Implementation . . . 118 B2 Summary Statistics and Balance . . . 125 B3 Robustness Checks and Extensions . . . 130
C Appendix for Paper 3 150
C1 Experimental Instrumentation . . . 150 C2 Summary Statistics and Balance . . . 153 C3 Robustness Checks and Extensions . . . 160
List of Figures
1 Policy Design Feedback Loop . . . 15
1.1 Relative Frequency of Search Terms (Sweden, 2015) . . . 31
1.2 Relative Frequency of Search Terms (US, 2015) . . . 31
1.3 Headlines: United States (top) and Sweden (bottom) . . . 36
1.4 Policy Feedback . . . 43
2.1 Sample Invitation (‘Generic $’) and Application Page (Simplified) . . . 58
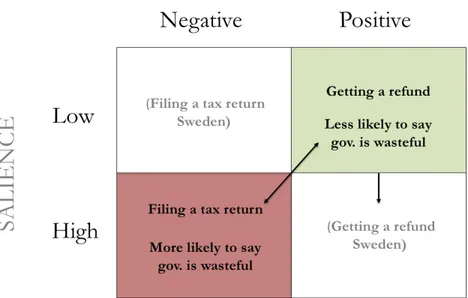
3.1 Policy Experiences Affect Attitudes . . . 84
3.2 Relationship Between Experiences and Government Attitudes . . . 85
3.3 Macro and Micro Design Shape Valence and Salience . . . 87
3.4 Experimentally Increasing Salience of Filing Taxes or Getting Refunds (US) 90 3.5 Experimentally Simplifying the Claiming of a Benefit (Australia) . . . 91
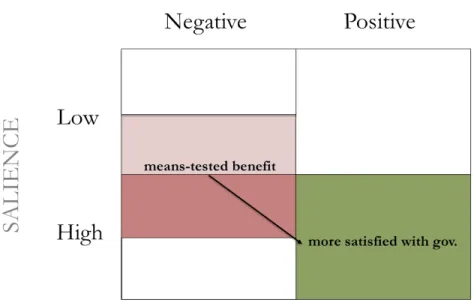
3.6 Experimentally Making Hidden Benefits Salient . . . 92
3.7 Policy Design Feedback Loop . . . 100
A1.1 Tax Return Treatment, Screen 1 . . . 102
A1.2 Tax Refund Treatment, Screen 1 . . . 103
A1.3 Tax Return Treatment, Screen 2 . . . 103
A1.4 Tax Refund Treatment, Screen 2 . . . 104
A1.5 Outcome: Government Waste . . . 104
A1.6 Outcome: Personal Tax Satisfaction . . . 104
A1.7 Example of a Screener to Measure Attentiveness . . . 105
A2.1 Attention Distribution . . . 109
A3.1 Marginal Effects (Conditional on Attentiveness) . . . 114
A3.2 Marginal Effects (Binning Estimators) . . . 114
A3.3 Raw Plots (Linearity, Common Support) . . . 115
B1.1 Experimental Design . . . 118
B1.2 Timeline and Outcome Measurements . . . 119
B1.3 Informational Invitations . . . 120
B1.4 Application Pages . . . 121
B1.5 Days between Intervention and Survey Response . . . 122
B1.6 Treatment Survey . . . 123
B1.7 Control Survey . . . 124
B3.1 Self-Reported Reasons for Not Managing to Claim . . . 144
C1.1 Question on Program Usage . . . 150
C1.2 Control Group, Screen Two . . . 151
C1.3 Treatment Group, Screen Two . . . 151
C1.4 Question on Government Efficiency . . . 152
C1.5 Question on Size of Government . . . 152
C1.6 Question on Government Waste . . . 152
C1.7 Example of a Screener to Measure Attentiveness . . . 153
C2.1 Waste Distribution . . . 154
C2.2 Attention Distribution . . . 157
List of Tables
1.1 Tax Categories, Sweden vs. US . . . 261.2 Tax Season Timelines 2015 . . . 28
1.3 Descriptive Statistics of News Article Sample . . . 33
1.4 Most Common Headline Words: Tax Refunds . . . 34
1.5 Most Common Headline Words: Tax Return Filing . . . 34
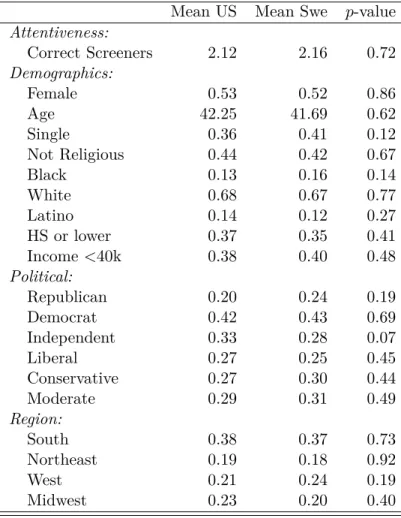
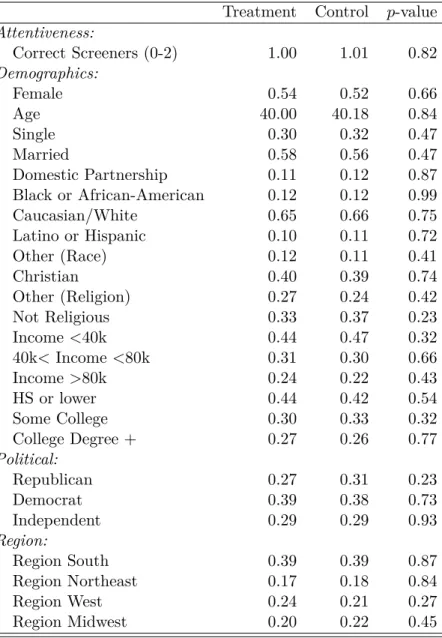
1.6 Covariate Balance (Full Sample, n=982) . . . 38
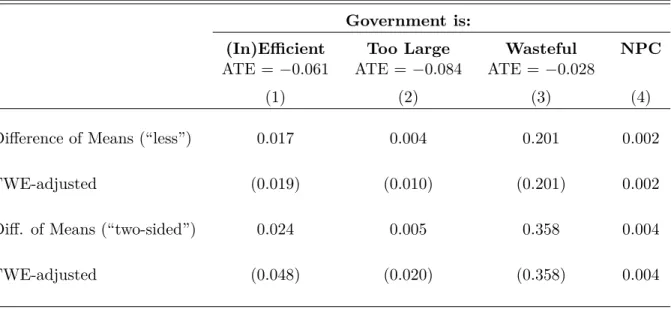
1.7 Experimental Results (By Attention Level) . . . 41
2.1 Characteristics of the Study Population . . . 60
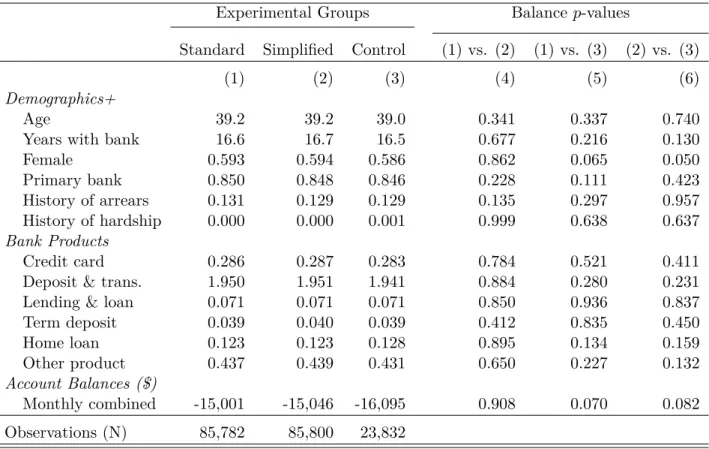
2.2 Balance of Study Population Across Main Experimental Groups . . . 61
2.3 Clicking ‘Yes’ in Response to the Invitation . . . 64
2.4 Steps toward Claiming, by Application Page . . . 65
2.5 Effect of Simplified Treatment on Electricity Bill Amounts . . . 68
2.6 Effect on Take-Up for one Electricity Provider, per Government Records . . 71
2.7 Satisfaction with the Bank and the Government, by Application Page . . . 76
2.8 Relationship Between Satisfaction and Reported Claiming . . . 78
3.1 Covariate Balance: Full Sample (n=1,023) . . . 96
3.2 Effect of Salience on Attitudes Toward Government . . . 98
3.3 Permutation p-values of Differences in Government Attitudes . . . . 99
A2.1 Covariate Balance (Full Attention, n=290) . . . 106
A2.2 Covariate Balance (Attention: Sandwich, n=416) . . . 107
A2.3 Covariate Balance (Attention Closest, n=554) . . . 108
A2.4 Treatment Does Not Predict Attention . . . 110
A2.5 Predictors of Attention . . . 111
A3.1 Main Results for Full Sample (Attention Interactions) . . . 113
A3.3 Robustness to Alternative DV Specifications (Full Sample) . . . 117
B2.1 Characteristics of Study Population by Sub Treatment . . . 126
B2.2 Balance: Yes Info vs. Not Interested . . . 127
B2.3 Balance: Clicking Transparency Message vs. Generic $ . . . 127
B2.4 Balance: Taking Steps Toward Claiming vs. Not . . . 128
B2.5 Balance: Treatment Survey Respondents vs. Non-Respondents . . . 128
B2.6 Treatment Survey Respondents vs. Control Survey Respondents . . . 129
B2.7 Simplified vs. Standard Survey Respondents . . . 129
B3.1 Scrolling Down to the Read the Entire Application Page . . . 130
B3.2 Time Spent on Application Page . . . 131
B3.3 Steps toward Claiming, by Invitation . . . 132
B3.4 Steps toward Claiming, by Invitation and Application Page . . . 133
B3.5 Effect of Simplified Treatment on Account Balances . . . 135
B3.6 Effect of Simplified Treatment on Account Balances (Time Windows) . . . 136
B3.7 Effect of Treatment on Account Balances (Time Windows) . . . 137
B3.8 Effect of Simplified Treatment on Electricity Bills (Time Windows) . . . 138
B3.9 Effect of Simplified Treatment on Electricity Bills (Unrestricted Sample) . . 139
B3.10 Effect of Treatment on Electricity Bills (Restricted Sample) . . . 140
B3.11 Falling into Arrears Post-Intervention . . . 142
B3.12 Satisfaction by Application Page (Full Sample) . . . 143
B3.13 Effect on Wanting Similar Information in the Future . . . 146
B3.14 Effect of Simplified Treatment on Self-Reported Claiming . . . 147
B3.15 Choosing to Self-Report Take-Up, After Experiencing an Application Page . 148 B3.16 Relationship between Claiming and Satisfaction, by Page . . . 149
C2.1 Covariate Balance: Attention 50%+ (n=659) . . . 155
C2.2 Covariate Balance: Attention 100% (n=366) . . . 156
C2.3 Attention is Not Predicted by Treatment . . . 158
C2.4 Predictors of Attentiveness . . . 159
C3.1 Perceptions of Government Efficiency (by Attention) . . . 160
C3.2 Perceptions of Government Efficiency (Alternative DV) . . . 161
C3.3 Perceptions of Government Size (by Attention) . . . 162
C3.4 Perceptions of Government Size (Alternative DV) . . . 163
C3.5 Perceptions of Government Waste (by Attention) . . . 164
C3.6 Perceptions of Government Waste (Alternative DV) . . . 165
Introduction
One of the most fundamental concepts in political philosophy, the social contract, outlines the rights and obligations of citizens. These are not abstract: they generate concrete, every-day interactions between citizens and the state, for example in the form of publicly-funded benefits and taxation. I argue that these mundane political experiences can play an impor-tant role in shaping attitudes toward government. In this dissertation, across three papers and in three countries, I examine when and how such policy experiences shape attitudes, using experimental methods grounded in a comparative approach.
Of course, these ideas are not new. Anecdotally, anybody who has visited a crowded Department of Motor Vehicles office can imagine that experiences with one agency might spill over into broader (anti-)government sentiments. Scholars have argued that policies can feed back into politics (e.g. Pierson 1993); that how citizens feel when applying for welfare can influence lessons learned about government (Soss 1999); and that many fail to appreciate government due to the invisibility of much of American social spending (Mettler 2011).
My dissertation builds on this important literature, honing in on the consequences (as opposed to the causes) of policy design. I attempt to make six novel contributions. First, I argue that taxation—in addition to spending—plays a central role in policy feedback loops. While the literature tends to focus on the design and feedback effects of social policies, taxes are the most direct example of the costs of government, and discussions about policy expan-sions, and their political feasibility, often turn on taxation. Unlike many benefit programs, the link between taxation and the government is unambiguous, facilitating the assignment of credit or blame resulting from the tax policy experience. I illustrate this by comparing the experience of filing taxes in Sweden and the US, and experimentally linking a US-style tax environment with perceptions that the government is wasteful.
Studying taxes also highlights the value of a comparative approach, my second contribu-tion. Comparisons of social spending programs across countries can be tricky—for example, ‘health care’ encompasses vastly different programs in different countries. But the concept of taxation is more universal, making for interesting and sometimes counterintuitive results. The fact that people in Sweden dislike taxes far less than Americans—despite the conven-tional wisdom that higher taxes hurt more—suggests that factors beyond ‘macro design’
features (such as tax rates), matter for attitudes. The “Feeling Taxed?” paper showcases that the implementation of taxation can be designed very differently, and that seemingly mundane design factors can be easy to overlook when countries are considered in isolation. For example, while most Americana dread “Tax Day” as the day federal income tax returns must be filed, most Swedes look forward to it as the day you get your tax refund. This points to the power of ‘micro design’ factors—here the simple timing and coordination of filing and refund dates—for shaping perceptions.
Of course, design features are just one part of a complex political ecosystem, with many factors that likely contribute to, and are affected by, attitudes toward government. How can we isolate the effect of policy design factors? My third contribution is to deploy an experimental approach, both in survey settings and in the field, to causally identify the effect of the policy experience. In the “Benefits of Design” paper, I actually change a real-world policy experience: in partnership with a bank, I simplify the process of claiming a means-tested benefit in Australia and increase both take-up of the benefit, and satisfaction with the government. This highlights the usefulness of experiments, which allow me to hold constant common confounders: citizens’ prior views, such as baseline satisfaction with the government; policy content, such as eligibility and benefit amount; and country context, such as how much public spending you get in return for your taxes.
Fourth, my work raises intriguing new questions around the role that private actors can play in policy feedback loops. The field experiment provides evidence of one instance where a company, a bank, uses its influence to reach into people’s lives—in order to reduce frictions embedded in citizen-state interactions. I show that this is not just advantageous for the bank and its customers, but also consequential for attitudes toward government: my field experiment increased satisfaction with both the bank and the government, suggesting for-profit institutions can play an intermediary role that is less antagonistic to government than is commonly expected. This contrasts with a great deal of prior research showing that when third parties serve as intermediaries between citizens and the state, they obscure the role of government, and the benefits it provides.
Fifth, in the paper “Credit Where Due? Theory and Evidence”, I experimentally confirm prior work suggesting that the design choice to channel benefits through the tax code can result in government not getting credit where due (Mettler 2011). I then integrate this finding along with the ones above into a theoretical framework that aims to explain when and how different design factors are likely to affect attitudes toward government.
Sixth, I also argue that decomposing the concept of policy design into macro and micro design factors that affect the policy experience is useful, both because it sheds light on the types of actors likely to play a role, and because it underscores that when studying policy
feedback, it is fruitful to pay attention not just to “who gets what” but also “when and how”. Finally, I hope my dissertation illustrates the value of bridging scholarship from several fields—political science, of course, but also public policy, public administration, political be-havior and bebe-havioral economics—for understanding how citizens form views of government.
Figure 1: Policy Design Feedback Loop
Paper 1: Feeling Taxed? Comparative Tax Experiences
and Policy Feedback in the US and Sweden
Taxation is the most obvious example of the cost of government, and it generates interactions between citizens and the state. I examine the attitudinal effects of one such interaction, by comparing the experience of filing income taxes in the US and Sweden. Drawing on internet search and newspaper headline data, I show that specific features of tax policy design focus citizens’ attention in very different ways: on tax compliance and payment in the US, on tax refunds in Sweden. I use those findings to examine potential consequences of such design factors for political attitudes. Via a nationally-representative survey experiment, I find that priming people to think about a US–style tax environment increases Americans’ perceptions that the government is wasteful. I discuss the importance of such policy feedback for future
rounds of politics. Even when policy content cannot be changed, redesigning how citizens experience policies could help counter the growing distrust of political institutions.
Paper 2: Benefits of Design: A Field Experiment on the
Effects of Shifting Burden from Citizens to a Bank
In a large-scale randomized experiment, I examine how citizens’ views of government are shaped by their experiences with policy. Specifically, I use the data infrastructure and mobile platform of a large Australian bank to test the effects of simplifying the claiming of a means-tested government benefit, among 195,414 low-income customers. I find that shifting administrative burden away from citizens in this way is highly cost-effective and increases reported satisfaction with both the bank and government (45.5 and 44.4 percent, respectively). This is true even though take-up effects are modest (2.1 percent relative increase), as ascertained by examining bank transactions and linkages to government benefits data. I conclude that redesigning how citizens experience policies can reshape attitudes toward government, likely over and above material gains. The experiment also illustrates the role that private institutions can play in such policy feedback loops. More broadly, these results suggest that, in addition to studying how policy content affects opinions—“who gets what”—the “when” and especially “how” citizens experience policies can help us understand attitudes underpinning democracy.
Paper 3: Credit Where Due? Theory and Evidence: Design of
Policy Experiences Shapes Attitudes Toward Government
The modern social contract generates myriad interactions between citizens and the state. I develop a theory to explain when and how such policy experiences shape views of government. First, I propose that two dimensions affect attribution of credit for policies: the valence of the experience, and the salience of the government’s role. Second, I outline how design shapes the policy experience. I consider both traditional design factors—the defining aspects of policies that shape “who gets what”, which I term ‘macro design’—and factors that have received less attention in the literature and often shape “when and how”, which I term ‘micro design’. Third, using experimental evidence from three sources, I illustrate how design of policy experiences affects attitudes toward government. I integrate findings from two recent experiments and present results from a new nationally-representative survey experiment on salience, examining the claim that ‘macro design’ choices to channel benefits through the tax code result in government not getting credit where due. I find that a simple prime
drawing attention to the government’s role financing four common, positively valenced tax expenditures, improves evaluations of government. Taken together, the experiments produce evidence that design helps shape how citizens view government in their everyday lives.
Institutional Review Board Approvals
For Paper 1, IRB Approval was obtained from the MIT Committee on the Use of Humans as Experimental Subjects (COUHES) on 03/23/2016, Protocol #1603502850. For Paper 2, IRB Approval was obtained from the Harvard University-Area Committee on the Use of Human Subjects on 04/16/2018: IRB18-0546. For Paper 3, IRB Approval was obtained from MIT COUHES (see above) on 05/01/2018, Protocol #1804343450.
Acknowledgement of Financial Support
I am grateful to the Minda de Gunzburg Center for European Studies at Harvard University, for the Krupp Foundation Fellowship; the Sweden-America Foundation, for Prince Bertil’s Prize; Adam Berinsky and the MIT Political Experiments Research Lab, for inclusion on sur-veys; and the Harvard University Sustainability, Transparency, and Accountability Research (STAR) Lab, for support in Australia.
Field Experiment Partnerships and Collaborations
I gratefully acknowledge and thank the phenomenal team at the Commonwealth Bank of Australia for their partnership in designing and executing this field experiment, including Alex Perry, Anika Patel, Ashley Tucker, Ben Grauer, Bruno Rotunno, Chris Hill, Emily Daniels, Fred Tran, Grant Burrow, Gulley Shimeld, Jackson Davey, Jessica Gleeson, Madhu Somineni, Matt Comyn, Melissa Claire, Mohamed Khalil, Nathan Damaj, Nikhil Ravichan-dar, Pete Steel, Rafael Batista, Stephen Bush, Sylvia Sara, and Will Mailer. I also thank Bekzod Abdullaev, Neena Narayanan, and Rizwan Bashir at the NSW Department of Plan-ning, Industry, and Environment, for matching and sharing data. Thank you to Alexandra Geddes, Filiz Ketenci, Shabana Ali and Vineet Gounder at Service NSW; Catherine Nehring and Ryan Davis of the Harvard STAR Lab; and Ciara Sterling and Gabby Sundstrom at the Thriving Communities Partnership. Finally, I am indebted to Michael Hiscox, who directs the Harvard STAR Lab, whose support has been crucial to this project.
Feeling Taxed?
Comparative Tax Experiences and
Policy Feedback in the US and Sweden
1.1
Introduction
The most commonly-used tax form in the United States, Form 1040, comes with 233 pages of instructions (Internal Revenue Service 2019; hereafter IRS). Simply following these in-structions is so difficult that over 94 percent of American filers pay a professional or use commercial software to help prepare their tax returns; on average people spend about 13 hours—and pay around $200—preparing their 1040s every year (Brady 2016; IRS 2016). Meanwhile, in most other developed countries, filing your taxes is relatively painless (Reid 2017). In Sweden, 80 percent of taxpayers file their tax returns in a matter of minutes, free of charge, using only their cell phones (Steinmo 2010; The Swedish Tax Agency).
There are many explanations for how the US tax filing process became so complex.1 Here,
I will focus not on adjudicating between explanations for how we got here, but rather on what this implies for politics going forward. Focusing not on the causes but the consequences of current tax policy design, I ask how the experience of paying taxes shapes political attitudes. This specific question is an attempt to shed light on a broader one, namely how policy design—here defined as the set of choices that shape how a policy ultimately looks and feels to people interacting with it—affects perceptions of governance. I view policy design as not just a result of politics but a political force in its own right; it shapes citizens’ experiences with a particular policy and contributes to policy feedback loops that can influence how people view government as a whole (Schneider and Ingram 1993; Pierson 1993; Soss 1999).
I make three contributions. First, whereas most prior studies focus on the experience of
1The particularities of American politics mean that many initiatives are passed as tax credits, creating
a byzantine, hard to navigate tax code; special interests, such as tax-preparers, lobby to oppose letting the government offer free simplified filing or pre-filled returns (Day 2013); and conservative politicians block attempts to simplify tax-paying in order to keep taxation visible.
receiving benefits from the government (for a review, see Jacobs and Mettler 2018), I study the experience of paying for government—taxes. Unlike many benefit programs, the link between taxation and the government is unambiguous, facilitating the assignment of praise or blame resulting from the tax policy experience.
Studying taxes also allows me to draw on a comparative approach, my second contribu-tion. Comparisons of social spending programs across countries can be tricky—for example, ‘health care’ encompasses vastly different programs in different countries.2 But the
con-cept of taxation is more universal, making for interesting and sometimes counterintuitive results. The fact that people in Sweden dislike taxes far less than Americans—despite the conventional wisdom that higher taxes hurt more—helps highlight that factors beyond tax rates matter for attitudes. And while every American dreads “Tax Day” as the day federal income tax returns must be filed, most Swedes look forward to it as the day you get your tax refund—showing how policy design choices might shape perceptions. These factors can be overlooked when countries are considered in isolation.
Of course, these design factors are just one part of a complex political ecosystem, with many factors that likely contribute to and are affected by perceptions of governance.3 How
can we isolate the effect of policy design factors? My third contribution is to use an exper-imental approach to causally identify the effect of the policy experience, holding constant common confounders: prior views, such as baseline dislike of taxes and the government; pol-icy content, such as tax rates; and country context, such as how much public spending you get in return for your taxes. This leads me to conclude that design, by virtue of shaping how we interface with the state, and affecting which of a policy’s many aspects we pay attention to, should also be front and center when we think about how citizens evaluate government. I present my argument in four analytical steps. First, I examine which elements of tax policy design citizens focus on, comparing Sweden and the US, two paradigmatic cases in the advanced industrialized world (e.g. Esping-Andersen 1990). I use Google search data as one empirical indicator of attention. As predicted, search intensity by date suggests citizens focus on receiving refunds in Sweden, and filing tax forms in the US.
Second, to probe the valence of that attention, I perform quantitative text analysis of news coverage of taxes. Results in Sweden confirm trends from internet search—headlines are 8 times as likely to mention refunds rather than filing—and allow me to quantify the valence. The most common headline words include: ‘million’; ‘receive’; ‘midsummer’; ‘share’;
2This follows Locke and Thelen’s (1995) advice to not assign analytical equivalence to processes with
different meaning within different contexts.
3I use this to mean not just the values citizens place on specific policies, or their preferred party platform,
but also whether government seems valuable and how much. These are shaped by many factors: government performance, ideology, self-interest, socialization, and elite rhetoric (for a recent review see Mettler 2018).
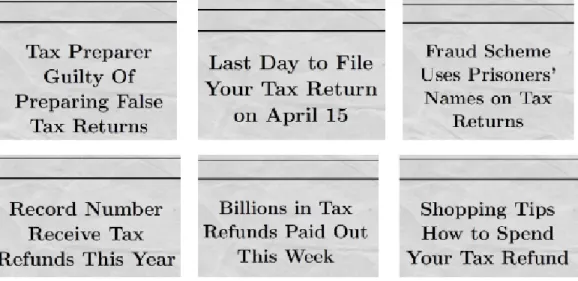
‘celebrate’; ‘day’; ‘file’; ‘chat’; ‘electronic’; and ‘phone’, indicating that coverage focuses on the benefits of the refund, including more money to spend, just in time for summer vacation. In the US, the opposite holds: again, more news attention is devoted to the filing process— about double—and the valence is quite different. The most common words include: ‘prepare’; ‘false’; ‘file’; ‘guilty’; ‘court’; ‘fraud’; ‘identity’; ‘sentence’; ‘prison’; and ‘stolen’, indicating that most coverage is focused on compliance and fraud.
Third, to rigorously test the hypothesis that these tax policy experiences can affect subse-quent attitudes, I conduct an online survey experiment on a nationally-representative sample of close to 1,000 Americans. Using findings from the search and text analyses to design an experimental priming stimulus, I find that manipulating the visibility of different elements of tax policy design can produce measurable changes in attitudes toward government within a country. Being randomly assigned to a ‘US-style’ prime focused on compliance makes a fully attentive respondent 16 percent more likely to perceive government as wasteful, compared to an equivalent sample of Americans assigned to a ‘Swedish-style’ design. This result is not necessarily intuitive: reminding people of compliance could just as easily have inspired confidence in the state’s capacity to protect program integrity and public funds (Sunstein 2018a). Instead, salient tax compliance burdens generate views of government inefficiency.
Fourth, I discuss the importance of policy design for politics, with particular focus on the feedback loops that shape future rounds of politics. The attitudinal effects I find are measured in the short-term, and in the laboratory setting. But if similar policy design factors operate cumulatively, shaping experiences in millions of daily interactions over time, they could have a large total effect on citizens’ views of the costs of governance. These beliefs, for example about the wastefulness of government—partly caused by current policy design and the resulting citizen experiences—could undermine efforts to give government agencies the very resources they need to mitigate problems underlying the poor policy experiences.
Finally, I note that in contrast to trying to change factors like ideology, self-interest or policy content, design changes that alter the policy experience are often more feasible.4 Policy redesign may thus be an important lever to build support for governance—even when policy content cannot be changed—and counter growing distrust of political institutions.
4As evidenced by policymakers who already prefer to affect policy by means outside the legislature:
many use the lack of oversight of the implementation process to create what Herd and Moynihan (2018) call administrative burdens, which effectively limit participation or otherwise negatively affect users. The same strategies could be used in reverse, to create more positive policy experiences.
1.2
Policy Design as a Political Force
In contrast to most of history, when personal contact with the government was rare (Kumlin 2004), the modern social contract creates many direct interfaces between citizens and the state. The rights and obligations inherent in the social contract take the form of govern-ment spending and taxation: citizens enjoy the fruits of public spending, and in return, are expected to pay their fair share of taxes. Research suggests that the nature of these interactions matters.
1.2.1
Spending Policy Design Shapes Citizens
On the spending side of the social contract, evidence on policy feedback suggests that the design of programs can shape citizens’ views of democracy and their own role in it. We know that the resources social policies offer can affect people’s capacity to participate in politics, as well as their level of interest in doing so (Pierson 1993; Campbell 2003). But beyond resources, the very messages conveyed by social policy design and delivery might influence political efficacy (Schneider and Ingram 1993; Soss 1999; Mettler 2005). Joe Soss argues that as clients participate in welfare programs they learn lessons about “how citi-zens and governments relate”, which then become “the basis for broader orientations toward government and political action” (Soss 1999, 364). Suzanne Mettler’s examination of the indirect features of much of American social spending highlights how spending policy de-sign characteristics—especially those that make the link between the state and a program salient—matter for whether the government gets due credit for its activities (2011). Sven Steinmo theorizes that not only what the state actually does, but how it does it, affects citizens’ perceptions of what their state ought to do (2010). In sum, research suggests that spending policy design can affect how individuals experience not just the program at hand but government as a whole (Schneider and Ingram 1993; Soss 1999).
By shaping citizens’ encounters with government, the design of public policy is thought to constitute an important force shaping citizens’ orientations toward government. But several aspects of how policy design interacts with citizens’ views of government remain under-explored. In the field of mass political behavior, scholars have acquired much more insight into the possible ways public opinion can affect policies than the reverse (for a review, see Mettler and Soss 2004). Existing literature does a thorough job explaining how political rules and preexisting policies can shape the preferences and actions of public officials and specific interest groups (e.g., Campbell 2003), but we know much less about how the nature of existing policies influence political thought in the wider citizenry.
1.2.2
Taxation Policy Design Merits Attention
The web of theories on how spending policy design might influence citizens stands in stark contrast to the clear conventional wisdom that Americans simply hate taxes (Campbell 2009). Whereas public opinion scholarship has given us reason to believe that there is much more nuance to Americans’ relationship with taxation than a generalized dislike (e.g. Steinmo 1989; Campbell 2009; Williamson 2017), the mechanisms by which ordinary citizens arrive at their opinions about taxes have not been fully explored. Political scientists have produced a rich literature on government spending, but the flip-side of revenue collection has received less consideration than it merits. To the extent that welfare state scholars have taken an interest in taxation policy, it has traditionally been largely as a means to an end. Either a tax structure has been deemed relevant because it is a result of interesting political coalitions, or because it supports social spending. In other words, one possible explanation for why taxation design has received less scholarly attention is simply that it does not matter very much: conditional on knowing how much a country spends on social welfare, knowing the details of how it collects the revenue it spends appears uninteresting.
To the contrary, I argue that tax policy is important in its own right, independently of its effects on spending and redistribution. If we follow the convention of welfare state research, and measure an activity’s importance by the simple volume of cash transferred between state and society, collecting taxes is as large an undertaking as public spending. And while spending is often mediated by third parties (Morgan and Campbell 2011), taxation is one of the most direct links between citizens and the state (Martin et al. 2009).
Nonetheless, with few exceptions (e.g. Steinmo 2013; 2018), most political science anal-yses of taxation do not tell us much about how individuals experience being taxed, or how citizens perceive their fiscal regime. Scholars have paid close attention to the relative pro-gressiveness of tax regimes (Steinmo 1989; Beramendi and Rueda 2007; Lupu and Pontusson 2011) and examined its effects on redistribution (Iversen and Soskice 2006; Pontusson 2013). But it is not clear, for instance, that ordinary citizens accurately perceive those aspects of the tax regime that are often of great concern to political scientists, such as whether their overarching tax system is regressive or progressive.
Historically, political economists often argued that the design of tax policy mattered for people’s perceptions of state activity (e.g., Mill 1840; McCulloch 1845; Buchanan 1967). Ronald Reagan famously exclaimed that ‘taxes should hurt’, to prevent government from growing without citizens noticing. More recently, economists have presented evidence that people do pay more attention to salient acts of taxation (Finkelstein 2009), and that these can result in psychological discontent (Bird 2009) and more tax revolts (Cabral and Hoxby
2012). The fact that these results were driven by the salience of the studied tax—not the size of the amounts people were taxed, which were similar—suggests that citizens’ perceptions of costs and benefits do not simply correspond to actual costs and benefits.
1.2.3
Perceptions and Salience
So, beyond actual costs and benefits, what might help shape perceptions of government? We know that humans fall victim to systematic misperceptions (Kahneman and Tversky 1979) , and research in cognitive psychology has shown that two quantitatively equivalent amounts do not always appear the same to humans. In our minds, certain things appear more readily than others; they are more salient. Salience refers broadly to visibility, but also denotes attention-grabbing and the degree to which something stands out relative to its neighbors. In short, the salience bias makes us more likely to focus on striking things (Kahneman et al. 1982; Bordalo et al. 2012), and these can then assume an out-sized importance for attitudes or behavior (Congdon et al. 2009).
Of course, it is not news in politics that attention matters, or that people are more likely to focus on saleint information. For example, individuals rely on informational shortcuts when voting (Lupia Lupia), and salient elite cues matter for a variety of outcomes (see Gilens and Murakawa 2002 for a review). But political scientists rarely view policy design through the lens of salience. If they do, it tends to be in relation to spending, such as whether design draws attention to the government’s role in providing a social policy (Mettler 2011). Evidence from public finance suggests that policy design can affect the salience of the very act of taxation, and that this salience matters for political outcomes. Finkelstein (2009) has studied road tolls to make inferences about consumption tax design. Likening automated toll collection to a less salient value-added tax (VAT), and manual tolls to a US–style sales tax, she finds that individuals pay less attention to automated tolls. When tolls are collected automatically, it is harder for drivers to identify how much they just paid, toll rates increase over time, and these rate hikes are not sensitive to the political electoral calendar (Finkelstein 2009). In a similar vein, Cabral and Hoxby (2012) have shown that areas where property taxes are paid by tax escrow—representing a less salient way of collecting taxes—are areas in which tax revolts are less likely to occur.
Some US policymakers share the intuition that tax salience is important, and have inten-tionally blocked all attempts at transforming the sales tax into a VAT.5 In Canada, surveys
indicate that a move to tax-exclusive pricing—a more visible form of consumption taxa-tion—reminded people of taxes at each purchase, and 75 percent preferred to have the tax
5For instance, the President’s Advisory Panel on Federal Tax Reform did not support a VAT, citing
included in the posted price instead (Bird 2009). Similarly, in Japan, firms could once opt for either tax-inclusive or tax-exclusive consumption pricing. At first, up to 80 percent of sellers quoted the tax separately, like a US sales tax. Subsequently, however, many firms shifted to tax-inclusive pricing, because consumers preferred “to pay the tax without noticing the tax burden”, and the government eventually followed suit (Ishi 2001, 291).
Taken together, this empirical evidence supports the intuition that there are more and less visible ways of taxing people, and that this choice has potential consequences such as political discontent. The existing literature suggests that different ways of designing policies that are nominally or fiscally the same can affect how they are perceived.
The sections that follow explore whether income taxation in Sweden and the US interacts with the saliency bias to shape perceptions of governance. Specifically, I examine how policy design creates an experience that makes certain features of government activity salient—such as compliance costs of filing tax forms—while downplaying others—such as the refund pay-out. I focus on current tax policies and their effects, rather than initial intent. As Hall and Thelen have noted, the current effects of an institution help explain contemporary support for it, whereas those effects can only rarely explain its origins (2009, 10).
1.3
Comparing Sweden and the United States
1.3.1
Perceptions of the Proper Role of Government
“The welfare of the state is my welfare” - Adolf Fredrik, King of Sweden 1751–1771
“The happiness of society is the end of government” - John Adams, US President 1797–1801
To many Swedes, it may be surprising that the US has political leaders who want to reduce the role of government. To many Americans, it may seem peculiar that Swedish politicians can run on a platform of increasing taxes, and actually win. In the 2014 election, even the most conservative Swedish party ran on a platform of raising taxes substantially.6
Trust in government, long held as an important indicator of attitudes toward government, has been consistently lower in the US (35 percent) than in Sweden (65 percent) (OECD 2014). In the US, both prominent politicians—such as Gerald Ford, who exclaimed that “a government big enough to give you everything you want is a government big enough to take from you everything you have”—as well as scholars (e.g., de Tocqueville 1889; Hartz
6The four-party conservative alliance, Alliansen, proposed a tax increase of 10 billion SEK, while the
Social Democratic proposal included a total rax raise of 39 billion SEK ($1.18 billion and $4.6 billion respectively, at a conversion rate of 8.5 SEK per USD.) (Dagens Nyheter 2014).
1955; Vogel 1983) have given voice to the anti-statist flavor of the American political culture. According to Gallup, 69 percent of Americans consider ‘big government’ the biggest threat to their country, way ahead of both ‘big business’ (25 percent) and ‘big labor’ (6 percent).7 In
Sweden, to the best of my knowledge, no such question exists on recurring national surveys. In fact, the expression “government intervention”, often used to invoke images of an American government that interferes where it is not wanted, cannot be readily translated into Swedish. On the contrary, large sections of the entire Swedish political spectrum tend to openly turn to the government for solutions to important societal problems (Steinmo 1996). As opposed to an uninvited intervener, the Swedish state is often portrayed as a helper, providing positively connoted ‘government support’. Survey evidence suggests that the ma-jority of Swedish people do not oppose paying high taxes to fund such government activity: the willingness to pay—not just to pay taxes in general but to pay more in taxes—has been increasing slightly over time (Svallfors 2013).
How can we make sense of these very different ideas about the proper role of the gov-ernment in Sweden and the US? Where do such preferences for big versus small govgov-ernment come from? One common explanation is culture—perhaps Swedes and Americans are just different. Another explanation is institutions. For instance, Steinmo has argued that whereas “Americans may well be the most anti-state citizens in the modern world - [this] has less to do with the character of the citizens, than it has to do with the character of the state” (1996, 328). However, neither of these explanations get to the heart of the point of interest. Culture has to be learned and sustained. This means that if we believe culture plays a role in shaping ideas, then the relevant puzzle to grapple with is how these ideas about the proper role of government get reproduced over time—through culture or otherwise. On institutions, which ones matter and what do they look like in the everyday lives of citizens?
1.3.2
Taxation
I focus on taxation, as a direct link between citizens and the state, and a manifestation of the costs of government. Before examining the effects of current income tax policy designs in Sweden and the US, I briefly outline the general tax climates.
In designing tax systems, governments make choices about the category of revenue collec-tion—such as whether the tax falls on income, consumption, or property—the progressivity of tax rates within those categories, and the overall level of revenue to be collected across the economy. For Sweden and the US respectively, Table 1.1 lists each tax category as a proportion of 1) total revenue collected, and 2) GDP (OECD 2014). Whereas the US gets
about half of its total revenue from taxes on income and profits, Sweden only relies on those taxes for about a third of its revenue, closely followed by consumption taxes.
Table 1.1: Tax Categories, Sweden vs. US
Sweden United States
% of Total Rev. % of GDP % of Total Rev. % of GDP
Income & Profits 35 14.8 48 12.5
Consumption 28 12.1 17 4.5
Property 3 1.1 11 2.8
Social Security 23 9.9 24 6.2
Payroll Taxes 11 4.6 0 0
All Tax Revenues 42.5 26
Tax Categories as Proportion of GDP and Total Tax Revenues. Data from OECD Revenue Statistics 2014
But even though the US relies more heavily than Sweden on income taxes, that does not mean the average American person pays more in income taxes than its Swedish counterpart. As the last line of Table 1.1 demonstrates, the US collects less tax revenue in proportion to GDP than Sweden, which collects a higher tax take (50-year average of 42 percent of GDP) than both the US (25 percent) and the OECD average (31 percent) (OECD 2015). Overall, cross-country comparisons of tax categories or revenue levels do not reveal very much about how these taxes are experienced by individuals. Moreover, such data do not show us the heterogeneity in policy design within these categories. Within any single tax category, such as income, the design of tax collection can vary across countries, and in notable ways.
We know that on average, Swedish citizens get taxed at high rates, and tend to trust
Skatteverket, the Swedish Tax Agency (STA). Americans pay less in absolute taxes, and tend
to distrust their federal tax agency, the IRS. According to a 2015 poll, only 31 percent trusted the IRS, 19 percent were not sure and 50 percent did not trust the IRS to fairly enforce tax laws (Rasmussen Reports 2015). In a Pew Reserch poll, 48 percent of Americans rated the IRS unfavorably (Motel 2015). In contrast, a Swedish poll found that only 9 percent had no confidence in the way the STA was carrying out its duties, while 25 percent were neutral and 66 percent of trusted the agency (Skatteverket 2013: 92). These polls suggest something about how Americans and Swedes experience tax collection. Could the way similar policies in these countries draw attention to different aspects of tax-paying account for any part of the trust divergence?
1.4
Evidence on the Salience of Taxation
1.4.1
Filing Taxes: Swedish Simplicity, American Complexity
Some categories of taxation are generally more salient than others. Andrea Campbell has noted that in the US, “the adoption of the highly visible and far-reaching progressive income tax as the main source of federal government revenues, rather than a less visible national consumption tax [...] set the stage for a highly contested politics of taxation” (2009, 49). But a comparative approach gives us reason to believe that income taxation itself can be made more or less visible.
For initial income tax payments, Sweden and the US have similar instruments, such as automatic third-party withholding by employers. But what about the experience of settling taxes each year—that is, making sure you and the government are even, by filing a tax return and receiving (or paying) any refund owed? How might the design of these processes make certain aspects of taxation visible while leaving others in the background?
Let us start with some basic differences between the Swedish and American systems. Despite the heavy overall tax burden of the Swedish tax system, it is characterized by remarkable simplicity (Steinmo 2010). After a concerted effort of simplification, the current system is so straightforward and simple that at least 80 percent of taxpayers file their income tax returns using only their cell phones (Skatteverket 2015).
All Swedish residents earning an income, including pensions, have to file a yearly tax return (‘inkomstdeklaration’ ). The STA provides all individual taxpayers with pre-populated tax return forms. This means that the forms have already been filled out based on income statements from third parties such as employers, banks, and other financial institutions that report to the STA (Skatteverket 2015). These pre-populated tax return forms are sent out via email, text message and regular mail to taxpayers each spring. Because a preliminary tax has already been calculated, the forms practically serve to inform people how much they owe in taxes or are due in refunds. Taxpayers can then confirm or change the information via any of the same mediums of communication. That response, in turn, counts as filing the tax return, and as noted, the most common Swedish way of doing so is using a cell phone.
Few Swedes know exactly when the filing deadline is (May 4 in 2015); they simply file when they receive their forms. In contrast, 80 percent of all tax refunds are paid out in June, right before the popular Swedish Midsummer holiday. This “Refund Day” payout is both well-known and highly anticipated (Skatteverket 2015).
Table 1.2: Tax Season Timelines 2015
Sweden: United States:
March 16 : Pre-filled forms sent out Start of year : W-2s etc. sent out
March 19 : Electronic filing opens Jan 20 : Filing opens
May 4 : Filing deadline April 15 : ‘Tax Day’, filing deadline
June 9 : ‘Refund Day’, 80% paid out Jan 30 onwards: Refunds paid out
Aug 5 : Second round of refunds Dec 9 : Last round direct deposits
Data from Skatteverket (2016) and IRS (2016).
We can compare the Swedish system to the American tax administration, which pays out refunds on a more diffused, rolling-basis, between January 30 and the end of the year. There is, however, a well-known “Tax (Filing) Day”, typically April 15,8 when individual income tax return forms are due to the federal government.
In contrast to the nearly automated manner in which most Swedes file their tax returns, the American system has been called “one of the most complex and weak tax systems in the world” (Steinmo 1995: 307). While the Swedish tax code has been periodically reformed to make it more simple to both administer and use, the American tax code has displayed increasing complexity. This complexity, measured by sheer length of the American tax code, has increased over time, currently numbering more than 74,000 pages (Russell 2016).
Complex tax codes are both more costly for authorities to administer and harder for people to comply with (Congdon et al. 2009). The US government requires that individuals are first sent the relevant documentation—such as W-2s, 1099s—in order to even try to file their tax returns. The process of filling out the paperwork can be very cumbersome: in 2013, over 94 percent of filers paid a professional or used software to help prepare their tax returns (The National Taxpayer Advocate 2014, 104). In contrast, Swedish survey data paint a reverse picture: 89 percent of Swedes consider it “easy” to file their tax returns (Skatteverket 2013).
For every dollar of revenue raised by the American federal income tax system, taxpayers incur about ten cents in private compliance costs associated with record-keeping and tax filing (Slemrod 1996). Yet policies that would reduce these costs are frequently opposed by policymakers who believe that compliance costs play an important role in keeping taxes visible and salient to the electorate (Finkelstein 2009), as well as by concentrated vested interests such as the tax-preparer industry, which benefits financially from the complexity of the tax code (e.g. Serino (2013), for Sunlight Foundation). This lends further support
8As noted by The Library of Congress, April 15 has been the filing deadline since 1955 (Terrell 2012).
to the claim that for many Americans, the process of filing tax returns is at once salient, time-consuming and at least somewhat cumbersome.
1.4.2
Salience of Tax Filing vs. Getting Refunds
Another way of assessing tax salience is by looking at the instances when taxation seems to grab attention in a given country, and what type of attention. Even if the conventional wisdom that nobody likes paying taxes were true, some policy designs may remind people of that more often. Conversely, some designs may highlight potentially positive aspects more, such as 1) the public goods and spending society affords as a result of those taxes; and 2) any tax refund received. I will focus on the latter, since my concern is explaining experiences of taxation rather than the spending it supports. .
Of course, at close scrutiny, any tax refund the state owes you means you just lent the government money interest-free for a year, which sounds like a bad deal. But, we also know from a range of studies that in reality, people respond positively to things that look like rewards, and tend to consider any tax refund a bonus—a positive occurrence that they do not wish to trade for lower initial tax-withholding (Epley et al. 2006; Congdon et al. 2009). With income taxation, most or all taxes are automatically withheld, but each taxpayer still has to file their federal tax return every year (with the exception of Americans with incomes below certain thresholds). And tax-filers of both the US and Sweden tend to get a tax refund. Over two thirds of American tax-filers get money back in a given year (72 percent in 2015), with an average tax refund of $2,957 (IRS 2016). Similarly, around two thirds of all Swedish tax-filers get a refund (Eriksson 2011), but the average amount is lower at around $700.9 A similar proportion of taxpayers in both countries file tax returns and get
refunds every year, and of noteworthy amounts.
Do the income tax processes in Sweden and the US, by virtue of their different designs, nonetheless contribute to making very different features of taxation salient to citizens? To shed light on this question, I start by analyzing the relative salience of tax filing and refunds. In the absence of surveys, online search data can help give a sense of what citizens are interested in or concerned with (Stephens-Davidowitz 2014). Google Trends data allow us to compare the volume of different search terms, by indicating how often a particular search-term is entered relative to the total search-volume at any given point in time.10
Figures 1.1 and 1.2 show the relative popularity of searches for the terms “tax return”
9About 6,000 SEK, at a conversion rate of 8.5 SEK per USD, on December 20, 2015 (Skatteverket 2016). 10Google Trends—based on the world’s largest search engine—adjusts search data to make comparisons
between terms easier. To compare relative popularity, each data point is divided by total searches within the geographic area and time range it represents. Numbers are then scaled to a range of 0–100.
(dark grey) and “tax refund” (light grey) within the US and Sweden over the course of a year.11 The horizontal axes represent time, starting from Jan 1, 2015, and the vertical axes
indicate how often a term is searched for—relative to the total number of searches for a given location.12 The results are similar for closely related search terms, as well as word stems,
conjugations, and slightly different translations of the English search terms into Swedish. The main quantity of interest in each figure is the comparison between the two curves: the relative salience of the terms “tax return” and “tax refund” within each country. Looking first at the Swedish pattern in Figure 1.1, searches for “tax refund” are more frequent than searches for “tax return” at all points during the year. Moreover, spikes in interest correspond well with actual salient tax filing events (previously outlined in Table 1.2). For example, searches for “tax refund” spike around the dates when tax return forms are sent out (March 16) and electronic tax filing opens (March 19). There is also a small spike in “tax return” searches during that time, but the search volume compared to “tax refund” searches is much lower. This makes sense in light of the fact that even though tax return forms are sent out during this period, they essentially serve as a confirmation of how much two thirds of the taxpaying public will eventually receive in refunds. Around June 9–12, when 80 percent of those refunds are paid out, the “tax refund” search curve spikes again.
Overall, the results in Figure 1.1 suggest that when Swedish tax return forms are sent out, and filed, the focus is actually on the refund. Tax return forms serve mostly as a notice of how much you owe or are owed, and little time is spent on the filing process. In addition, refunds are paid out during a different period than when forms are filed, so that there is little overlap; tax refund payouts seem to enjoy periods of exclusive attention.
11In Swedish: “inkomstdeklaration” and “skatteåterbäring”.
12The figures plot the data for 2015, but the patterns of relative salience of search terms over the cycle
Figure 1.1: Relative Frequency of Search Terms (Sweden, 2015)
In Figure 1.2, a different pattern emerges for the US. Like for Sweden, spikes in relative popularity can be traced back to actual events. Around April 15, searches for “tax return” peak. According to the IRS, 41 percent of people file their tax return in the last weeks leading up to this ‘Tax Day’. There is a relatively smaller spike in “tax refund” searches during the same period. When tax return filing opens, on Jan 20, searches for both “tax refund” and “tax return” spike. In contrast to Sweden, in the US there is overlap between the ongoing filing process and refund payout (see Table 1.2). The IRS reports that 49 percent of tax refunds are paid out between Jan 30–March 6, explaining the concurrent high popularity of both “tax return” and “tax refund” searches. However, the remaining 51 percent of refunds are paid out between March 7–Dec 25, but during this time there is little search attention granted to refunds—in fact, even less so than to return-filing searches. There are no independent spikes in attention for refunds, suggesting refunds are only salient in conjunction with return filing.
Taken together, the Google search trends presented in Figures 1.1 and 1.2 suggest that the relative salience of tax refunds is higher in Sweden, whereas relatively more attention is paid to the tax return filing process in the US. This in spite of the fact that Swedes pay more in income taxes while Americans on average get bigger refunds.
1.4.3
Tax Rhetoric and Media Salience
The results above provide preliminary evidence for the hypothesis that the design of tax settling processes in Sweden and the US result in very different features of income taxation being salient to citizens. But the search volumes give no clues regarding the valence of the attention—whether it is positive or negative—or if the attention of people who use online search tools can tell us anything meaningful about the views of society at large. In order to examine what the valence of this attention is, I examine news media coverage of tax season in Sweden and the US. I focus on articles about getting tax refunds or filing tax returns, defined as those with headlines containing the words “tax” and “refund”, or “tax”
and “return”, as well as any conjugations or plural forms of those words.13 I then hone in on
the full headlines of these articles, since these are the most attention-grabbing and salient features of an article.
Table 1.3 shows descriptive statistics of the news sample. For the US, I used the Lexis-Nexis database to obtain a total of 1,073 articles from 2015. For Sweden, I used the equivalent database, Retriever, to obtain a sample of 103 articles from 2015. The lower volume likely reflects the smaller size of the Swedish news industry and population it serves.
13The Swedish sample was obtained by searching for headlines containing “inkomstdeklaration”, “skatt”,
Table 1.3: Descriptive Statistics of News Article Sample
Sweden: United States:
News Database Retriever LexisNexis
Years Searched 2015 2015
Headlines on Refunds 92 383
Headlines on Filing 11 690
Ratio (Refund/Filing) 8.36 0.56
At first glance, the ratios between refund and filing headlines confirm the results above, namely that refunds are the subject of more (media) attention in Sweden (refund/filing = 8.36) whereas filing articles are more salient in the US (refund/filing = 0.56). I then analyze these headlines using the natural language processing technique of ‘bag-of-words’: a simplifying representation of text, which allows me to count the number of times every unique word occurs in a document. Tables 1.4 and 1.5 display the most common words in refund and filing headlines, respectively, standardized to frequency per headline, in descending order.14
As is standard in text analysis, I use an algorithm to reduce each word to its stem, since words with the same root form are most often synonymous (Stephens-Davidowitz 2014). Sim-ilarly, I exclude stop words—e.g. articles, prepositions, pronouns and conjunctions—since they add little substantive value in this context. For ease of interpretation, in Tables 1.4 and 1.5, each word stem (denoted by black letters) has been transformed back into the most common full word in the dataset (grey letters), and Swedish words translated into English.
Table 1.4: Most Common Headline Words: Tax Refunds Sweden Word Frequency million 0.26 receive 0.24 coming 0.20 kronor 0.16 midsummer 0.14 billion 0.14 share 0.10 paid 0.07 celebrate 0.05 travel 0.05 United States Word Frequency fraud 0.27 scheme 0.25 identity 0.22 sentence 0.20 prison 0.14 stolen 0.14 million 0.12 washington 0.12 file 0.11 fraudulent 0.10
Table 1.5: Most Common Headline Words: Tax Return Filing Sweden Word Frequency day 0.82 file 0.64 last 0.64 chat 0.27 chance 0.18 electronic 0.18 hand-in 0.18 may 0.18 skatteverket 0.18 phone 0.09 United States Word Frequency prepare 0.43 false 0.36 file 0.35 federal 0.23 washington 0.21 guilty 0.14 sentenced 0.14 court 0.14 income 0.13 plead 0.13
These results suggest that in the US, where preparing a tax return is a time-consuming endeavor with a salient deadline, and tax refund payout is a more diffused process, media attention is chiefly focused on the compliance and safe-guarding aspects of both filing returns (e.g., ‘prepare’, ‘false’, ‘file’, ‘guilty’, ‘court’) and the payout of refunds (e.g., ‘fraud’, ‘iden-tity’, ‘sentence’, ‘prison’, ‘stolen’). In Sweden, on the other hand, where filing a tax return is a nearly automatic process, the primary media focus is on the tax refund that most of the population expects. The majority of tax refunds are given to citizens during a period of a cou-ple of refund days, in conjunction with the year’s most popular holiday—Midsummer. The