ASSESSING THE IMPACT OF WEATHER ON TRAFFIC INTENSITY
Mario Cools, Elke Moons, Geert Wets* Transportation Research Institute
Hasselt University Wetenschapspark 5, bus 6 BE-3590 Diepenbeek Belgium Fax.:+32(0)11 26 91 99 Tel.:+32(0)11 26 91{31, 26, 58}
Email: {mario.cools, elke.moons, geert.wets}@uhasselt.be
* Corresponding author
Number of words = 4391 Number of Figures = 2
Number of Tables = 6
Words counted: 4391 + 8*250 = 6391 words Paper submitted: November 14, 2007
ABSTRACT
The investigation of weather effects on traffic intensity is important from a road safety point of view, because traffic intensity is noted as the first and primary determinant of traffic safety. Next to traffic safety, weather conditions affect other predominant traffic variables, namely traffic demand and traffic flow. Therefore the main objective of this study is the identification and comparison of weather effects on traffic intensity at different site locations. To assess the impact of weather conditions on traffic intensity, the upstream and downstream traffic of four traffic count locations are considered. The traffic intensity data originate from minute data coming from single inductive loop detectors, collected by the Flemish Traffic Control Center. Data concerning weather events were recorded by the Royal Meteorological Institute of Belgium. The main modeling philosophy envisaged in this study to identify and quantify weather effects is the linear regression approach. Most appealing result of this study for policy makers, is the heterogeneity of the weather effects between different traffic count locations, and the homogeneity of the weather effects on upstream and downstream traffic at a certain location. The results also indicated that snowfall, rainfall and wind speed have a clear diminishing effect on traffic intensity, while maximum temperature significantly increases traffic intensity. Further generalizations of the findings are possible by studying weather effects on local roads and by shifting the scope towards travel behavior. Simultaneously modeling of weather conditions, traffic intensity rates, collision risk and activity travel behavior is certainly a key challenge for further research.
1 BACKGROUND
Increased fuel consumption, economic losses due to traffic delays, and higher crash counts are just some of the policy issues that are often related with adverse weather events. Day-to-day weather conditions such as fog and precipitation can reduce travel demand, for instance when drivers postpone or cancel discretionary trips or activities, but can also have an increasing effect when travel modes are shifted towards motorized vehicles (1). It has long been recognized that road accidents are the consequence of an interaction between behavioral, technological and environmental factors. The absence of any one of these factors could prevent an accident from occurring (2,3). At the network level, adverse weather events increase the uncertainty in system performance, resulting for instance in a network capacity reduction ranging from 10 to 20% in heavy rain (4). Figure 1 displays the interplay between weather conditions, road safety, traffic speed and traffic flow.
Weather conditions
Traffic Speed
Accident frequency and severity
Traffic flow
FIGURE 1 Relationship between weather, road safety, traffic speed and traffic flow (5).
The rise of advanced traffic management systems (ATMS) provides transportation agencies the opportunity to implement traffic management strategies that minimize weather-related side-effects on traffic operations (6). A solid understanding of the impact of various weather conditions on roadside crash frequency and traffic flow serves a good knowledge base for developing these strategies (7,8).
The investigation of weather effects on traffic intensity is important from a road safety point of view, because traffic intensity, commonly referred to as exposure in traffic safety literature, is noted as the first and primary determinant of traffic safety (9). Injury accidents are nearly proportionally related with exposure (10), evidencing the strong relationship between traffic flow conditions and the likelihood of traffic accidents (11).
Apart from the relevance to road safety, the assessment of weather impacts on traffic intensity is also of significant value to travel demand modelers. Khattak and De Palma (12) reported that adverse weather conditions cause important changes in travel decisions: mode changes, changes in departure time and diversions to alternate route, being the most prevalent behavioral adaptations. When multi-agent modeling is considered to be the most appropriate travel demand modeling framework, a deeper understanding of the impact of weather conditions on travel behavior can improve the simulation of the behavioral principles and mechanisms underlying the multi-agent modeling framework. Note that such multi-agent models represent individuals and households as agents that have plans and agendas, and that learn about the environment (and thus about weather conditions) and the consequences of their behavior (13).
Summarizing, weather events affect three predominant traffic variables: traffic demand, traffic safety and the traffic flow relationship (14). Therefore the main objective of this study is the identification and comparison of weather effects on traffic intensity at different site locations. The remainder of this introductory section will address the specific weather variables that influence the above mentioned traffic variables. Section 2 will address the data description, and the employed methodology is described in Section 3. Finally, this paper will present the results and elaborate on their transportation relevant interpretation. Some general conclusions will be formulated and avenues for further research indicated.
.
1.1 Influence of Weather on Traffic Safety
Most literature on effects of weather on traffic safety focuses on the impact of rain and wet conditions, and snow and slippery road surfaces on collision risk, collision frequency and injury and fatality rates (15). Precipitation in the form of rainfall and snowfall generally results in an increasing number of accidents (16). Andrey et al. (17,18) report an augmentation of collision risk from 50 up to 100 percent during precipitation. Notwithstanding, the effect of precipitation is multifaceted: larger effects of rainfall are observed in autumn than during spring and an increased impact is noted after dry spells (19). Withal, divergent results are found when discussing snowfall. In Denmark, for example, snowfall has a tempering effect on the number of injury accidents (10), while Zhang et al. (20) found a significantly increased risk under snow conditions. Snowstorms on rural Iowa Interstates dramatically exacerbate crash rates by 13 times during moderate-intensity snowstorms and by 25 times in high-intensity snowstorms (14). The severity of snowstorms is influenced by the duration, intensity and wind speed (21).
Next to precipitation, also other weather conditions are relevant in investigating traffic safety, for instance high winds, fog and sunshine radiation and duration, the latter having a negative impact on traffic safety (22,23). The fact that relationships between weather events and traffic safety is not always clear hampers the formulation of general research findings, especially when it is acknowledged that certain human maneuvers before a collision may have a significant impact on whether weather is a contributing factor (24).
1.2 Influence of Weather on Traffic Flows and Traffic Demand
Weather can affect traffic volumes in different ways, including diversions of trips to other modes or other paths, or even cancellations of trips (14). Studies indicate for instance that heavy rain accompanies a smaller exposure for cyclists, while mild winters and warm summers have a stimulating effect on bicycle use (25). Temperature, rain, snow and wind all influence transit ridership in a logical way: good weather increases ridership, while bad weather has a diminishing effect (26). There have been several research studies on the effect of rain, snow and fog. It has become clear that adverse weather can significantly reduce not only capacity but also operating speeds on roadways, resulting in congestion and productivity loss. (27,28).
When the effect of precipitation on traffic operations is explored, almost all studies indicate that speed and capacity are negatively influenced (29,30). The capacity reductions range from 4 to 30%, while speed is reduced by 3 to 15% (7,14). The reductions tend to be larger for precipitation amounts (16). Other factors worthwhile investigating are visibility (fog), wind speed, sunshine hours and temperature, the latter two associated with slight increases in traffic activity (31).
2 DATA
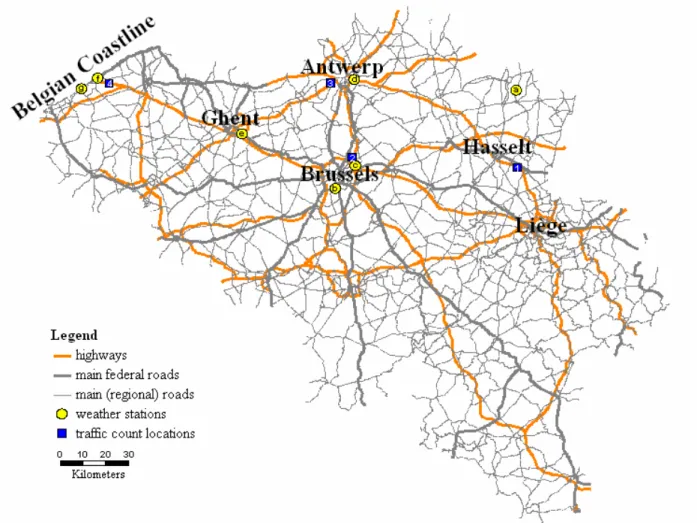
To assess the impact of weather conditions on traffic intensity, the upstream and downstream traffic of four traffic count locations (represented by blue squares in Figure 2) were considered. Weather conditions on this traffic count locations were approximated by the events recorded in the most nearby weather stations (represented by yellow circles in Figure 2).
FIGURE 2 Representation of the traffic count locations and weather stations under study. 2.1 Traffic Intensity Data
The traffic intensity data originate from minute data coming from single inductive loop detectors, collected in 2003 and 2004 by the Vlaams Verkeerscentrum (Flemish Traffic Control Center). As indicated earlier, upstream and downstream traffic intensity of four traffic count locations (displayed in Figure 2) are investigated in this study. The first location is a traffic count location measuring upstream and downstream traffic from Hasselt, a provincial city with a population of about 70 000 people. The second traffic count location is situated on one of the entranceways of Brussels, and thus excessively used by commuters. The third location under study is located on one of the entranceways of Antwerp, and the last location is based on one of the accesses to the Belgian seashore, and thus typified by leisure traffic.
Minutely, the loop detectors generate four statistics: the number of cars driven by, the number of trucks driven by, the occupancy of the detector and the time-mean speed of all vehicles (32). Adding up the number of cars and trucks for all lanes in a specific direction, yields a total traffic count for each minute. The aggregation on a daily basis of these minute data then results in daily traffic intensity measures.
2.2 Weather Data
Data concerning weather events were recorded by the Royal Meteorological Institute (KMI). Weather events on the relevant traffic count locations were approximated by the events recorded in the most nearby (available) weather stations. The following variables were recorded and considered for the analysis: daily precipitation, conditions of hail, snow and thunderstorm, average and maximum cloudiness, minimum, maximum and average temperature, maximum hourly wind speed, sunshine duration and duration of diminished visibility (due to fog).
2.3 Temporal Effects
Next to the different weather conditions that will be used to (partially) explain variability in traffic counts, it is also necessary to incorporate temporal effects. Cools et al. (33) indicated that day-of-week effects and holiday effects are contributing significantly in unraveling differences in daily traffic intensity. The following holidays occasions were considered: Christmas vacation, spring half-term, Easter vacation, Labor Day, Ascension Day, Whit Monday, vacation of the construction industry (three weeks, starting the second Monday of July), Our Blessed Lady Ascension, fall break (including All Saints’ Day and All Soul’s Day), and finally Remembrance Day. Next to this defined holiday list, the summer holidays (excluding days regarded in the holidays) were defined as a second holiday category. Next to these holiday effects, also day-of-week effects were taken into account in this study.
3 METHODOLOGY
To get prior understanding of the effects of weather on traffic intensity, some basic descriptive statistics will be provided. For the continuous variables the Spearman correlation between traffic intensity and the weather variables will be calculated. Unlike the traditional Pearson product-moment correlation, the Spearman correlation is a non-parametrical technique, robust for deviations of normality. Technically, the Spearman correlation is computed in the following way:
(
)
2 2 6 1 1 i i d n n ρ = − −∑
,where di is the difference between each rank of corresponding pair of values, and where n equals
the number of observations (34). For the categorical variables the group means are provided. The main modeling philosophy envisaged in this study is the classical linear regression approach. This modeling approach tries to explain a dependent variable with the help of other covariates. Formally, the multiple linear regression model can be represented by the following equation (35):
0 1 ,1 2 ,2 ... 1 , 1
i i i p i p i
where Y is the i-th observation of the dependent variable, i Xi,1,Xi,2,...,Xi p, −1the corresponding observations of the explanatory variables, β β β0, 1, 2...,βp−1 the parameters, which are fixed, but unknown, and where εi is the unknown random error. Estimates for the unknown parameters can be obtained by classical estimation techniques. When all underlying assumptions of the classical linear regression model are satisfied, then estimators for the parameters are BLUE (Best Linear Unbiased Estimators). Otherwise some remedial measures, like transformations, are required (35).
Since autocorrelation is present between traffic counts, ignorance of this problem would increase the risk of erroneous model interpretation. To accommodate for this risk, Newey-West heteroskedasticity and autocorrelation consistent (HAC) covariance matrices are used for the estimation process. Note that the use of HAC covariance matrices does not change the point estimates of the parameters, but only the estimated standard errors (36).
To ensure that all parameter estimates are stable and reliable, the models should be checked for multicollinearity. In the presence of multicollinearity (high correlation between explanatory variables) the effect of a single explanatory variable can not be isolated, as the regression coefficients are quite uninformative and confidence intervals very wide. Thus, the individual estimated coefficients should be interpreted with caution, since only imprecise information can be derived from the regression coefficients (37). In this study, Variance Inflation Factors (VIF) are used as a diagnostic tool to assess the level of multicollinearity. These VIF factors measure how much the variances of the estimated regression coefficients are inflated as compared to when the predictor variables are not linearly related. The largest VIF-value among all predictor variables is used as an indicator of the severity of multicollinearity. A maximum VIF-value exceeding 10 indicates that the stability and reliability of the parameter estimates are questionable (35).
4 RESULTS
4.1 Descriptive Analysis
Inspection of the Spearman correlations between traffic intensity and the continuous explanatory variables (Table 1) reveals that weather conditions appear to have divergent impacts on traffic intensity according to the traffic count location under study. In contrast to these differences between locations, weather impacts are quite homogeneous when downstream and upstream (denoted as ‘down’ and ‘up’) intensities of the same locations are compared. The highest correlations with traffic intensity are found for maximum temperature and maximum cloudiness and amount of precipitation. Most appealing are the considerably larger correlations of weather conditions at the seashore traffic count location.
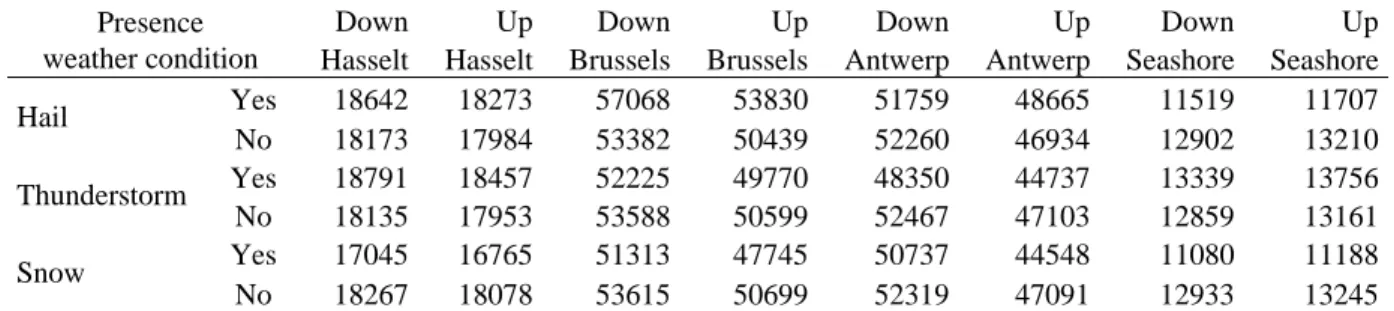
When the group means of the different categorical weather indicators (Table 2) are compared, ambiguity is found in the interpretation of hail and thunderstorm effects: on some locations traffic intensity increases in the presence of these weather conditions, on other locations it decreases. In contrast, the impact of snow is univocal: snow decreases the traffic intensity on all traffic count locations.
TABLE 1 Spearman Correlations Between Traffic Intensity and Continuous Predictors
Down Up Down Up Down Up Down Up
Weather condition
Hasselt Hasselt Brussels Brussels Antwerp Antwerp Seashore Seashore Cloudiness (Mean) -0.15 -0.18 -0.09 -0.10 -0.10 -0.20 -0.37 -0.33 Cloudiness (Max) -0.17 -0.20 -0.09 -0.10 -0.11 -0.19 -0.34 -0.29 Precipitation -0.10 -0.13 -0.14 -0.12 -0.13 -0.19 -0.26 -0.25 Temperature (Mean) 0.17 0.23 0.02 0.04 0.04 0.13 0.56 0.52 Temperature (Max) 0.20 0.27 0.05 0.07 0.07 0.17 0.61 0.57 Temperature (Min) 0.13 0,18 -0.01 0.01 0.02 0.06 0.45 0.42 Wind speed (Max) -0.06 -0.09 -0.11 -0.09 -0.08 -0.11 -0.26 -0.25 Sunshine duration 0.15 0.20 0.11 0.13 0.09 0.23 0.45 0.42 Visibility (<500m) -0.04 -0.03 -0.02 -0.04 -0.03 -0.11 -0.02 0.00 Visibility (<200m) -0.03 -0.02 -0.04 -0.06 -0.01 -0.06 0.02 0.03
TABLE 2 Group Means of Traffic Intensity by Presence of Weather Condition
Down Up Down Up Down Up Down Up
Presence
weather condition Hasselt Hasselt Brussels Brussels Antwerp Antwerp Seashore Seashore Yes 18642 18273 57068 53830 51759 48665 11519 11707 Hail No 18173 17984 53382 50439 52260 46934 12902 13210 Yes 18791 18457 52225 49770 48350 44737 13339 13756 Thunderstorm No 18135 17953 53588 50599 52467 47103 12859 13161 Yes 17045 16765 51313 47745 50737 44548 11080 11188 Snow No 18267 18078 53615 50699 52319 47091 12933 13245
4.2 Linear Regression Modeling
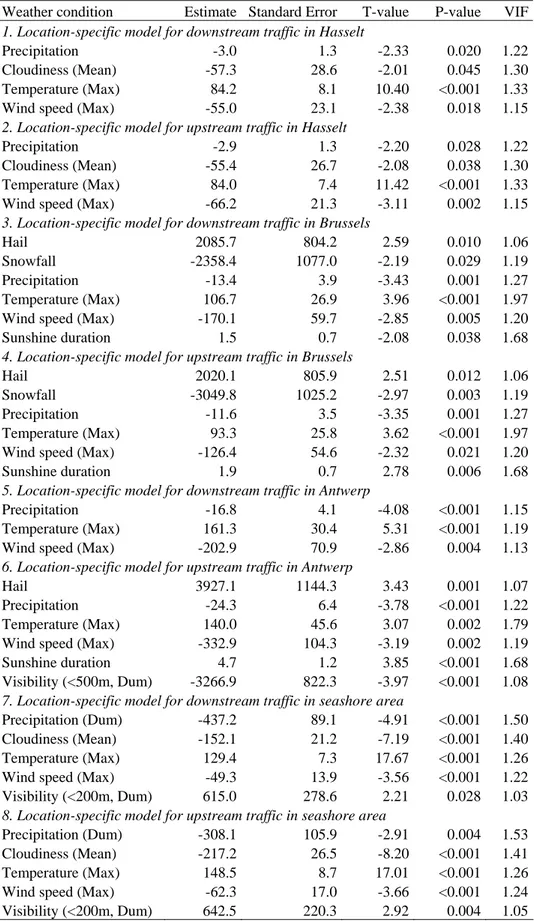
Estimates for the variables that were used in the final linear regression models, together with the corresponding standard errors and values for the significance tests, are displayed in Table 3. The VIF-factors assure that the parameter estimates are stable and reliable. The temporal effects (day-of-week effects and holiday effects) are omitted from this table, since this paper focuses mainly on assessing the impact of weather conditions on traffic intensity and because Cools et al. (33) already reported on the impact of temporal effects.
Investigation of Table 3 reveals that the impact of weather conditions is clearly more homogeneous between upstream and downstream traffic at a certain location, than between different locations. This heterogeneity between different locations can be (partially) explained by the underlying travel motives of the road users using these highways. Highways typified by their leisure traffic can be affected more easily than highways that are excessively used by commuters. Underlying reason is the relative high invariability of work activities compared to the flexibility of adapting leisure activities.
The estimated weather effects are consistent with international literature addressing the impact of weather conditions on traffic intensity (38): rainfall, snowfall and wind speed significantly decrease traffic volumes, while temperature has a noticeable increasing effect.
TABLE 3 Parameter Estimates (HAC) for Weather Effects
Weather condition Estimate Standard Error T-value P-value VIF 1. Location-specific model for downstream traffic in Hasselt
Precipitation -3.0 1.3 -2.33 0.020 1.22
Cloudiness (Mean) -57.3 28.6 -2.01 0.045 1.30 Temperature (Max) 84.2 8.1 10.40 <0.001 1.33 Wind speed (Max) -55.0 23.1 -2.38 0.018 1.15 2. Location-specific model for upstream traffic in Hasselt
Precipitation -2.9 1.3 -2.20 0.028 1.22
Cloudiness (Mean) -55.4 26.7 -2.08 0.038 1.30 Temperature (Max) 84.0 7.4 11.42 <0.001 1.33 Wind speed (Max) -66.2 21.3 -3.11 0.002 1.15 3. Location-specific model for downstream traffic in Brussels
Hail 2085.7 804.2 2.59 0.010 1.06
Snowfall -2358.4 1077.0 -2.19 0.029 1.19
Precipitation -13.4 3.9 -3.43 0.001 1.27
Temperature (Max) 106.7 26.9 3.96 <0.001 1.97 Wind speed (Max) -170.1 59.7 -2.85 0.005 1.20
Sunshine duration 1.5 0.7 -2.08 0.038 1.68
4. Location-specific model for upstream traffic in Brussels
Hail 2020.1 805.9 2.51 0.012 1.06
Snowfall -3049.8 1025.2 -2.97 0.003 1.19
Precipitation -11.6 3.5 -3.35 0.001 1.27
Temperature (Max) 93.3 25.8 3.62 <0.001 1.97 Wind speed (Max) -126.4 54.6 -2.32 0.021 1.20
Sunshine duration 1.9 0.7 2.78 0.006 1.68
5. Location-specific model for downstream traffic in Antwerp
Precipitation -16.8 4.1 -4.08 <0.001 1.15
Temperature (Max) 161.3 30.4 5.31 <0.001 1.19 Wind speed (Max) -202.9 70.9 -2.86 0.004 1.13 6. Location-specific model for upstream traffic in Antwerp
Hail 3927.1 1144.3 3.43 0.001 1.07
Precipitation -24.3 6.4 -3.78 <0.001 1.22
Temperature (Max) 140.0 45.6 3.07 0.002 1.79 Wind speed (Max) -332.9 104.3 -3.19 0.002 1.19 Sunshine duration 4.7 1.2 3.85 <0.001 1.68 Visibility (<500m, Dum) -3266.9 822.3 -3.97 <0.001 1.08 7. Location-specific model for downstream traffic in seashore area
Precipitation (Dum) -437.2 89.1 -4.91 <0.001 1.50 Cloudiness (Mean) -152.1 21.2 -7.19 <0.001 1.40 Temperature (Max) 129.4 7.3 17.67 <0.001 1.26 Wind speed (Max) -49.3 13.9 -3.56 <0.001 1.22 Visibility (<200m, Dum) 615.0 278.6 2.21 0.028 1.03 8. Location-specific model for upstream traffic in seashore area
Precipitation (Dum) -308.1 105.9 -2.91 0.004 1.53 Cloudiness (Mean) -217.2 26.5 -8.20 <0.001 1.41 Temperature (Max) 148.5 8.7 17.01 <0.001 1.26 Wind speed (Max) -62.3 17.0 -3.66 <0.001 1.24 Visibility (<200m, Dum) 642.5 220.3 2.92 0.004 1.05
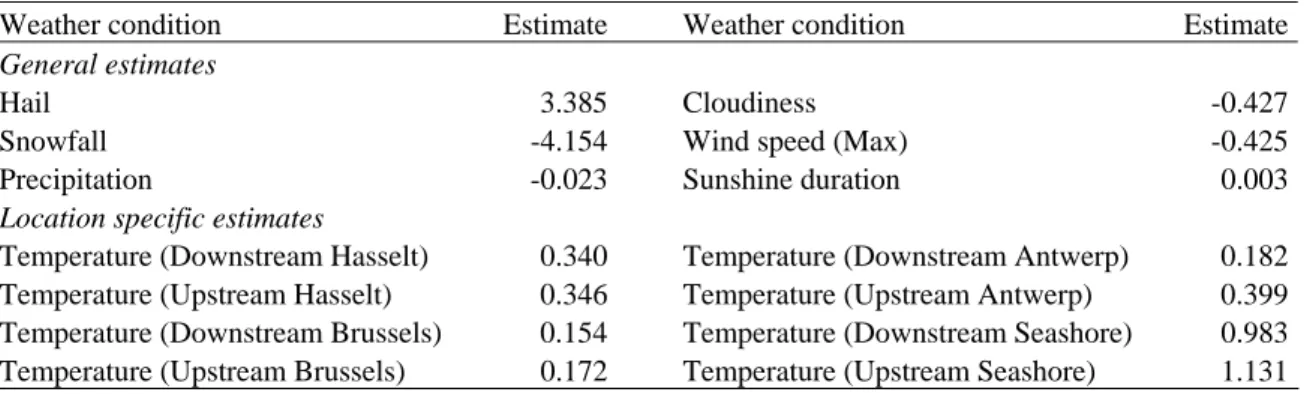
Next to the location-specific models, also an overall model was estimated to quantify the influence of weather conditions on traffic intensity. To accommodate for differences in magnitude of the traffic volume between the eight traffic count locations (e.g. magnitude of the traffic volume of downstream traffic in Brussels are almost three times the magnitude of the traffic volume of downstream traffic in the seashore area), the percentage of the traffic volumes relative to their location specific mean were modeled in stead of the absolute numbers. The significance tests for the parameters estimated in this model are shown in Table 4. The significant interaction term between location and temperature confirms the finding that weather conditions have a differential impact according to type of location. Estimates for the weather conditions of this overall model are provided in Table 5. Similar conclusions can be drawn from these estimates for this overall model as compared to the location specific models: temperature, sunshine duration and hail have an increasing effect on traffic flows, while precipitation, snowfall, cloudiness and wind speed reduce traffic intensity.
TABLE 4 Significance Tests for Overall Traffic Intensity Model
Explanatory Variable Numerator DF F-value P-value
(1) Day-of-week 6 82.79 <0.001
(2) Holiday 2 4.63 0.010
(3) Location 7 14,96 <0.001
(4) Interaction effect (1) & (3) 42 37.77 <0.001 (5) Interaction effect (2) & (3) 14 7.40 <0.001
(6) Hail 1 19.79 <0.001
(7) Snowfall 1 21.24 <0.001
(8) Precipitation 1 47.35 <0.001
(9) Cloudiness (Mean) 1 9.68 0.002
(10) Temperature (Max) 1 103.34 <0.001
(11) Wind speed (Max) 1 54.73 <0.001
(12) Sunshine duration 1 5.84 0.016
(13) Interaction effect (3) & (10) 7 14.00 <0.001
TABLE 5 Parameter estimates for Overall Traffic Intensity Model
Weather condition Estimate Weather condition Estimate General estimates
Hail 3.385 Cloudiness -0.427
Snowfall -4.154 Wind speed (Max) -0.425
Precipitation -0.023 Sunshine duration 0.003
Location specific estimates
Temperature (Downstream Hasselt) 0.340 Temperature (Downstream Antwerp) 0.182 Temperature (Upstream Hasselt) 0.346 Temperature (Upstream Antwerp) 0.399 Temperature (Downstream Brussels) 0.154 Temperature (Downstream Seashore) 0.983 Temperature (Upstream Brussels) 0.172 Temperature (Upstream Seashore) 1.131
4.3 Results Summary
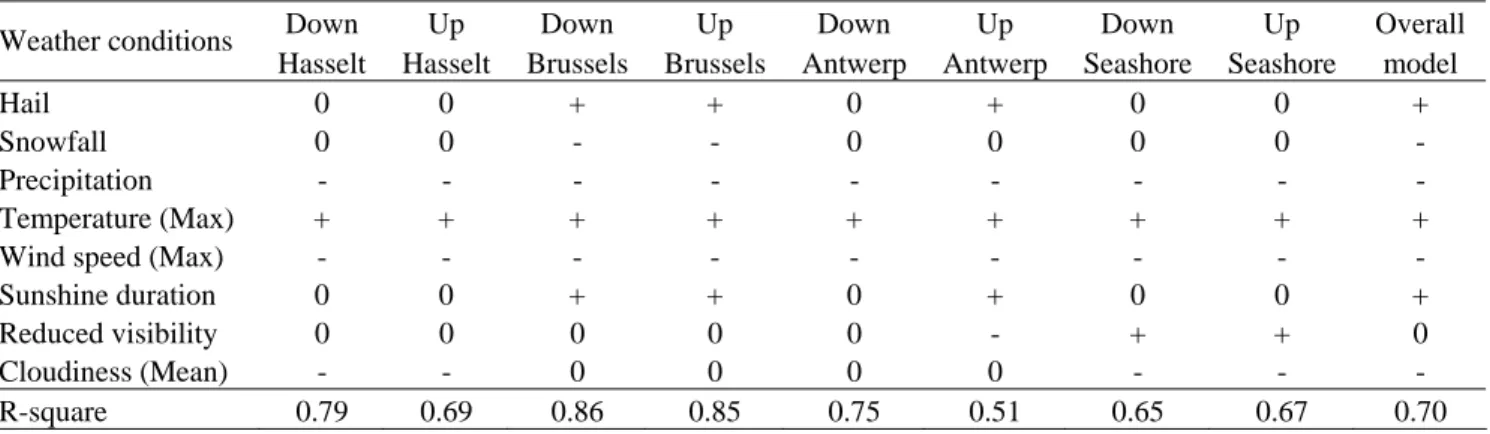
A final overview of the estimated relationships between weather conditions and traffic intensity is provided in Table 6. Recapitulating one can conclude that precipitation, cloudiness and wind speed have a clear decreasing effect on traffic intensity, while temperature, sunshine duration and hail increase traffic volumes. At least some evidence is provided that hail, unlike snowfall and rain, has an increasing effect on traffic intensity. The decreasing effect of snowfall and rain can be accounted for by the diminished capacity of the highway network, caused by a reduction in speed, while the increasing effect of hail can be attributed to the shift towards car as travel mode due to the unfavorable weather conditions. The influence of reduced visibility due to fog and cloudiness remains inconclusive.
TABLE 6 Summary of Relationships between Weather Conditions and Traffic Intensity
Down Up Down Up Down Up Down Up Overall Weather conditions
Hasselt Hasselt Brussels Brussels Antwerp Antwerp Seashore Seashore model
Hail 0 0 + + 0 + 0 0 +
Snowfall 0 0 - - 0 0 0 0 -
Precipitation - - -
Temperature (Max) + + + + + + + + +
Wind speed (Max) - - - -
Sunshine duration 0 0 + + 0 + 0 0 +
Reduced visibility 0 0 0 0 0 - + + 0
Cloudiness (Mean) - - 0 0 0 0 - - -
R-square 0.79 0.69 0.86 0.85 0.75 0.51 0.65 0.67 0.70
5 CONCLUSIONS AND FURTHER RESEARCH
In this study the impact of various weather conditions on traffic intensity was investigated. Most appealing result for policy makers, is the heterogeneity of the weather effects between different traffic count locations, and the homogeneity of the weather effects on upstream and downstream traffic at a certain location. Consequentially, traffic management strategies that minimize weather-related side-effects on traffic operations must adopt an approach that takes into account local weather effects.
The results in this paper also indicated that precipitation, cloudiness, and wind speed have a clear diminishing effect on traffic intensity, while maximum temperature, sunshine duration and hail significantly increase the traffic intensity. These significant impacts of weather conditions on traffic intensity underline the necessity of incorporating weather conditions in future traffic safety research not only in a direct way, but also indirectly by modeling the effects of weather conditions via traffic intensity. Because of the previously discussed inherent relationship between traffic intensity, weather and traffic safety, the results indicate that indicate that preferably location specific traffic safety policies need to be developed next to a global country-wide strategy.
Further generalizations of the findings are possible by studying weather effects on local roads and by shifting the scope towards travel behavior. Linking travel behavior research, traffic flow modeling, and safety research by simultaneously modeling of weather conditions, traffic
intensity rates, collision risk and activity travel behavior is certainly a key challenge for further research.
6 ACKNOWLEDGEMENTS
The authors would like to thank the Vlaams Verkeerscentrum (Flemish Traffic Control Center) for providing the traffic count data used in this study.
7 REFERENCES
(1) Hranac, R., Sterzin, E., Krechmer, D., Rahka, H. and Farzaneh, M. Empirical Studies on
Traffic Flow in Inclement Weather. Publication FHWA-HOP-07-073. FHWA, U.S.
Department of Transportation, 2006.
(2) Levine, N., Kim, K.E. and Nitz, L.H. Daily fluctuations in Honolulu motor vehicle accidents. Accident Analysis and Prevention, Vol. 27, No. 6, 1995, pp. 785-796.
(3) Edwards, J.B. Weather-related road accidents in England and Wales: a spatial analysis.
Journal of Transport Geography, Vol. 4, No. 3, 1996, pp. 201-212.
(4) De Palma, A. and Rochat, D. Understanding individual travel decisions: results from a commuters survey in Geneva. Transportation, Vol. 26, No. 3, 1999, pp. 263-281.
(5) Koetse, M.J., Rietveld, P. Climate change, adverse weather conditions, and transport: A literature survey. In Proceedings of the 9th NECTAR Conference. CDROM. Network on European Communication and Transportation Activities Research (NECTAR), Porto, Portugal, 2007.
(6) Zhang, L., Colyar, J., Pisano, P. and Holm. P. Identifying and Assessing Key Weather-Related Parameters and Their impacts on Traffic Operations Using Simulation. In
Proceedings of the 84th annual meeting of the Transportation Research Board. CDROM.
Transportation Research Board of the National Academies, Washington, D.C., 2005.
(7) Smith, B.L., Byrne, K.G., Copperman, R.B., Hennessy, S.M. and Goodall, N.J. An investigation into the impact of rainfall on freeway traffic flow. In Proceedings of the 83rd
annual meeting of the Transportation Research Board. CDROM. Transportation Research
Board of the National Academies, Washington, D.C., 2004.
(8) Shankar, V.N., Chayanan, S., Sittikariya, S., Shyu, M.-B., Juvva, N.K. and Milton, J.C. Marginal Impacts of Design, Traffic, Weather, and Related Interactions on Roadside Crashes. In Transportation Research Record: Journal of the Transportation Research
Board, No. 1897, TRB, National Research Council, Washington, D.C., 2004, pp. 156-163.
(9) Van den Bossche, F., Wets G. and Brijs, T. Role of Exposure in Analysis of Road Accidents: A Belgian Case Study. In Transportation Research Record: Journal of the
Transportation Research Board, No. 1908, TRB, National Research Council, Washington,
D.C., 2005, pp. 96-103.
(10) Fridstrøm, L., Ifver, J., Ingebrigtsen, S., Kulmala, R. and Thomsen, L.K. Measuring the contribution of randomness, exposure, weather, and daylight to the variation in road accident counts. Accident Analysis and Prevention, Vol. 27, No. 1, 1995, pp. 1-20.
(11) Golob, T.F., Recker, W.W. and Alvarez, V.M. Freeway safety as a function of traffic flow.
Accident Analysis and Prevention, Vol. 36, No. 6, 2004, pp. 933-946.
(12) Khattak, A.J. and De Palma, A. The impact of adverse weather conditions on the propensity to change travel decisions: a survey of Brussels commuters. Transportation
Research Part A: Policy and Practice, Vol. 31, No. 3, 1997, pp. 181-203.
(13) An Activity-Based Approach for Surveying and Modelling Travel Behaviour: SBO Mid
Term Report. Transportation Research Institute, Hasselt University, Diepenbeek, 2007.
(14) Maze, T.H., Agarwal, M. and Burchett, G. Whether Weather Matters to Traffic Demand, Traffic Safety, and Traffic Operations and Flow. In Transportation Research Record:
Journal of the Transportation Research Board, No. 1948, TRB, National Research
Council, Washington, D.C., 2006, pp. 170-176.
(15) Andrey, J., Mills, B., Leahy, M. and Suggett, J. Weather as a chronic hazard for road transportation in Canadian cities. Natural Hazards, Vol. 28, No. 2-3, 2003, pp. 319-343. (16) Keay, K. and Simmonds, I. The association of rainfall and other weather variables with
road traffic volume in Melbourne, Australia. Accident Analysis and Prevention, Vol. 37, No. 1, 2005, pp. 109-124.
(17) Andrey, J., Mills, B. and Vandermolen, J. Weather Information and Road Safety.Institute for Catastrophic Loss Reduction Paper Series 15. University of Western Ontario, London, Ontario, Canada, 2002.
(18) Andrey, J., Mills, B. and Vandermolen, J. A Temporal Analysis of Weather-related Collision Risk for Ottowa, Canada, 1990-1998. In Proceedings of the 82nd annual meeting
of the Transportation Research Board. CDROM. Transportation Research Board of the
National Academies, Washington, D.C., 2003.
(19) Keay, K. and Simmonds, I. Road accidents and rainfall in a large Australian city. Accident
Analysis and Prevention, Vol. 38, No. 3, 2006, pp. 445-454.
(20) Zhang, C., Ivan, J.N., ElDessouki, W.M. and Anagnostou, E.N. Relative Risk Analysis for Studying the Impact of Adverse Weather Conditions and Congestion on Traffic Accidents. In Proceedings of the 84th annual meeting of the Transportation Research Board. CDROM. Transportation Research Board of the National Academies, Washington, D.C., 2005.
(21) Qin, X., Noyce, D.A., Lee, C. and Kinar, J.R. Snowstorm Event-Based Crash Analysis. In
Transportation Research Record: Journal of the Transportation Research Board, No. 1948, TRB, National Research Council, Washington, D.C., 2006, pp. 135-141.
(22) Edwards, J.B. The relationship between road accident severity and recorded weather.
Journal of Safety Research, Vol. 29, No. 4, 1998, pp. 249-262.
(23) Hermans, E., Brijs, T., Stiers, T. and Offermans, C. The Impact of Weather Conditions on Road Safety Investigated on an Hourly Basis. In Proceedings of the 85th annual meeting of
the Transportation Research Board. CDROM. Transportation Research Board of the
National Academies, Washington, D.C., 2006.
(24) Golob, T.F. and Recker W.W. Relationships Among Urban Freeway Accidents, Traffic
Flow, Weather and Lighting Conditions. California PATH Working Paper
UCB-ITS-PPWP-2001-19, Irvine, 2001.
(25) Bos, J.M.J. Door weer en wind: Gevolgen van perioden met extreme weer voor de verkeersveiligheid. R-2001-23. Stichting Wetenschappelijk Onderzoek Verkeersveiligheid (SWOV), Leidschendam, 2001. (in Dutch)
(26) Guo, Z., Wilson, N.H.M. and Rahbee, A. The Impact of Weather on Transit Ridership in Chicago. In Proceedings of the 86th annual meeting of the Transportation Research
Board. CDROM. Transportation Research Board of the National Academies, Washington,
D.C., 2007.
(27) Highway Capacity Manual. TRB, National Research Council, Washington, D.C., 2000. (28) Agarwal, M., Maze, T.H. and Souleyrette, R. The Weather and Its Impact on Urban
Freeway Traffic Operations. In Proceedings of the 85th annual meeting of the
Transportation Research Board. CDROM. Transportation Research Board of the National
Academies, Washington, D.C., 2006.
(29) Stern, A., Shah, V., Goodwin, L. and Pisano, P. Analysis of Weather Impacts on Traffic Flow in Metropolitan Washington DC. In Proceedings of the 19th International
Conference on Interactive Information and Processing Systems (IIPS) for Meteorology, Oceanography, and Hydrology. American Meteorological Society, Long Beach, CA, 2003.
(30) Unrau, D. and Andrey, J. Driver Response to Rainfall on Urban Expressways. In
Transportation Research Record: Journal of the Transportation Research Board, No. 1980, TRB, National Research Council, Washington, D.C., 2006, pp. 24-30.
(31) Hassen, Y.A. and Barker, D.J. The impact of unseasonable or extreme weather on traffic activity within Lothian region, Scotland. Journal of Transport Geography, Vol. 7, No. 3, 1999, pp. 209-213.
(32) Maerivoet, S. Modeling Traffic on Motorways: State-of-the-art, Numerical Data Analysis,
and Dynamic Traffic Assignment, Ph.D. Thesis. Katholieke Universiteit Leuven,
Department of Electrical Engineering ESAT-SCD (SISTA), 2006.
(33) Cools, M., Moons, E. and Wets, G. Investigating the Effect of Holidays on Daily Traffic Counts: A Time Series approach. Forthcoming in Transportation Research Record:
Journal of the Transportation Research Board, TRB, National Research Council,
Washington, D.C., 2007.
(34) Cohen, J. and Cohen, P. Applied multiple regression/correlation analysis for the
behavioral sciences, Second Edition, Erlbaum, Hillsdale, NJ, 1983.
(35) Neter, J., et al. Applied Linear Statistical Models. WCB/McGraw-Hill, 1996. (36) EViews 5.1 User’s Guide. Quantitative Micro Software, LLC, Irvine, CA, 2005.
(37) Van den Bossche, F., Wets, G. and Brijs, T. A Regression Model with ARMA Errors to Investigate the Frequency and Severity of Road Traffic Accidents. In Proceedings of the
83rd annual meeting of the Transportation Research Board. CDROM. Transportation
Research Board of the National Academies, Washington, D.C., 2004.
(38) Kyte, M., Khatib, Z., Shannon, P. and Kitchener, F. Effect of Weather on Free-Flow Speed. In Transportation Research Record: Journal of the Transportation Research