Toward the quantification of the cement paste content of fine recycled concrete
aggregates by salicylic acid dissolution corrected by a theoretical approach
Zengfeng ZHAO1,2*, Denis DAMIDOT1, Sébastien REMOND1, Luc COURARD2 1. Mines Douai, LGCgE-GCE, F-59508 Douai, France
2. ArGEnCo Department, GeMMe Building Materials, University of Liège, Liège, 4000, Belgium
Abstract
Recycled concrete aggregates (RCA) are mainly composed of an intimate mix between natural aggregates and cement paste and the complete separation between these two phases is difficult. Cement paste generally presents a much larger porosity than natural aggregates, the content and the physicochemical properties of cement paste therefore have a large influence on the properties of RCA. Any method seems to be adapted to the characterization of cement paste content (CPC) in fine recycled concrete aggregates (FRCA) especially for RCA containing calcareous aggregates. A simple method based on the dissolution of the cement paste in a solution of salicylic acid in methanol was specifically developed to estimate the cement paste content of RCA. Results showed that salicylic acid dissolution method can dissolve most phases of hardened Portland cement paste such as Portlandite, ettringite and C-S-H without dissolving siliceous and calcareous aggregates. The experimental results for two neat Portland cement pastes (white cement paste and grey cement paste) showed that the soluble fraction in salicylic acid (SFSA) was equal to the cement paste content for white cement and slightly lower for the grey cement. The SFSA was measured for different types of RCA. The RCA manufactured in the laboratory whose composition is fully known and three RCA manufactured from industrial crushing platforms have been characterized. Whatever RCA used in our study, SFSA varies almost linearly with the average particle size. A linear relationship was obtained between the water absorption coefficient and SFSA. This relationship allowed us to accurately determine the water absorption coefficient of the smallest granular class 0/0.63mm.
Originality
- A new simple method to estimate the cement paste content of recycled concrete aggregates; soluble fraction in salicylic acid (SFSA).
- The linear relationship between the water absorption coefficient and SFSA that enables us to accurately determine the water absorption coefficient of the smallest granular class 0/0.63mm that is an important parameter to design concrete containing recycled concrete aggregates.
Keywords: Recycled concrete aggregates, cement paste content, salicylic acid, water absorption coefficient
1
1. Introduction
Recycled concrete aggregates (RCA) are mainly composed of an intimate mix between natural aggregates and cement paste. Cement paste generally presents a much larger porosity than natural aggregates, the content and the physicochemical properties of cement paste therefore have a large influence on the properties of RCA. Several authors have already shown that the cement paste content in recycled aggregates depended on the particle size (Topcu et al., 2004; Etxeberria et al., 2007). The properties of the recycled aggregates from the same concrete are not uniform in all granular classes. Generally, the cement paste content increases when the particle size decreases. Recycled sands thus possess cement paste contents significantly higher than the coarse recycled concrete aggregates. High levels of cement paste in recycled sands make it harder to recycle into concrete comparing with coarse RCA. Recycled sands have especially high water absorption coefficients that have to be measured accurately in order to determine the effective amount of water in mortars or concretes containing these sands. The measure of the water absorption coefficient of crushed sand is difficult, especially when they contain significant amounts of fines. Improved methods of measuring water absorption coefficient are thus necessary to encourage the recovery of recycled sand in mortars or concretes. Knowledge of cement paste content in RCA would better control their use properties. These properties especially the water absorption coefficient, in fact directly dependent on the content and the porosity of the hardened cement paste contained in RCA. Several methods have been proposed in the literature for measuring the cement paste content or adherent mortar in the recycled aggregates. (De Juan Gutiérrez, 2009) proposed a method based on a series of several cycles of heating and immersion in water to progressively detach the mortar adhering to natural aggregates. (Abbas et al., 2009) used image analysis on polished sections to measure the residual amount of mortar in coarse RCA. (Nagataki et al., 2004) used a hydrochloric acid solution to dissolve the adhering cement paste in the GR. However, the first two methods can only measure the adherent mortar content and apply only to coarse RCA. Furthermore, dissolution in hydrochloric acid is not applicable to RCA containing limestone aggregates. At present, there is no simple method for quantifying the hardened cement paste content in the RCA, whatever their sizes and their mineralogical nature.
The first objective of this work was to develop and validate a simple method to quantify the hardened cement paste content in RCA, and especially in recycled sand. Then, the second objective was to attempt to define a relationship between hardened cement paste content and the water absorption coefficient of RCA especially for the finer granular class (0/0.63mm).
2. Materials
2.1. Laboratory manufactured RCA
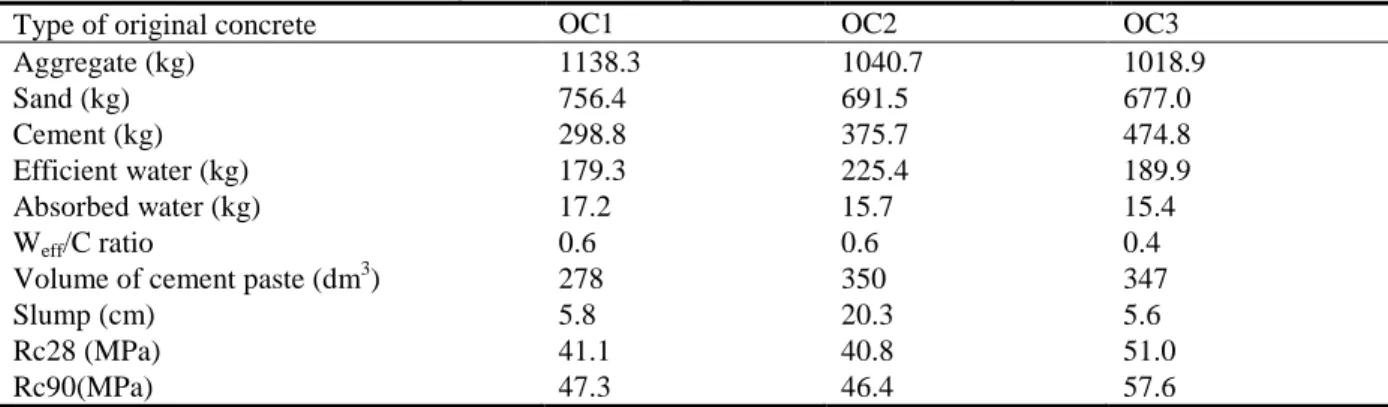
Three original concretes (noted OC1, OC2 and OC3) with two different W/C ratios and volumes of paste were first manufactured in the laboratory and then crushed in a jaw crusher after 28 and 90 days curing in water. These concretes were all made with white cement (CEM I 52.5 "super-white" of Lafarge) and crushed calcareous sand and coarse calcareous aggregates sourced from Tounai (provided by the company Holcim France Benelux). Table 1 shows the details of composition and the main characteristics of the three concretes.
Table 1 Original concrete compositions made in laboratory (1m3)
Type of original concrete OC1 OC2 OC3
Aggregate (kg) 1138.3 1040.7 1018.9 Sand (kg) 756.4 691.5 677.0 Cement (kg) 298.8 375.7 474.8 Efficient water (kg) 179.3 225.4 189.9 Absorbed water (kg) 17.2 15.7 15.4 Weff/C ratio 0.6 0.6 0.4
Volume of cement paste (dm3) 278 350 347
Slump (cm) 5.8 20.3 5.6
Rc28 (MPa) 41.1 40.8 51.0
After crushing, the fraction 0/5mm of RCA obtained was divided into four granular classes: 0/ 0.63mm, 0.63/1.25mm, 1.25/2.5mm and 2.5/5mm. All these RCA were dried at 105°C and then stored in sealed bags in order to minimize carbonation.
Pure cement pastes of W/C= 0.4 and 0.6 were also performed and cured in water for 90 days. They were made with the previous white cement as well as grey cement (CEM II 52.5 of Holcim). Table 2 presents the mineralogical compositions of these two cements determined with the Rietveld method.
Table 2 Mineralogical composition of cements determined by the XRD-Rietveld (%)
C3S C2S C3A C4AF Anhydrite Calcite Periclase Gypsum Quartz White cement CEM I 52.5 73.90 21.87 1.46 - 0.52 1.53 0.72 - - Grey cement CEM II 52.5 52.37 8.01 8.86 8.89 0.74 17.93 0.46 2.05 0.7
2.2. Industrial RCA
Three RCA produced in industrial crushing platforms have also been used. The first two noted as RCAi1 and RCAi2 were provided by Colas and were produced respectively on the platforms VALORMAT Amiens and that of Louvres. The third is noted RCAi3 was used in the French National Project Recybéton. Only fraction 0/5mm of RCA has been studied and they have been subdivided into the four granular classes previously used for the RCA made in the laboratory.
3. Measurement of the cement paste content in RCA
3.1. Experimental methods
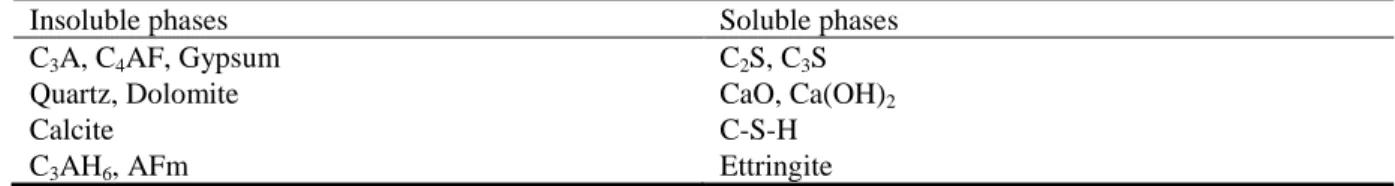
Among the methods reported in the literature, only the dissolution in acid solution is applicable to the measurement of cement paste content in fine RCA. However, the dissolution in hydrochloric acid does not apply to recycled aggregates containing limestone natural aggregates. We have developed a method based on the dissolution of the hardened cement paste in salicylic acid and methanol solution. The selective dissolution of cement paste in salicylic acid is indeed well known (Gutteridge, 1979; Luke and Glasser, 1984). Table 3 summarizes the main soluble and insoluble phases in the salicylic acid dissolution.
Table 3 Principal insoluble and soluble phases in salicylic acid and methanol dissolution Insoluble phases Soluble phases
C3A, C4AF, Gypsum Quartz, Dolomite Calcite C3AH6, AFm C2S, C3S CaO, Ca(OH)2 C-S-H Ettringite
The experimental protocol used for this measurement is as follows (Zhao et al., 2013):
a) A representative sample is dried at 105°C to constant weight, and then grinded to a size less than 200 microns;
b) 0.5g (mass M1) of the dried representative sample is then immersed in a solution of 14 g of salicylic acid in 80 ml of methanol and stirred for 1 hour;
c) The solid fraction is filtered on a glass filter (Pyrex No.4, pores: 10-16 microns) and washed four times with methanol (2-3 mm high on top of filter);
d) The solid residue is dried in the oven at 70°C to constant mass (mass M2);
e) The soluble fraction in the salicylic acid (SFSA) is then calculated as follows (Equation 1):
( )
% 100 1 2 1− × = M M M SFSA Equation 13.2. Theoretical estimation of SFSA
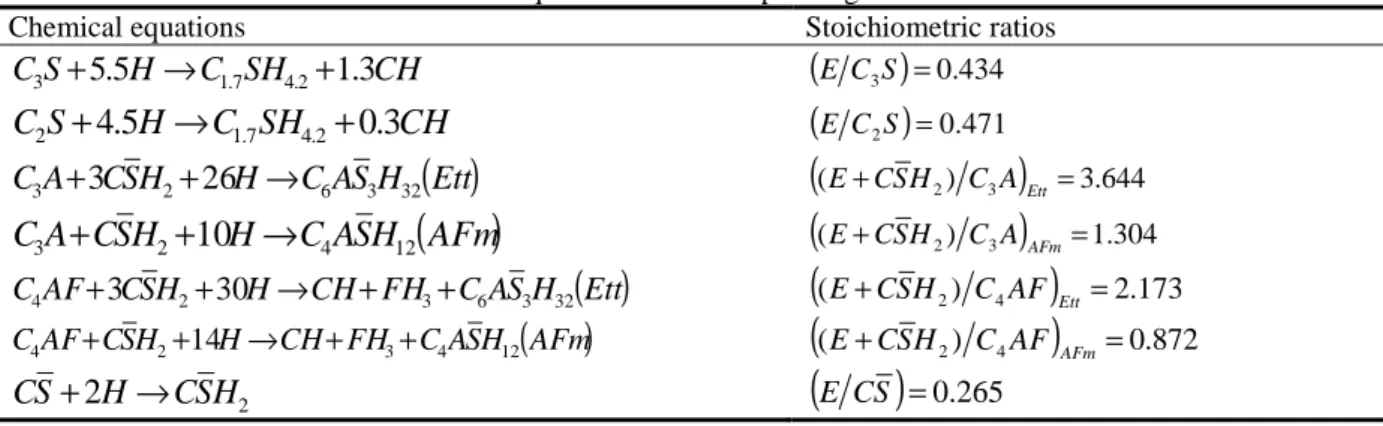
Table 3 shows that salicylic acid does not dissolve completely all the phases of the cement paste contained in the RCA. The SFSA therefore is not exactly the cement paste content (CPC). However, the difference between SFSA and CPC can be estimated theoretically. Table 4 shows the chemical equations used for modelling the hydration of cement paste (CEM I) and the corresponding stoichiometric ratios.
The soluble fraction in the salicylic acid (SFSA) can be calculated based on the degree of hydration α, and the amount of soluble anhydrous cement (C3S and C2S) and soluble hydrates (C-S-H, CH and ettringite). For the equations of hydration of the aluminate (reaction with gypsum and not with anhydrite), it is considered that the anhydrite is first hydrated as gypsum before reacting with aluminates. It is also assumed that the gypsum and anhydrite are present in the cement in stoichiometric amounts so that the reaction with the aluminate is complete at the maximum degree of hydration. The SFSA is thus given by Equation 2:
( )
hydr anh in a sol hydr sol anh M M M M M M SFSA + + + + = , ,α
Equation 2where Manh,sol and Mhydr,sol are the soluble masses of anhydrous and soluble hydrates at a degree of hydrations α, Ma is the mass of natural aggregates (considering insoluble), Min is the "inert" phases in the cement considering as insoluble (for example calcite), Manh and Mhydr are the mass of anhydrous cement (C3S, C2S, C3A, C4AF, gypsum et anhydrite) and of hydrates for the degree of hydration α.
Table 4 Chemical equations and corresponding stoichiometric ratios Chemical equations Stoichiometric ratios
CH SH C H S C3 +5.5 → 1.7 4.2+1.3
(
E C3S)
=0.434CH
SH
C
H
S
C
2+
4
.
5
→
1.7 4.2+
0
.
3
(
E C2S)
=0.471( )
Ett H S A C H H S C A C3 +3 2+26 → 6 3 32(
(E+CSH2) C3A)
Ett=3.644(
AFm
)
H
S
A
C
H
H
S
C
A
C
3+
2+
10
→
4 12(
(E+CSH2) C3A)
AFm=1.304( )
Ett H S A C FH CH H H S C AF C4 +3 2+30 → + 3+ 6 3 32(
(E+CSH2) C4AF)
Ett=2.173(
AFm)
H S A C FH CH H H S C AF C4 + 2+14 → + 3+ 4 12(
(E+CSH2) C4AF)
AFm =0.872 2 2H CSH S C + →(
E CS)
=0.265In the following equations, the degree of hydration α is the anhydrous cement consumption rate (inert phases like calcite, are not taken into account). The degree of hydration varies between 0 and 1, regardless of the cement composition.
0 , , anh consump anh
M
M
=
α
Equation 3We also define two variables x (Equation 4) and y (Equation 5) to quantify the soluble fraction of the cement in the water and the soluble fraction of the cement in the salicylic acid:
S C H S C AF C A C S C S C M M x ic anh = + + + + + = 3 2 3 4 2 0 , Equation 4 S C H S C AF C A C S C S C S C S C M M y anh sol anh + + + + + + = = 2 4 3 2 3 2 3 , Equation 5
where Mic is the mass of initial cement (Mic=Min,0+Manh,0), C3S, C2S, … are the contents of the various constituents of the cement determined using the Rietveld method (Table 2).
It is assumed that the composition of anhydrous cement does not change during hydration (the relative proportions of C3S, C2S, C3A, C4AF, gypsum and anhydrite are therefore assumed to be constant). Therefore, the parameter y is also constant during hydration. Finally, we assume that throughout the
hydration, 25% of aluminates form as ettringite and 75% of aluminates form as AFm. With all the above assumptions, the total mass of anhydrous and the mass of soluble anhydrous in the salicylic acid for a degree of hydration α can be written respectively:
(
−α)
= ic1 anh xM M Equation 6(
−α)
= 1 ,sol ic anh yxM M Equation 7The mass of soluble hydrates in salicylic acid can be written as Equation 8:
+ + + + + + + = + + = − − Ett Ett ic Ett CH H S C sol hydr AF C E AF C A C E A C S C E S C S C E S C M M M M M 4 4 3 3 2 2 3 3 , 1 1 25 . 0 1 1 α Equation 8 We assume that:
(
C A C AF)
S C S C Csol = 3 + 2 +0.25 3 + 4 Equation 9 + + + = Ett Ett sol C AF E AF C A C E A C S C E S C S C E S C C E 4 4 3 3 2 2 3 3 0.25 Equation 10 + + + + + + = AFm Ett AFm Ett moy AF C E AF C AF C E AF C A C E A C A C E A C S C E S C S C E S C S C E S C C E 4 4 4 4 3 3 3 3 2 2 3 3 75 . 0 25 . 0 75 . 0 25 . 0 Equation 11 We can obtain: moy ic ic hyd C E M xM M + =α
α
Equation 12 + = sol sol ic sol hyd C E C M M , α Equation 13Finally the SFSA can be calculated as Equation 14:
(
)
moy ic ic a sol sol ic ic C E M M M C E C M yxM SFSA + + + + − = α α α 1 Equation 143.3. Application to pure cement pastes
Table 5 shows the needed values to calculate the SFSA for the two used cements. Figure 1 shows the variation of the SFSA for the two pure cement pastes and as well for the mortar of concrete OC1 and for concrete OC1 itself. The two horizontal lines represent the measured experimental SFSA values on pure white cement and grey cement. We can see that the experimental obtained SFSA values are very close to the values calculated for the two pure cement pastes. Figure 1 shows that the measurement of SFSA allows an accurate determination of the cement paste content in the case of white cement (SFSA close to 1 for pure white cement paste). However, for a grey cement paste, SFSA remains below the cement paste content.
Table 5 Values needed to calculate the SFSA for the two cements
x y Csol (E/C)sol (E/C)moy
White cement 0.9775 0.9797 0.9614 0.4370 0.4527 Grey cement 0.8092 0.7462 0.6482 0.3940 0.5408
Figure 1 Variations of theoretical SFSA for pure grey cement paste and for pure white cement paste, mortar and concrete corresponding to the OC1 composition. Comparison with the values measured at 28 days for the
cement pastes (solid lines).
3.4. Variations of SFSA as function of granular class and of concrete composition
Table 6 present the obtained values for the three laboratory manufactured RCA as function of the four granular classes studied as also for the full fraction 0/5mm. The SFSA is also compared to the theoretical calculated value based on the mortar and concrete composition of the original concrete, considering that the degree of hydration at 28 days and 90 days are 0.7 and 0.9 respectively.
We first observe that, whatever the concrete composition and the degree of hydration, SFSA increases as the particle size decreases. This result confirms some works of literature (Topcu et al.,2004; Etxeberria et al., 2007). A reasonable linear trend is obtained between the SFSA and average particle size for all these concretes (correlation coefficient R² between 0.82 and 0.99).
In addition, regardless of the granular fraction, all experimental values are between the calculated values based on mortar and concrete composition. This indicates that the RCA not only contain crushed mortar but also part of the natural coarse aggregates of original concrete forming smaller particles during the crushing.
For all the RCA, the values of SFSA obtained for RCA-90 are slightly larger than that of the same concrete with the age of 28 days. This result is confirmed by the previous theoretical calculation showing that, for the mortar or concrete OC1, the SFSA increases monotonically with the degree of hydration.
Finally, we can see that the SFSA highly depends on the initial concrete composition. The SFSA of the concrete OC1 is lower than that of OC2 which contains a higher cement paste volume and the same W/C ratio. Similarly, SFSA of the concrete OC2 is lower than that of OC3 which contains the same volume of a denser cement paste (lower W/C ratio). Therefore, the SFSA closely depends on the quantities of cement and aggregates of the original concrete, as shown in Equation 14.
Table 6 SFSA for different granular classes of the laboratory manufactured RCA (%) Fractions RCA-OC1-28 RCA-OC1-90 RCA-OC2-28 RCA-OC2-90 RCA-OC3-28 RCA-OC3-90 0/0.63 26.54 27.28 32.66 39.01 37.31 38.36 0.63/1.25 24.98 25.72 29.51 32.63 35.68 35.86 1.25/2.5 23.25 23.60 27.06 27.79 31.53 33.22 2.5/5 19.35 20.76 23.16 25.35 28.29 29.34 0/5 22.58 23.35 26.55 29.27 31.59 32.63 Calculated value on concrete 16.53 17.48 21.36 22.5 25.9 27.2 Calculated value on mortar 32.9 34.38 40.1 41.7 46.16 47.8
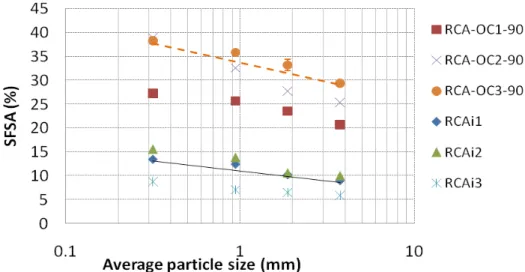
Figure 2 shows the variation of SFSA as function of the granular classes for three laboratory manufactured RCA with the ages 90 days and for three industrial RCA. For all studied RCA, there is a quasi-linear relationship between the SFSA and particle size (correlation coefficient R² between 0.77 and 0.99). The SFSA obtained for industrial RCA are significantly lower than those measured for laboratory manufactured RCA. These results might be due to the nature of cement used in the manufacture of the original concrete (probably CEM II containing a larger insoluble fraction in salicylic acid) and any carbonation of cement paste also reducing the soluble fraction.
Figure 2 Variation of SFSA as function of the different granular classes
4. Measurement of water absorption of RCA
4.1. Experimental methods
The water absorption coefficient of each granular class of RCA is determined with two different methods: the European standard method EN 1097-6 and the method No.78 of IFSTTAR. The principle of these methods is similar: in both cases, samples are saturated 24 hours in the water and then the water absorption coefficient is determined based on the water content at saturated surface dry (SSD) state. Both methods have been slightly modified for our tests as follows:
a) A representative sample of the granular class studied is immersed for 24 hours in water,
b) After being drained, the sample is dried successively on several sheets of paper towels until no moisture is visible on them (in this state, it is considered that the SSD state within the meaning of IFSTTAR method is reached), the sample is weighed (MSSD, IFSTTAR)
c) The sample is then gradually dried under a stream of hot air and carefully homogenized, the SSD state according to EN 1097-6 standard is determined according to standard protocol (with mini-cone), the sample is weighed (MSSD, EN)
d) The sample is then dried in an oven at 105°C to constant mass (MDRY)
e) The water absorption coefficients WAIFSTTAR and WAEN are then calculated according to Equation 15: DRY DRY IFSTTAR SSD IFSTTAR M M M WA = , − and DRY DRY EN SSD EN M M M WA = , − Equation 15
4.2. Water absorption coefficient as a function of the granular class
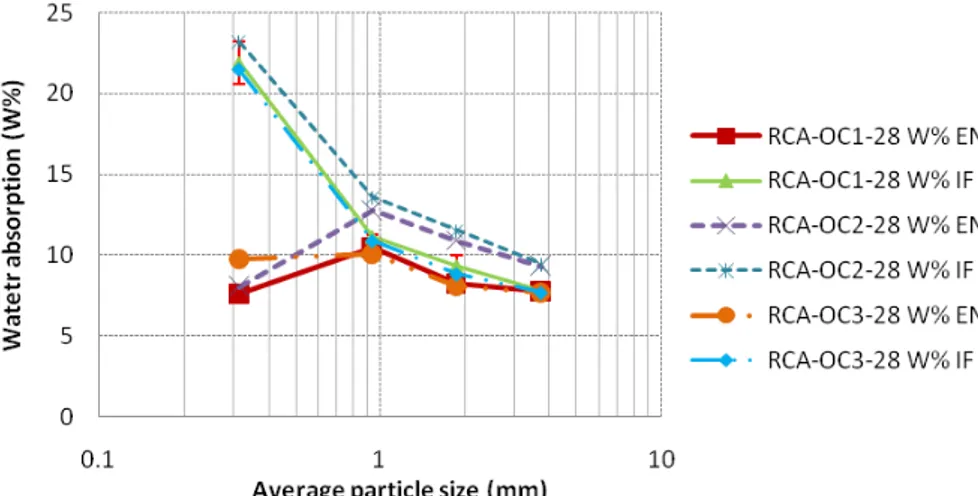
Figure 3 shows the variation of the water absorption coefficient (according to standard EN 1097-6 and according to IFSTTAR method) as function of the granular class for the RCA made in the laboratory after 28 days. Similar trends are obtained for the RCA after 90 days and for the industrial RCA. It is observed that, for the three coarser granular fractions, the values obtained by two methods are very close to each other (the absolute difference is less than 1%, regardless of the studied RCA for both
industrial and laboratory manufactured RCA). This result indicates that these two protocols can be used to determine correctly the SSD state of coarse particles.
For the smallest fraction 0/0.63mm, the standard method does not allow to identify precisely the SSD state. Indeed, for very small angular particles, some cohesion can occur between the grains even if all the water at the surface of particles has been removed (a fine tip of particles in the upper part of the sand cone after plating can be seen in Figure 4 right). This prevents the collapse of the grains once the cone is removed. This explains why the standard protocol underestimates the absorption of water from the finer fraction.
On the contrary, with IFSTTAR method, the water absorption coefficient increases a lot for the smaller fraction. Figure 4 (left) presents an optical microscopy image of the fraction 0/0.63mm of RCA-OC1-28 at SSD state with IFSTTAR method. As it can be seen, agglomerates larger than 2mm (much larger than the maximum particle size of 0.63mm) are present. This result is due to the fact that very small particles tend to agglomerate during drying because of capillary forces. Absorbent paper allows drying the surface of these agglomerates, but the method used does not allow breaking them. IFSTTAR method therefore overestimates the water absorption coefficient of the finer fraction. The same trends are obtained for both RCA made with 28 or 90 days old concrete and industrial RCA.
Figure 3 Variation of water absorption coefficient as function of the granular class
2mm
Figure 4 Views of optical microscope of fraction 0/0.63mm RCA-OC1-28 in SSDIFSTTAR condition (left) and
of a test cone in SSDEN state (right).
4.3. Using the SFSA for measuring water absorption of the fine fraction
The water absorption of recycled concrete aggregates (WARCA) depends on the water absorption of the natural aggregates (WAGN) and of adherent cement paste (WACP) and the proportions of these two phases. For a given composition of the original concrete, assuming that adherent cement paste properties do not depend on the granular fraction, we can write (Equation 16):
(
CPC
)
WA
CPC
WA
WA
RCA=
CP×
+
NA×
1
−
Equation 16In addition, the last hypothesis suggests that, in each granular fraction, the SFSA/CPC ratio is constant. Equation 16 shows that the water absorption coefficient of RCA must be proportional to the SFSA.
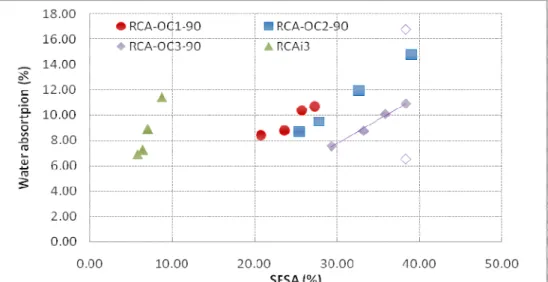
Figure 5 shows the variation of the water absorption coefficient as a function of the SFSA for the four studied RCA. The water absorption coefficient of the finer fraction is obtained by linear extrapolation of the relationship between the water absorption and SFSA determined from 3 coarse fractions. In the case of RCA-OC3-90, we also show the water absorption coefficient of the fraction 0/0.63mm obtained by the two experimental methods. We see here that the experimental protocols used are not suitable for measuring the water absorption coefficient of the fine fraction.
We therefore propose the following method to accurately measure the water absorption coefficient of the fine fraction of RCA:
a) The RCA must first be separated into various granular fractions, each representing a sufficient proportion of the material (at least 10%). In this study, the following four granular fractions were separated: 0/0.63mm, 0.63/1.25mm, 1.25/2.5mm, 2.5/5 mm.
b) The SFSA of each granular fraction must then be measured with the proposed protocol in Section 2.1.
c) The water absorption of coarse granular fractions (larger than 0.63mm) is determined according to EN 1097-6 (or by another method giving equivalent results).
d) The water absorption coefficient of the fine fraction can be finally obtained by extrapolation of the relationship between water absorption and SFSA, determined for the coarse fractions.
e) The water absorption coefficient of RCA can be calculated from the water absorption coefficients and the proportions of each granular class.
Figure 5 Variation of the water absorption coefficient as a function of SFSA for the four studied RCA. The finer fraction of the water absorption coefficient is obtained by linear extrapolation (for RCA-OC3-90, empty symbols indicate the water absorption coefficients obtained experimentally on the fraction 0/0.63mm with
standard method EN 1097-6 and method IFSTTAR)
5. Conclusions
A simple method to quantify the cement paste content (CPC) in RCA was proposed. It is based on the measurement of the soluble fraction of RCA in salicylic acid (SFSA). The SFSA is generally lower
than the CPC for common cements. However, it can be calculated theoretically from the cement composition, in the case of a CEM I. The difference between CPC and SFSA can be assessed.
The SFSA was measured for different types of RCA. The RCA manufactured in the laboratory whose composition is fully known and three RCA manufactured from industrial crushing platforms have been characterized. The RCA were separated into four granular fractions and, for each of them, the SFSA was measured together with the water absorption, according to two different experimental protocols (EN 1097-6 and method IFSTTAR).
Whatever RCA used in our study, SFSA varies almost linearly with the average particle size. The water absorption coefficients, measured according to the standard and IFSTTAR method for three larger granular fractions are very similar. However, the standard underestimates the water absorption of the fraction 0/0.63mm while IFSTTAR method overestimates it. A linear relationship is obtained between the water absorption coefficient and SFSA for three coarse fractions. This relationship allows to accurately determine the water absorption coefficient of the granular class 0/0.63mm.
Acknowledgements
The authors would like to thank Lafarge for the supply of white cement and Holcim for the supply of natural aggregates and grey cement. They also thank Colas and the National Project Recybéton for the supply of recycled aggregates. Finally, the authors would also the like to thank China Scholarship Council (CSC) for its financial support.
References
- Abbas A., Fathifazl G., Fournier B., Isgor O.B., Zavadil R., Razaqpur A.G., Foo S., 2009. Quantification of the residual mortar content in recycled concrete aggregates by image analysis. Materials Characterization, 60, 716-728.
- De Juan M.S., Gutiérrez P.A, 2009. Study on the influence of attached mortar content on the properties of recycled concrete aggregate. Construction and Building Materials, 23, 872-877.
- Etxeberria, M., Vázquez, E., Marí, A., Barra, M., 2007. Influence of amount of recycled coarse aggregates and production process on properties of recycled aggregate concrete. Cement and Concrete Research, 37, 735-742. - Gutteridge W.A., 1979. On the dissolution of the interstitial phases in Portland cement. Cement and Concrete
Research, 9, 319-324.
- Luke K., Glasser F.P., 1987. Selective dissolution of hydrated blast furnace slag cements. Cement and
Concrete Research, 17, 273-282.
- Nagataki, S., Gokce, A., Saeki, T., Hisada, M., 2004. Assessment of recycling process induced damage sensitivity of recycled concrete aggregates. Cement and Concrete Research, 34, 965-971.
- Topcu I.B., Sengel S., 2004. Properties of concretes produced with waste concrete aggregate. Cement and
Concrete Research, 34, 1307-1312.
- Zhao Z., Rémond S., Damidot D., Xu W., 2013. Influence of hardened cement paste content on the water absorption of fine recycled concrete aggregates, Journal of Sustainable Cement-Based Materials, 2, 186-203.