A Functional MRI Study
Audrey Maudoux1,2*, Philippe Lefebvre2, Jean-Evrard Cabay3, Athena Demertzi1,
Audrey Vanhaudenhuyse1, Steven Laureys1,4, Andrea Soddu1*
1 Coma Science Group, Cyclotron Research Centre, University of Lie`ge, Lie`ge, Belgium, 2 OtoRhinoLaryngology Head and Neck Surgery Department, University of Lie`ge,
Lie`ge, Belgium,3 Radiology Department, CHU Sart Tilman Hospital, University of Lie`ge, Lie`ge, Belgium, 4 Neurology Department, CHU Sart Tilman Hospital, University of
Lie`ge, Lie`ge, Belgium
Abstract
The underlying functional neuroanatomy of tinnitus remains poorly understood. Few studies have focused on functional cerebral connectivity changes in tinnitus patients. The aim of this study was to test if functional MRI ‘‘resting-state’’ connectivity patterns in auditory network differ between tinnitus patients and normal controls. Thirteen chronic tinnitus subjects and fifteen age-matched healthy controls were studied on a 3 tesla MRI. Connectivity was investigated using independent component analysis and an automated component selection approach taking into account the spatial and temporal properties of each component. Connectivity in extra-auditory regions such as brainstem, basal ganglia/NAc, cerebellum, parahippocampal, right prefrontal, parietal, and sensorimotor areas was found to be increased in tinnitus subjects. The right primary auditory cortex, left prefrontal, left fusiform gyrus, and bilateral occipital regions showed a decreased connectivity in tinnitus. These results show that there is a modification of cortical and subcortical functional connectivity in tinnitus encompassing attentional, mnemonic, and emotional networks. Our data corroborate the hypothesized implication of non-auditory regions in tinnitus physiopathology and suggest that various regions of the brain seem involved in the persistent awareness of the phenomenon as well as in the development of the associated distress leading to disabling chronic tinnitus.
Citation: Maudoux A, Lefebvre P, Cabay J-E, Demertzi A, Vanhaudenhuyse A, et al. (2012) Auditory Resting-State Network Connectivity in Tinnitus: A Functional MRI Study. PLoS ONE 7(5): e36222. doi:10.1371/journal.pone.0036222
Editor: Bogdan Draganski, Centre Hospitalier Universitaire Vaudois Lausanne - CHUV, UNIL, Switzerland Received December 29, 2011; Accepted April 2, 2012; Published May 4, 2012
Copyright: ß 2012 Maudoux et al. This is an open-access article distributed under the terms of the Creative Commons Attribution License, which permits unrestricted use, distribution, and reproduction in any medium, provided the original author and source are credited.
Funding: This research was funded by the Belgian National Funds for Scientific Research (FNRS),the Tinnitus Prize 2011 (FNRS 9.4501.12), the European Commission, the James McDonnell Foundation, the Mind Science Foundation, the French Speaking Community Concerted Research Action (ARC-06/11-340), the Public Utility Foundation ‘‘Universite´ Europe´enne du Travail,’’ ‘‘Fondazione Europea di Ricerca Biomedica,’’ and the University and University Hospital of Lie`ge. AM is a Research Fellow; AV and AS are Post-Doctoral Fellows, and SL is a Senior Research Associate at the FNRS. The funders had no role in study design, data collection and analysis, decision to publish, or preparation of the manuscript.
Competing Interests: The authors have declared that no competing interests exist. * E-mail: [email protected] (AM); [email protected] (AS)
Introduction
Tinnitus is defined as a perception of sound in the absence of any external auditory stimuli [1]. It is sometimes referred to as ‘phantom’ auditory experience. About 15% of the population is affected by chronic tinnitus and tinnitus severely affects quality of life of 1 to 3% of the population [2]. Despite its high prevalence, there is little consensus regarding the neuropathological origin of tinnitus. The prevailing opinion is that tinnitus is a perceptual consequence of altered patterns of intrinsic neural activity generated along the central auditory pathway following damage to peripheral auditory structures [2]. While the loss of afferent input to the central auditory system can initiate tinnitus, thereafter, central mechanisms are thought to play an important role in its maintenance [3]. That surgical section of the eight cranial nerve in tinnitus patients is not successful in suppressing tinnitus in 38 to 85% of the cases further supports this hypothesis [4,5]. A better characterization of central neural processing abnormalities in tinnitus can offer a better understanding of the physiopathology and may contribute to the development of therapeutic intervention procedures.
Few studies on tinnitus have assessed cerebral functional connectivity changes. Previous electrophysiological studies sug-gested evidence of modified connectivity in tinnitus subjects [6,7,8,9]. However, the use of magnetoencephalography (MEG) or electroencephalography (EEG), while providing high temporal resolution, is known to have a poor anatomical resolution making difficult precise interpretation on the exact location of the source of the signal. One way to overcome this limitation is to use a functional brain imaging technique which, even if more limited concerning temporal resolution, has better structural resolution (e.g. functional MRI).
Since it has been shown that correlation of low frequency fluctuations (0.01–0.05 Hz) of resting BOLD activity reflect functional connectivity [10], an increased focus has been directed to functional MRI studies of the brain’s baseline activity (i.e., ‘‘resting state’’ acquisitions) [11]. Indeed, these fluctuations are shown to be coherent across widely separated (although function-ally related) brain regions, constituting ‘‘resting state networks’’ [12,13]. Past studies in healthy volunteers showed that it is possible to identify consistent resting-state networks that have a functional relevance. ‘‘Default’’ network or networks involved in visual, motor, language, and auditory processing can be consistently
found in healthy subjects [14,15] and can be separated from each other from a single resting-fMRI dataset using their distinct temporal characteristics. Maps of spontaneous network correla-tions have been proposed to provide tools for the understanding of clinical conditions. fMRI resting-state paradigms have, for example, been applied to the study of hypnosis [16], anesthesia [17] and various neurological disorders including dementia [18,19], depression [20] disorder of consciousness [21,22] and auditory hallucinations [23]. The aim of this study was to investigate auditory resting state network connectivity in chronic tinnitus patients.
Materials and Methods Subjects and MRI acquisition
Two independent groups were included. The data of the first healthy control group (group 1) were analyzed in order to select auditory regions of interest (ROIs) subsequently used for auditory independent component selection in group 2. Data from the second group (group 2) were analyzed to compare the auditory resting-state fMRI activity of healthy subjects and tinnitus patients. Healthy volunteers and patients were free of major neurological, neurosurgical or psychiatric history. Head movements were minimized using customized cushions.
Group 1 included 12 control subjects (4 women; mean age 21 yrs, SD = 3). Resting state BOLD data were acquired on a 3T magnetic resonance scanner (Siemens, Allegra, Germany) with a gradient echo-planar sequence using axial slice orientation (32 slices; voxel size = 3.463.463 mm3; matrix size = 64664632; repetition time = 2460 ms, echo time = 40 ms, flip angle = 90u; field of view = 220 mm). A protocol of 350 scans was performed. A T1-weighted MPRAGE sequence was also acquired for registra-tion with funcregistra-tional data on each subject.
Group 2 included 13 patients (6 women; mean age 52 yrs, SD = 11), with chronic tinnitus present either constantly or intermittently for at least 1 year, and 15 age-matched healthy volunteers (6 women; mean age 51 yrs, SD = 13). Patients with hyperacusis or phonophobia were excluded. Hearing levels were assessed using audiological testing. Pure tones ranging from 250 Hz to 8 kHz were presented to each ear until the threshold of detection was reached. Tinnitus patients were tested to identify the best match to the perceived frequency of their tinnitus. Patients identified the pure tone or white noise from the audiological examination that best matched the center frequency of their tinnitus sensation. Self-reported severity of tinnitus impact was measured using the Tinnitus Handicap Inventory (THI) [24] and the Tinnitus Questionnaire (TQ) [25]. We asked the tinnitus patients to score the tinnitus loudness they experienced during the scanning session directly after the session on a numeric rating scale, ranging from of 0 (none) to 10 (loudest imaginable tinnitus). In group 2, resting state BOLD data were acquired on a 3T magnetic resonance scanner (Siemens, Trio Tim, Germany) with a gradient echo-planar sequence using axial slice orientation (32 slices; voxel size = 3.063.063.75 mm3; matrix size = 64664632; repetition time = 2000 ms, echo time = 30 ms, flip angle = 78u; field of view = 192 mm). A protocol of 300 scans lasting 600 seconds was performed. A T1-weighted MPRAGE sequence was also acquired for registration with functional data on each subject.
Written informed consent was obtained from all patients and healthy volunteers. The study was approved by the Ethics Committee of the Faculty of Medicine of the University of Lie`ge.
Data preprocessing and analysis
fMRI data were preprocessed and analyzed using the ‘‘BrainVoyager’’ software package (Brain Innovation, Maastricht, The Netherlands) and a previously published method [26]. Preprocessing of functional scans included 3D motion correction, linear trend removal, slice scan time correction and filtering out low frequencies of up to 0.005 Hz. The data were spatially smoothed with a Gaussian filter of full width at half maximum value of 8 mm. The functional images from each subject were aligned to the participant’s own anatomical scan and warped into the standard anatomical space of Talairach and Tournoux (1988). The spatial transformation was performed in two steps. The first step consisted in rotating the 3-D data set of each subject to be aligned with stereotaxic axes (for this step the location of the anterior commissure, the posterior commissure and two rotation parameters for midsagittal alignment were specified manually). In the second step, the extreme points of the cerebrum were specified. These points together with the anterior commissure and posterior commissure coordinates were then used to scale the 3-D data sets into the dimensions of the standard brain of the Talairach and Tournoux (1988) atlas using a piecewise affine and continuous transformation.
Auditory component selection
Before investigating spontaneous brain activity, it is necessary to correct the fMRI data for physiological and non-physiological artifacts. To be sure that the further analyzed signal is neurobiologically meaningful and corresponds to the spontaneous brain activity of interest (i.e. the auditory spontaneous activity), we applied independent component analysis. The selection of the components of interest was based on a previously validated selection method which takes advantage of the capability of independent component analysis to decompose the signal in neuronal and artifactual sources while preserving the concept of connectivity in a defined network of ROIs [26]. In order to select the independent component which represent the auditory spontaneous activity, our selection method employed ROIs that were representative regions of previously described auditory resting state network [11,12,13,14]. The ROIs were defined on an average auditory map calculated on a group of twelve independent healthy subjects (group 1). We performed self organizing ICA as implemented in Brain Voyager [27] grouping the 30 independent components of the 12 healthy subjects of group 1 in 30 clusters of spatially similar components. Subse-quently, we averaged the maps belonging to the cluster which was selected as auditory by visual inspection. Fourteen ROIs were selected as representative clusters of the Heschl gyrus (Brodman area 41/42), secondary/associative auditory cortices (Brodman area 22) and the insula of our average auditory map (table S1). The ROIs were set initially to a cubic shape 10610610 mm3, and the
center was chosen accordingly to the mean auditory map extracted from group 1 but once the ROI was saved in Brain Voyager only the ROI’s voxels belonging to the auditory map end up making the saved ROI. Similarly to the targets ROIs of the auditory component, we then selected six other ROIs representing the most representative regions appearing as anti-correlated regions in the auditory average map calculated on the group 1 of healthy subjects (table S1). These ROIs were used in order to rule out the global signal from the selection. Finally, we picked as auditory component the component that was selected using a compromise between spatial and temporal properties (figure 1).
The methodology used, as described by Soddu et al [26], allows building for each independent component a connectivity graph which summarizes the level of connectivity for a defined network
of ROIs according to the time behavior described by the correspondent independent component time course. After running ICA with thirty components, we used the corresponding time courses to regress in the BOLD signal in each of the fourteen ROIs. The time courses from each ROI were extracted as the arithmetic mean of the time courses of the voxels belonging to the same ROI. For each component we then obtained fourteen parameter estimates (beta values) indicating the weight of each regressor and the corresponding T-values. In order to build a connectivity graph we drew an edge between each pair of target points with T.Tthwith Tthcorresponding to 1-p/91 for p = 0.05
with 267 degrees of freedom (Bonferroni correction for multiple comparisons was performed dividing p by the number of possible edges between the thirteen nodes; 14*(14-1)/2 = 91). To account
for the fact that ICA does not predict the sign of the independent components, the condition T,-Tthwas also used. This allowed us
to end up with two connectivity graphs for each of the thirty components (1–30 for the condition T.Tthand 31–60 for T,-Tth).
We hypothesized that the number of edges E for each of the 60 connectivity graphs should be the highest for the auditory component. But given that no regressing out of the global signal was applied, we did not pick the component corresponding to the graph with the largest number of total edges (i.e., the global component could appear as the main source of connectivity). Therefore, we implemented the ‘‘anticorrelation-corrected num-ber of edges’’. The anticorrelation-corrected numnum-ber of edges was
obtained by multiplying the total number of edges of each graph by a weight ‘‘w’’ which measures the anti-correlation of the auditory activity with the set of selected anti-correlated ROIs (w will be around zero for the global component for which all the ROIs are positively correlated). However, to be sure to select a component of neuronal origin one also needs to take into account the temporal properties of the component. To do so, we selected the component with the highest ‘‘anticorrelation-corrected score’’, built by multiplying the number of anticorrelation-corrected edges by a new weight ‘‘wF’’ which measures the distance of its
fingerprint [28] from the average fingerprint of the auditory component in healthy controls (group 1). The weight wFis close to
0 for components which have ‘‘artefactual’’ source and close to 1 for components with ‘‘neuronal’’ origin - the latter assumes that in healthy controls ICA was able to fully separate artefactual from neuronal sources (figure 1).
Group analysis
Spatial maps were obtained by running a two step analysis. First, the time courses of all components but that of interest (i.e. the independent component selected as auditory) were used to regress out the BOLD signal; the saved residuals represented the BOLD activity which can possibly be explained by the auditory component. Then, by using the time course of the component of interest as a predictor of this residual BOLD activity, beta-values were obtained.
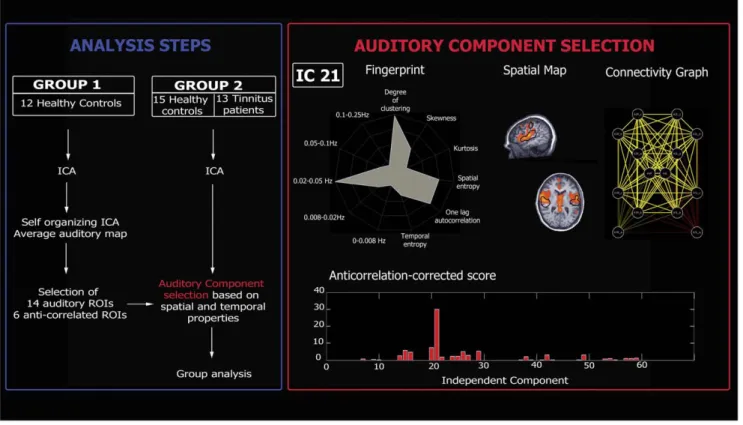
Figure 1. Analysis steps (Blue Box). For the analysis, two independent groups were included. The data of the first group (group 1, healthy controls) were analyzed in order to define auditory regions of interest (ROIs) subsequently used to select the auditory independent component in the second group (group 2, healthy controls and tinnitus patients). Data from group 2 were used to compare the auditory resting-state fMRI activity of
healthy subjects and tinnitus patients.Auditory component selection (Red Box). The independent component (IC) reflecting the auditory
network was selected based on both spatial and temporal properties. Upper panel (from left to right): Fingerprint of the selected IC; Spatial map of the selected IC (black contours indicate average auditory map calculated on group 1); Connectivity graph representing significant connectivity edges between the selected ROIs of the auditory network. Lower panel: Anticorrelation-corrected score of each graph vs. the corresponding IC number. The component with the highest score will be selected as the auditory network (IC 21 in the present example).
At a second-level analysis, the estimated beta-values entered a multi-subject random effect analysis providing group-level statis-tical T-maps. Maps were thresholded at a false discovery rate corrected p,0.05. A contrast T-test map was also estimated comparing controls and tinnitus patients. Statistical parametric maps resulting from the voxel wise analysis were considered significant for statistical values that survived a cluster-based correction for multiple comparisons as implemented in Brain Voyager [29] using the ‘‘cluster-level statistical threshold estima-tor’’ plug-in, which is based on a 3D extension of the randomization procedure described by Forman and colleagues [30]. First, voxel-level threshold was set at t = 2.772 (p = 0.01, uncorrected). After 1000 iterations, the minimum cluster size threshold that yielded a cluster-level false positive rate of 5% was applied to the statistical maps.
Results
Patients had chronic tinnitus for a mean period of 8 years (SD 9). Tinnitus matched frequencies ranged from 150 Hz to 8 kHz (mean = 4846 Hz, SD = 2276 Hz). Tinnitus Handicap Inventory score [24] varied across patients, from slight to catastrophic (Range: 16–84) as did the Tinnitus Questionnaire (Range: 18–58) [25] (Table 1). According to the World Health Organization grades of hearing impairment [31], only one tinnitus patient had a grade 1 impairment (slight impairment) all the other had a grade 0 impairment (no impairment). No patients showed profound hearing loss at any frequency (.90 dB above threshold). Four patients didn’t exhibit any degree of hearing loss at any of the tested frequencies. The remaining patients exhibited a mild or moderate hearing loss at one or more frequencies (20–40 dB or 40–60 dB above threshold, respectively), and two of these patients demonstrated severe hearing loss in at least one tested frequency (60–90 dB above threshold, on the 4 and 8 kHz).
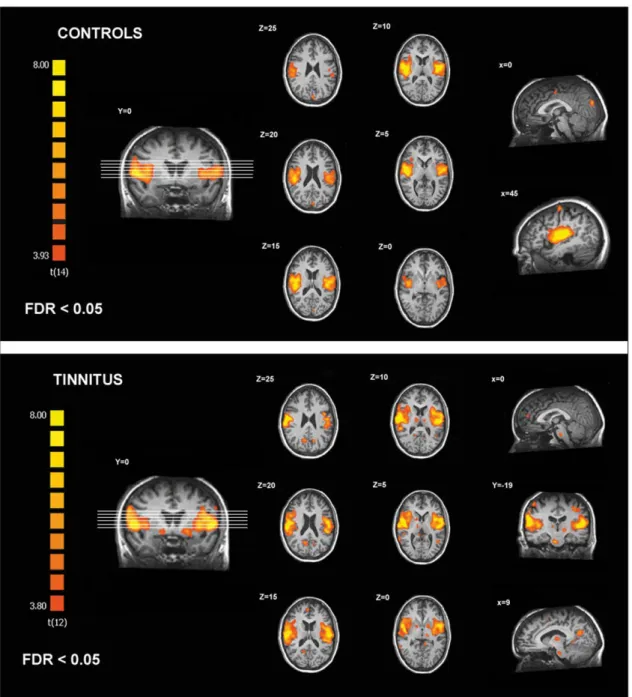
In controls, the identified auditory resting state network encompassed bilateral primary and associative auditory cortices, insula, prefrontal, sensorimotor, anterior cingulate and left occipital cortices (Table 2, figure 2). In tinnitus patients, the identified auditory network encompassed all previously mentioned areas (excluding the anterior cingulate cortex) and included also the brainstem, thalamus, nucleus accumbens (NAc), isthmus of cingulate gyrus, right occipital, parietal and prefrontal cortices (Table 3, figure 2).
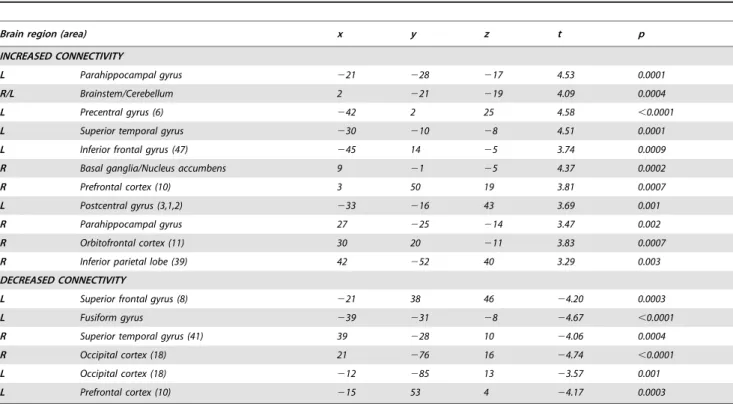
Chronic tinnitus patients, as compared to controls, showed increased connectivity in the brainstem, cerebellum, right basal ganglia/NAc, parahippocampal areas, right frontal and parietal areas, left sensorimotor areas and left superior temporal region. Tinnitus patients showed decreased connectivity in right primary auditory cortex, left fusiform gyrus, left frontal and bilateral occipital regions (Table 4, figure 3, figure S1).
Discussion
When analyzing spontaneous BOLD fluctuations using fMRI, special care should be taken to disentangle signal changes related to spontaneous neural activity from those related to scanner instability or physiological artifacts due to respiratory, cardiac or motor activity. We here employed the independent component analysis algorithm, decomposing the acquired BOLD signal into different neuronal and non-neuronal components. The selection of the auditory network component was based on a previously published method that allows us to take into account both the spatial and temporal properties of the fMRI signal in order to automatically select the neuronal component of interest in a user-independent manner [26]. The prospectively studied convenience
Table 1. Tinnitus Population. Participant Sex Age (years) Tinnitus Ear Tinnitus duration (years) Tinnitus frequency (Hz) THI/TQ S core Initial onset related to Tinnitus loudness during scan (0–10) Patient # 1 F 4 4 Right 9 8000 58/35 Unknown 7 Patient # 2 M 4 7 Right 33 3000 38/22 Unknown 10 Patient # 3 M 3 6 Left 1.75 2500 84/58 Sudden d eafness 6.5 Patient # 4 M 6 6 Left 2 4000 80/56 Earwax extraction 8 Patient # 5 M 6 7 Left 3.75 1500 30/26 Noise trauma 5 Patient # 6 M 5 7 Bilateral 2 8000 50/52 Unknown 6.5 Patient # 7 M 5 0 Right 10 6000 38/29 Stress 3 Patient # 8 F 6 0 Bilateral . 20 4000 20/20 Fatigue 3 Patient # 9 F 4 2 Right 2.4 3000 40/34 Noise trauma 2.5 Patient # 10 M 3 3 Left 3.5 8000 32/22 Unknown 4 Patient # 11 F 6 0 Bilateral 5 3000 36/21 Unknown 4.5 Patient # 12 F 6 6 Left 2 6000 16/18 Hypoacousis 4 Patient # 13 F 5 2 Left 5 6000 44/22 Arnold’s n euralgia 5 doi:10.1371/journal.pone. 0036222.t001
sample of chronic tinnitus patients included subjects with different characteristics regarding tinnitus laterality, frequency and type (pure tone or white noise). Moreover, when looking at the Tinnitus Handicap Inventory and the Tinnitus Questionnaire scores, one could argue that our population was not homogenous regarding the impact of tinnitus on patients’ life. This patient inhomogeneity could affect our results mainly by increasing variance and hence decreasing sensitivity. Future studies in larger patient cohorts should aim to correlate specific tinnitus characteristics (such as intensity, localization, type of sound, duration, coping, treatment response) with fMRI BOLD activity.
With the present study we provide evidence for a distributed cerebral network associated with tinnitus. Our data corroborate the hypothesized implication of non-auditory regions in tinnitus physiopathology as proposed by Jastreboff et al [32,33] (including
participation of auditory, limbic, prefrontal areas and autonomic nervous system); Rauschecker et al [34] (suggesting the implication of the NAc and associated paralimbic structures) and De Ridder et al [35] (considering phantom perception -including tinnitus- as a consequence of dysfunction in multiple parallel overlapping dynamic networks -i.e., perception, salience, distress and memory networks-).
The auditory network identified in healthy controls is in line with previous studies using ‘‘resting state’’ fMRI [11,12,13,36]. The observed connectivity impairment in auditory cortex corrob-orates previous human studies. MEG [37] and EEG studies [38] have demonstrated gamma band activity changes in auditory areas of tinnitus patients and several PET studies have identified primary auditory cortex dysfunction in tinnitus [39,40,41,42].
Figure 2. Regions of the auditory resting state network identified in controls and chronic tinnitus patients. doi:10.1371/journal.pone.0036222.g002
Our finding of increased connectivity in tinnitus encompassing parahippocampal areas is in accordance with a previous PET study showing increased blood flow in hippocampal areas during tinnitus modified by oral facial movement [40]. Similarly, using EEG, Vanneste et al [8] reported an increase in gamma band frequency in parahippocampal regions and an increase in
connectivity between the latter and auditory cortices in tinnitus patients as compared to controls. In fact, primate anatomical studies demonstrated reciprocal connections between parahippo-campal regions and associative auditory cortices [43]. Interesting-ly, De Ridder et al [44], showed that selective amobarbital
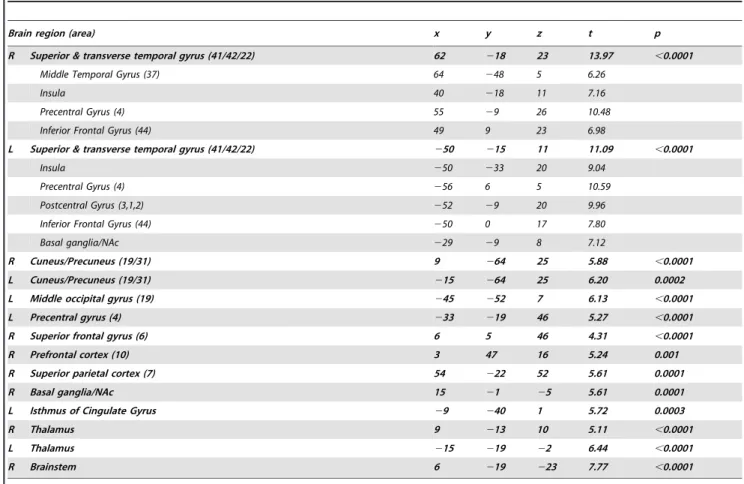
Table 3. Peak voxels and local maxima of the auditory resting state network identified in the tinnitus patients.
Brain region (area) x y z t p
R Superior & transverse temporal gyrus (41/42/22) 62 218 23 13.97 ,0.0001
Middle Temporal Gyrus (37) 64 248 5 6.26
Insula 40 218 11 7.16
Precentral Gyrus (4) 55 29 26 10.48
Inferior Frontal Gyrus (44) 49 9 23 6.98
L Superior & transverse temporal gyrus (41/42/22) 250 215 11 11.09 ,0.0001
Insula 250 233 20 9.04
Precentral Gyrus (4) 256 6 5 10.59
Postcentral Gyrus (3,1,2) 252 29 20 9.96
Inferior Frontal Gyrus (44) 250 0 17 7.80
Basal ganglia/NAc 229 29 8 7.12
R Cuneus/Precuneus (19/31) 9 264 25 5.88 ,0.0001
L Cuneus/Precuneus (19/31) 215 264 25 6.20 0.0002
L Middle occipital gyrus (19) 245 252 7 6.13 ,0.0001
L Precentral gyrus (4) 233 219 46 5.27 ,0.0001
R Superior frontal gyrus (6) 6 5 46 4.31 ,0.0001
R Prefrontal cortex (10) 3 47 16 5.24 0.001
R Superior parietal cortex (7) 54 222 52 5.61 0.0001
R Basal ganglia/NAc 15 21 25 5.61 0.0001
L Isthmus of Cingulate Gyrus 29 240 1 5.72 0.0003
R Thalamus 9 213 10 5.11 ,0.0001
L Thalamus 215 219 22 6.44 ,0.0001
R Brainstem 6 219 223 7.77 ,0.0001
Stereotaxic coordinates are in normalized Talairach space, p values are corrected for multiple comparisons at the whole brain level (FDR,0.05). doi:10.1371/journal.pone.0036222.t003
Table 2. Peak voxels and local maxima of the auditory resting state network identified in controls.
Brain region (area) x y z t p
R Superior & transverse temporal gyrus (41/42/22) 49 218 11 10.81 ,0.0001
Insula 46 212 11 10.76
Precentral gyrus (6) 58 26 11 9.59
Inferior frontal gyrus (45) 40 21 11 5.17
L Superior & transverse temporal gyrus (41/42/22) 244 26 11 10.56 ,0.0001
Transverse temporal gyrus (42) 259 221 17 4.93
Insula 241 218 11 10.12
Supramarginal gyrus (40) 247 215 14 8.43
Precentral gyrus (6) 253 26 8 8.50
L Cuneus (18) 26 288 37 7.35 ,0.0001
R Precentral gyrus (4) 45 213 58 6.11 ,0.0001
R Anterior Cingulate Cortex (24) 6 27 43 5.37 ,0.0001
Stereotaxic coordinates are in normalized Talairach space, p values are corrected for multiple comparisons at the whole brain level (FDR,0.05). doi:10.1371/journal.pone.0036222.t002
injections in the anterior choroidal artery (which supplies the amygdalohippocampal region) can suppress tinnitus.
We also found evidence of increased connectivity in the basal ganglia in a region close to the NAc, in line with a fMRI study using auditory stimulations reporting increased activation of the NAc in chronic tinnitus [45]. Rauschecker proposed a tinnitus model in which the NAc and its associated paralimbic networks in the medial prefrontal cortex play an important role. This theory suggests that, under normal circumstances, the tinnitus signal is cancelled out at the level of the thalamus by an inhibitory feedback loop originating in paralimbic structures. If the paralimbic regions are compromised, inhibition of the tinnitus signal at the thalamus gate is lost allowing the signal to reach the auditory cortex where it leads to permanent reorganization and chronic tinnitus [34]. Recently, Larson and colleagues [46] showed that electrical stimulation of the caudate nucleus triggered phantom sounds and modulated tinnitus loudness. These results indicate that the basal ganglia and the NAc might play a key role in tinnitus physiopathology, allowing or not the phantom auditory percept to reach conscious awareness.
The observed tinnitus-related connectivity changes involving the higher-order prefrontal and parietal associative cortices are in line with previous PET [39] and MEG studies [6,7,47]. Kleinjung and colleagues showed that tinnitus treatment with repetitive
transcranial magnetic stimulation applied on the temporal cortex is enhanced by additional stimulation of the prefrontal cortex [48]. The activation of these regions in tinnitus is consistent with the hypothesis that tinnitus might be associated with an inappropriate allocation of attentional resources, which maintain a sustained state of alertness. Indeed, a multimodal network consisting of temporo-parietal, frontal, and cingulate components is thought to play a key role in identifying and evaluating salient events in the sensory environment, independently of the stimulus modality [49]. Moreover, frontal lobe functioning has also been associated with emotions. An early study, by Beard et al [50], described the effect of frontal leucotomy as a treatment for tinnitus. The effect of frontal lobotomy on tinnitus distress is similar to the effect of lobotomy on pain perception [51]; it was believed to produce asymbolia for pain [52]. Similarly, frontal lobotomy might not alter the tinnitus percept but makes it bearable, dealing with the emotional-behavioral aspect of tinnitus.
Even if considered as the center of motor control, the cerebellum is known to play a role in purely sensory auditory processing [53]. The identified increased functional connectivity in the cerebellum confirms previous PET studies showing increased regional cerebral blood flow in cerebellum when the tinnitus is perceived [39,54,55]. At present, few neuroimaging studies in tinnitus reported our observed brainstem involvement. In humans,
Figure 3. Increased (in red) and decreased (in blue) functional connectivity in the auditory resting-state network in tinnitus. Results are thresholded at cluster level corrected p,0.05. 1- Brainstem/Cerebellum, 2-Basal ganglia/NAc, 3-Parahippocampal gyri, 4-Superior temporal gyrus, 5-Orbitofrontal cortex, 6-Prefrontal cortex, 7-Prefrontal cortex, 8-Superior frontal gyrus, 9-Inferior frontal gyrus, 10-Fusiform gyrus, 11-Superior temporal gyrus, 12-Postcentral gyrus, 13-Precentral gyrus, 14-Cuneus/Precuneus.
Lockwood et al [55] used PET to show increased blood flow in the brainstem (supposedly encompassing the cochlear nuclei) corre-lating with increased tinnitus induced by eye-movements. Finally, the shown connectivity changes within sensorimotor and visual areas could be seen in light of clinical studies showing that tinnitus can be evoked directly or modulated by inputs from somatosen-sory, somatomotor, and visual-motor systems in a proportion of individuals [56]. These observations give support to the concept that tinnitus could result from, or could be modified by crossmodal neural interactions.
In conclusion, we here provide fMRI evidence for a distributed network of auditory and non-auditory cortical and sub-cortical regions associated with chronic tinnitus. Our results suggest that the tinnitus percept is not only linked to activity in sensory auditory areas but is also associated to connectivity changes in limbic/parahippocampal areas, basal ganglia/NAc, higher-order prefrontal/parietal associative networks, infratentorial brainstem/ cerebellar and sensory-motor/visual-motor systems. These results show that there is a modification of cortical and subcortical functional connectivity in tinnitus encompassing attentional, mnemonic and emotional networks. Various tinnitus models suggested the implication of non-auditory regions in tinnitus physiopathology. Our data corroborate these hypotheses and suggest that, even if tinnitus can initially be a perceptual consequence of altered patterns of intrinsic neural activity generated along the central auditory pathway, various regions of the brain seem involved in the persistent awareness of the phenomenon as well as in the development of associated distress leading to disabling chronic tinnitus.
Supporting Information
Figure S1 Individual and mean beta-values for each of the cluster found to show significant increased and decreased connectivity in tinnitus as compared to controls. L Para- Left Parahippocampal gyrus; B/C- Brain-stem/Cerebellum; L Pre-Left Precentral gyrus; L STG-Left Superior temporal gyrus; L IFG-Left Inferior frontal gyrus; R BG/NAc-Right Basal ganglia/Nucleus accumbens; R Prefr-Right Prefrontal cortex; L Post-Left Postcentral gyrus; R Para-Right Parahippocampal gyrus; R Orbito-Right Orbitofrontal cortex; R IP-Rigth Inferior parietal lobe; L SFG-Left Superior frontal gyrus; L Fusi-Left Fusiform gyrus; R STG-Rigth Superior temporal gyrus; R Occ-Right Occipital cortex; L Occ- Left Occipital cortex; L Prefr-Left Prefrontal cortex.
(TIF)
Table S1 Regions of interest used for the auditory component selection.
(DOC)
Acknowledgments
The authors thank the technicians of the Department of Radiology for their active participation in the MRI studies in tinnitus patients. Author Contributions
Conceived and designed the experiments: AM PL AV SL AS. Performed the experiments: AM JC. Analyzed the data: AM AS AD SL. Contributed reagents/materials/analysis tools: AV JC PL AS. Wrote the paper: AM AS SL.
Table 4. Peak voxels of areas showing increased and decreased connectivity in tinnitus as compared to controls.
Brain region (area) x y z t p
INCREASED CONNECTIVITY
L Parahippocampal gyrus 221 228 217 4.53 0.0001
R/L Brainstem/Cerebellum 2 221 219 4.09 0.0004
L Precentral gyrus (6) 242 2 25 4.58 ,0.0001
L Superior temporal gyrus 230 210 28 4.51 0.0001
L Inferior frontal gyrus (47) 245 14 25 3.74 0.0009
R Basal ganglia/Nucleus accumbens 9 21 25 4.37 0.0002
R Prefrontal cortex (10) 3 50 19 3.81 0.0007
L Postcentral gyrus (3,1,2) 233 216 43 3.69 0.001
R Parahippocampal gyrus 27 225 214 3.47 0.002
R Orbitofrontal cortex (11) 30 20 211 3.83 0.0007
R Inferior parietal lobe (39) 42 252 40 3.29 0.003
DECREASED CONNECTIVITY
L Superior frontal gyrus (8) 221 38 46 24.20 0.0003
L Fusiform gyrus 239 231 28 24.67 ,0.0001
R Superior temporal gyrus (41) 39 228 10 24.06 0.0004
R Occipital cortex (18) 21 276 16 24.74 ,0.0001
L Occipital cortex (18) 212 285 13 23.57 0.001
L Prefrontal cortex (10) 215 53 4 24.17 0.0003
Stereotaxic coordinates are in normalized Talairach space (p values are cluster level corrected). doi:10.1371/journal.pone.0036222.t004
References
1. Moller (2011) Textbook of Tinnitus. New York: Springer.
2. Eggermont JJ, Roberts LE (2004) The neuroscience of tinnitus. Trends Neurosci
27: 676–682.
3. Adjamian P, Sereda M, Hall DA (2009) The mechanisms of tinnitus:
perspectives from human functional neuroimaging. Hear Res 253: 15–31.
4. Barrs D, Brackmann D (1984) Translabyrinthine nerve section: effect on
tinnitus. The Journal of Laryngology & Otology (Supplement). pp 287–293.
5. House JW, Brackmann DE (1981) Tinnitus: surgical treatment. Ciba Found
Symp 85: 204–216.
6. Schlee W, Mueller N, Hartmann T, Keil J, Lorenz I, et al. (2009) Mapping
cortical hubs in tinnitus. BMC Biol 7: 80.
7. Schlee W, Weisz N, Bertrand O, Hartmann T, Elbert T (2008) Using auditory
steady state responses to outline the functional connectivity in the tinnitus brain. PLoS One 3: e3720.
8. Vanneste S, van de Heyning P, De Ridder D (2011) The neural network of
phantom sound changes over time: a comparison between recent-onset and chronic tinnitus patients. Eur J Neurosci 34: 718–731.
9. Vanneste S, Focquaert F, Van de Heyning P, De Ridder D (2011) Different
resting state brain activity and functional connectivity in patients who respond and not respond to bifrontal tDCS for tinnitus suppression. Exp Brain Res 210: 217–227.
10. Biswal B, Yetkin FZ, Haughton VM, Hyde JS (1995) Functional connectivity in the motor cortex of resting human brain using echo-planar MRI. Magn Reson Med 34: 537–541.
11. Damoiseaux JS, Rombouts SA, Barkhof F, Scheltens P, Stam CJ, et al. (2006) Consistent resting-state networks across healthy subjects. Proc Natl Acad Sci U S A 103: 13848–13853.
12. De Luca M, Beckmann CF, De Stefano N, Matthews PM, Smith SM (2006) fMRI resting state networks define distinct modes of long-distance interactions in the human brain. Neuroimage 29: 1359–1367.
13. Beckmann CF, DeLuca M, Devlin JT, Smith SM (2005) Investigations into resting-state connectivity using independent component analysis. Philos Trans R Soc Lond B Biol Sci 360: 1001–1013.
14. van den Heuvel M, Mandl R, Hulshoff Pol H (2008) Normalized cut group clustering of resting-state FMRI data. PLoS One 3: e2001.
15. Laird AR, Fox PM, Eickhoff SB, Turner JA, Ray KL, et al. (2011) Behavioral interpretations of intrinsic connectivity networks. J Cogn Neurosci 23: 4022–4037.
16. Demertzi A, Soddu A, Faymonville ME, Bahri MA, Gosseries O, et al. (2011) Hypnotic modulation of resting state fMRI default mode and extrinsic network connectivity. Prog Brain Res 193: 309–322.
17. Boveroux P, Vanhaudenhuyse A, Bruno MA, Noirhomme Q, Lauwick S, et al. (2010) Breakdown of within- and between-network resting state functional magnetic resonance imaging connectivity during propofol-induced loss of consciousness. Anesthesiology 113: 1038–1053.
18. Zhou J, Greicius MD, Gennatas ED, Growdon ME, Jang JY, et al. (2010) Divergent network connectivity changes in behavioural variant frontotemporal dementia and Alzheimer’s disease. Brain 133: 1352–1367.
19. Greicius MD, Srivastava G, Reiss AL, Menon V (2004) Default-mode network activity distinguishes Alzheimer’s disease from healthy aging: evidence from functional MRI. Proc Natl Acad Sci U S A 101: 4637–4642.
20. Greicius MD, Flores BH, Menon V, Glover GH, Solvason HB, et al. (2007) Resting-state functional connectivity in major depression: abnormally increased contributions from subgenual cingulate cortex and thalamus. Biol Psychiatry 62: 429–437.
21. Vanhaudenhuyse A, Noirhomme Q, Tshibanda LJ, Bruno MA, Boveroux P, et al. (2010) Default network connectivity reflects the level of consciousness in non-communicative brain-damaged patients. Brain 133: 161–171.
22. Boly M, Tshibanda L, Vanhaudenhuyse A, Noirhomme Q, Schnakers C, et al. (2009) Functional connectivity in the default network during resting state is preserved in a vegetative but not in a brain dead patient. Hum Brain Mapp 30: 2393–2400.
23. Hunter MD, Eickhoff SB, Miller TW, Farrow TF, Wilkinson ID, et al. (2006) Neural activity in speech-sensitive auditory cortex during silence. Proc Natl Acad Sci U S A 103: 189–194.
24. Newman CW, Jacobson GP, Spitzer JB (1996) Development of the Tinnitus Handicap Inventory. Arch Otolaryngol Head Neck Surg 122: 143–148. 25. Hallam RS (1996) Manual of the Tinnitus Questionnaire (TQ). London:
Psychological Corporation.
26. Soddu A, Vanhaudenhuyse A, Bahri MA, Bruno MA, Boly M, et al. (2011) Identifying the default-mode component in spatial IC analyses of patients with disorders of consciousness. Hum Brain Mapp 33(4): 778–796.
27. Esposito F, Scarabino T, Hyvarinen A, Himberg J, Formisano E, et al. (2005) Independent component analysis of fMRI group studies by self-organizing clustering. Neuroimage 25: 193–205.
28. De Martino F, Gentile F, Esposito F, Balsi M, Di Salle F, et al. (2007) Classification of fMRI independent components using IC-fingerprints and support vector machine classifiers. Neuroimage 34: 177–194.
29. Goebel R, Esposito F, Formisano E (2006) Analysis of functional image analysis contest (FIAC) data with brainvoyager QX: From single-subject to cortically aligned group general linear model analysis and self-organizing group independent component analysis. Hum Brain Mapp 27: 392–401.
30. Forman SD, Cohen JD, Fitzgerald M, Eddy WF, Mintun MA, et al. (1995) Improved assessment of significant activation in functional magnetic resonance imaging (fMRI): use of a cluster-size threshold. Magn Reson Med 33: 636–647. 31. WHO (1991) Grades of hearing impairment. Hearing Network News 1. 32. Jastreboff PJ (1990) Phantom auditory perception (tinnitus): mechanisms of
generation and perception. Neurosci Res 8: 221–254.
33. Jastreboff PJ, Hazell JW (1993) A neurophysiological approach to tinnitus: clinical implications. Br J Audiol 27: 7–17.
34. Rauschecker JP, Leaver AM, Muhlau M (2010) Tuning out the noise: limbic-auditory interactions in tinnitus. Neuron 66: 819–826.
35. De Ridder D, Elgoyhen AB, Romo R, Langguth B (2011) Phantom percepts: tinnitus and pain as persisting aversive memory networks. Proc Natl Acad Sci U S A 108: 8075–8080.
36. Smith SM, Fox PT, Miller KL, Glahn DC, Fox PM, et al. (2009) Correspondence of the brain’s functional architecture during activation and rest. Proc Natl Acad Sci U S A 106: 13040–13045.
37. Weisz N, Muller S, Schlee W, Dohrmann K, Hartmann T, et al. (2007) The neural code of auditory phantom perception. J Neurosci 27: 1479–1484. 38. van der Loo E, Gais S, Congedo M, Vanneste S, Plazier M, et al. (2009)
Tinnitus intensity dependent gamma oscillations of the contralateral auditory cortex. PLoS One 4: e7396.
39. Mirz F, Pedersen B, Ishizu K, Johannsen P, Ovesen T, et al. (1999) Positron emission tomography of cortical centers of tinnitus. Hear Res 134: 133–144. 40. Lockwood AH, Salvi RJ, Coad ML, Towsley ML, Wack DS, et al. (1998) The
functional neuroanatomy of tinnitus: evidence for limbic system links and neural plasticity. Neurology 50: 114–120.
41. Smits M, Kovacs S, de Ridder D, Peeters RR, van Hecke P, et al. (2007) Lateralization of functional magnetic resonance imaging (fMRI) activation in the auditory pathway of patients with lateralized tinnitus. Neuroradiology 49: 669–679.
42. Reyes SA, Salvi RJ, Burkard RF, Coad ML, Wack DS, et al. (2002) Brain imaging of the effects of lidocaine on tinnitus. Hear Res 171: 43–50. 43. Engelien A, Stern E, Isenberg N, Engelien W, Frith C, et al. (2000) The
parahippocampal region and auditory-mnemonic processing. Ann N Y Acad Sci 911: 477–485.
44. De Ridder D, Fransen H, Francois O, Sunaert S, Kovacs S, et al. (2006) Amygdalohippocampal involvement in tinnitus and auditory memory. Acta Otolaryngol Suppl. pp 50–53.
45. Leaver AM, Renier L, Chevillet MA, Morgan S, Kim HJ, et al. (2011) Dysregulation of limbic and auditory networks in tinnitus. Neuron 69: 33–43. 46. Larson PS, Cheung SW (2011) Deep brain stimulation in area LC controllably
triggers auditory phantom percepts. Neurosurgery 70(2): 398–405.
47. Weisz N, Moratti S, Meinzer M, Dohrmann K, Elbert T (2005) Tinnitus perception and distress is related to abnormal spontaneous brain activity as measured by magnetoencephalography. PLoS Med 2: e153.
48. Kleinjung T, Eichhammer P, Landgrebe M, Sand P, Hajak G, et al. (2008) Combined temporal and prefrontal transcranial magnetic stimulation for tinnitus treatment: a pilot study. Otolaryngol Head Neck Surg 138: 497–501. 49. Knight RT, Grabowecky MF, Scabini D (1995) Role of human prefrontal cortex
in attention control. Adv Neurol 66: 21–34; discussion 34-26.
50. Beard AW (1965) Results of leucotomy operations for tinnitus. J Psychosom Res 9: 29–32.
51. Murphy JP (1951) Frontal lobe surgery in treatment of intractable pain; a critique. Yale J Biol Med 23: 493–500.
52. Watts JW, Freeman W (1946) Psychosurgery for the relief of unbearable pain. J Int Coll Surg 9: 679–683.
53. Petacchi A, Laird AR, Fox PT, Bower JM (2005) Cerebellum and auditory function: an ALE meta-analysis of functional neuroimaging studies. Hum Brain Mapp 25: 118–128.
54. Osaki Y, Nishimura H, Takasawa M, Imaizumi M, Kawashima T, et al. (2005) Neural mechanism of residual inhibition of tinnitus in cochlear implant users. Neuroreport 16: 1625–1628.
55. Lockwood AH, Wack DS, Burkard RF, Coad ML, Reyes SA, et al. (2001) The functional anatomy of gaze-evoked tinnitus and sustained lateral gaze. Neurology 56: 472–480.
56. Cacace AT (2003) Expanding the biological basis of tinnitus: crossmodal origins and the role of neuroplasticity. Hear Res 175: 112–132.