Int. J. Electrochem. Sci., 12 (2017) 11042 – 11063, doi : 10.20964/2017.11.65
International Journal of
ELECTROCHEMICAL
SCIENCE
www.electrochemsci.orgSynthesis, Characterization and Inhibition Effect of a New
Schiff Base (E)-3-(((2-amino-4-methylphenyl)imino)methyl)
naphthalen-2-ol on the Corrosion of Carbon Steel X48 in acidic
medium
Mouzali Saida1,*, Haffar Djahida1, Bouzidi Leila1, Bouanane Zohra2
1 Laboratoire d’Electrochimie des Matériaux Moléculaires et des Complexes (LEMMC), Département de Génie des Procèdes, Faculté de Technologie, Université Ferhat Abbas, Sétif-1, 19000, Algeria. 2 Laboratoire des Matériaux Polymériques Multiphasiques (LMPMP), Département de Génie des Procédés. Faculté de Technologie, Université Ferhat Abbas. Sétif-1, 19000, Algeria.
*
E-mail: [email protected]
Received: 6 April 2017 / Accepted: 11 September 2017 / Published: 12 October 2017
In the present investigation a new Schiff base named (E)-3-(((2-amino-4-methylphenyl)imino) methyl)naphthalen-2-ol (L) was synthesized, characterized, and tested as a corrosion inhibitor for Carbon steel X48 in two medium 1 M HCl and 0.5 M H2SO4, the corrosion efficiency coefficient was evaluated using weight loss method, Tafel polarization and electrochemical impedance spectroscopy. The experimental results suggest that this compound is an efficient corrosion inhibitor in both acidic media, and the inhibition efficiency increases with the increase of inhibitor concentration. Inhibitor adsorption on the Carbon steel X48 surface follows Langmuir isotherm. Thermodynamic parameters such as Ea, ΔH0a, ΔS0a, ∆H°ads, ∆S°ads, ∆G°ads were obtained from Tafel polarization at different temperatures (25–55 °C). This confirms that the adsorption of the inhibitor on the surface is carried out by an intermediate adsorption between physisorption and chemisorption in both acids. The Correlation between theoretical results of the Density Functional Theory (DFT) and experimental results is discussed
Keywords: Synthesis; Schiff Base; Carbon steel; Acid solution; inhibition efficiency.
1. INTRODUCTION
There is no doubt that corrosion of metals and alloys leads to their metallic properties degradation, and makes them less effective. Consequently, the use of inhibitors is considered as one of the most practical methods for the protection against corrosion in acid media [1, 2]. In fact, inhibitors are compounds capable of controlling, reducing, or preventing when added to the medium in small
quantities the reactions between a metal and its surroundings. The most aggressive media of the metal are the acids, such as hydrochloric acid (HCl) and sulfuric acid (H2SO4); those lasts are often used as industrial surface cleaners and picklings [3].
Schiff bases are organic molecules with an azomethine bond (C=N) and are considered to be the most effective, their action mode has been the subject of many works [4-7].
Many articles cite the use of Schiff bases as effective corrosion inhibitors for steel, copper and aluminum in acidic medium [8-12]. Benabid and al. [13] investigated the inhibition effect of a new synthesized Schiff base named 1,13-bis-[(2-hydroxynaphtaldehyde) 4,7,10-trioxatridecane diimine] (HNTTD) on mild steel X48 in 1 M hydrochloric acid solution, proving that inhibition efficiency increases with increasing inhibitor concentration, they also prove from the polarization curves that the studied compound was acting as mixed type inhibitor and the adsorption of HNTTD on steel surface followed Langmuir’s adsorption isotherm.
On the other hand, M.G. Hosseini and al. [14] studied the inhibitory action of three new Schiff bases viz N,ethylen-bis (salicylidenimine), N,isopropylien-bis (salicylidenimine), and N-acetylacetone imine, N-(2-hydroxybenzophenone imine) ortho-phenylen on mild steel corrosion in sulfuric acid. These Schiff bases function as good inhibitors reaching inhibition efficiencies of 97-98 % at 300 ppm concentration. The inhibitor adsorption of those three Schiff base follows Langmuir isotherm and thermodynamic calculations indicate the adsorption to be physical in nature.
The aim of this work is to study the corrosion inhibitive activity of a new synthesized Schiff base (E)-3-(((2-amino-4-methylphenyl)imino)methyl)naphthalen-2-ol on the corrosion of carbon steel X48 in two aggressive hydrochloric acid 1 M and sulfuric acid 0,5 M medium using electrochemical techniques (polarization curves and impedance spectroscopy) and by weight loss method (gravimetry), and some thermodynamic values (Ea, ΔH0a, ΔS0a, ∆H°ads, ∆S°ads, ∆G°ads) were deduced from adsorption isotherms
The Density Functional Theory method (DFT) was adopted to confirm the existence of correlation between the molecular structure of the tested compounds and its inhibitory activity.
2. EXPERIMENTAL
2.1. Materials and physical measurements
All starting materials and solvents were purchased from Merck or Aldrich and were used without further purification. Elemental Analysis System (C, H, N, S) were carried out on a "2400 Elemental Analyzer" Perkin Elmer. Melting point of the ligand was determined on a Kofler Bank 7779 apparatus. IR spectra were obtained with an FT/IR-JASCO 4200 instrument in 500-4000 cm-1range. The UV spectrum was recorded in ethanol on a U-650 JASCO spectrophotometer. 1H NMR spectra was recorded on a Bruker Avance DPX250 spectrometer (working frequency 250 MHz) at 25 °C.
2.2. Media
The inhibitor solutions of Schiff base were prepared in 0.5 M sulfuric acid (H2SO4 98 %) and 1M Hydrochloric acid (HCl 37 %). For each experiment, a freshly prepared media was used under air atmosphere without stirring. The concentration range of Schiff base inhibitor employed was varied from 10-5 M to 7.5 10-4 M, this series was determined after experimenting the inhibitor solubility in the corrosive medium.
2.3. Synthesis of Schiff base (E)-3-(((2-amino-4-methylphenyl)imino)methyl)naphthalen-2-ol (L) Schiff base (E)-3-(((2-amino-4-methylphenyl)imino)methyl)naphthalen-2-ol (L) was synthesized according to the operating mode described in the literature [15, 16]. The reaction is conducted under stirring and refluxing. A (1 mmol, 0.122 g) diamine a 4-methyl-o-phenylenediamine in 30 ml absolute methanol solution is added, drop by drop to a 2-hydroxy naphthaldehyde (1mmol, 0.172g) in 10 ml absolute methanol solution. The mixture is refluxed and stirred for one hour while maintaining the solution temperature at 50 °C. At the end of reaction, a precipitate of orange color is obtained which, after cooling, is filtered, twice washed in methanol then dried under vacuum. The final product is recovered with: yield 80 %; M.p. 195 °C; IR (ν cm-1): 3397 (OH), 3318 (NH)s - 3218 (NH)as, 1648 (C=N), 1604 (C=C), 1604 (C=C); UV-Vis (Ethanol, λmax nm): λmax (222), λmax (318), λmax (443); 1H NMR (300 MHz, MeOH, δ ppm, J Hz): 15.66 (s, 1H, OH), 9.59 (s, 1H, CH=N), 8.50 (d, J = 8.22 Hz, 1H), 7.93 (d, J = 9.08 Hz, 1H, ), 7.82 (d, 8.20,1H), 7.55 (ddd, J = 8.43, 6.92, 1.39 Hz, 1H), 7.44-7.31 (m, 2H), 7.09 (d, J = 9.07 Hz, 1H), 6.67 (s, 1H), 6.54 (dd, J = 8.04, 1.27 Hz, 1H), 5.05 (s, 2H, NH2), 2.23 (s, 3H, CH3); Elemental analysis calculated for C18H16ON2: (M = 276.35 g/mol): C, 78.26; H, 5.79; N, 10.14 %; found: C, 78.44; H, 5.45; N, 10.16 %.
2.4. Gravimetric measurement
The study of the concentration effect on the corrosion inhibitive activity of the tested compound consists in immersing carbon steel X48 samples of 9.106 cm2 surface in acid in absence and presence of various inhibitor concentrations. The inhibition efficiency is determined after six hours immersion at 25 °C.
Gravimetric tests have been carried out in a 50 ml beaker. The electrolyte volume is 30 ml. Samples are immersed in oblique position, in the corrosive solution in absence and in presence of inhibitor. Before- each measure, the sample surface is polished using abrasive papers with various granulometries (from 800 to 2000), then washed with bidistilled water, degreased with acetone and dried under airflow. The sample is then weighed and immediately introduced into the electrolyte.
2.5. Electrochemical measurement
following composition: C 0.52-0.50 %, Mn 0.5-0.80 %, Si 0.40 %, P 0.035%, S ≤ 0.035% and the remaining amount is Fe, of 0.19 cm2 surface. At the end of each manipulation, the working electrode surface is carefully cleaned using abrasive paper with various grain sizes 800,1200 and 2000), then rinsed several times with bi-distilled water and acetone, and finally dried with Josef paper.
The electrochemical experiments were carried out on a VoltaMaster 4 software controlled Voltalab 40 and were conducted in a 200 ml volume cylindrical three-electrode cell with a double-envelope Pyrex glass cover. Reference electrode is a saturated calomel electrode (SCE), the counter-electrode is a graphite bar and the working counter-electrode is a 0.19 cm2 active surface disc-like steel.
Polarization curves are drawn in a potential range from -700 to -300 mV/SCE, with a 0.5 mV/s scan step at various temperatures between 25 °C and 55 °C.
Electrochemical impedance measurements are realized after 30 minutes immersion of the material into the acidic medium by analyzing the frequency response of the electrochemical system in the range of 100 kHz to 0.1 Hz at 10 mV amplitude with 5 points by decade.
2.6. Quantum chemical calculations
The geometrically optimization of the studied Schiff base was done by Gaussian09 [17] software, using the density functional theory (DFT) with the B3LYP/6-31G (d,p) level. The energy of the highest occupied molecular orbital (EHOMO), the energy of the lowest unoccupied molecular orbital
(ELUMO), ΔE=ELUMO-EHOMO , the dipolar moment (μ) and the fraction of electrons transferred (ΔN)
were used to analyze the inhibition capability. 3. RESULTS AND DISCUSSION
The Schiff base ligand L synthesis, named (E)-3-(((2-amino-4-methylphenyl)imino)methyl) naphthalen-2-ol consists in making contact between an aromatic diamine a 4-methyl-o-phenylenediamine, and a 2-hydroxy naphthaldehyde in heated methanol (Scheme 1).
3.1. Structural confirmation of the investigated compound 3.1.1. FT-IR spectra
the FT-IR spectra of this ligand indicated the formation of the Schiff base product by the absence of the carbonyl group (1700 cm-1) band and the appearance of a new band at 1648 cm-1, assignable to the ʋ(C=N)imine group [18]. There are other informative peaks to be expected in the region 3397-3218cm-1attributed to the stretching vibration of hydrogen bonded of OH group and the N-H stretching band. Absorption bands attributed to imine ʋ(C=N) and phenolic ʋ(C–O) groups suggested that Schiff base L exist in the solid state as OH tautomer [19].
3.1.2. 1H-NMRspectra and elemental analysis
The 1H-NMR spectra in methanol showed a singlet peak at 9.59 ppm which can be attributed to the imine proton (HC=N) [20]. In addition, two singlets peaks at around 5.0 ppm and 2.13 ppm have also been observed which can be attributed to the amine (NH2) and methyl (CH3) groups respectively [21]. All the other aromatic protons were observed in the expected regions [19, 22].
Elemental analysis as well as spectroscopic data of this compound is in full agreement with the formulated structure.
3.2. Weight loss measurement (Gravimetric study)
Weight loss measures are a preliminary approach to study the metal corrosion inhibition in an electrolytic solution, the method advantage is its easy processing which needs no complex apparatus.
The corrosion rate (w) is determined by the following equation (1): (1)
Δm = m1 – m2
Δm: Masse loss in mg.
m1: initial mass before immersion in mg, m2: final mass after a time t of the sample immersion
in the solution in mg, s exposed surface in cm2 and t: exposition time in the solution in hour.
The inhibition efficiency ηw (%) of the studied compound is calculated using the following
equation (2):
(2)
w0 and wi represent respectively, the corrosion rate values in absence and in presence of
inhibitor.
The corrosion rate w (mg.cm-2.h-1) and the inhibitive efficacy ηw obtained for the ligand L at
various concentrations towards the carbon steel X48 corrosion in HCl 1 M and H2SO4 0.5 M at 25 °C are summarized in Table 1.
Table 1. Corrosion parameters for Carbon steel X48 in aqueous solution of 1 M HCl and 0.5 m H2SO4 in absence and presence of different concentrations of ligand L from weight loss measurements at 25 °C for 6 h.
Acid solution Inhibitor concentration (M) W (mg.cm-2.h-2) ηw (%)
1 M HCl 00 0.272 10-5 0.089 67.03 5.10-5 0.051 81.11 10-4 0.023 91.34 5.10-4 0.015 94.20 7,5 .10-4 0.006 97.72 0.5 M H2SO4 00 0.265 10-5 0.121 54.31 5.10-5 0.093 64.60 10-4 0.071 73.20 5.10-4 0.035 86.89 7,5.10-4 0.020 92.42
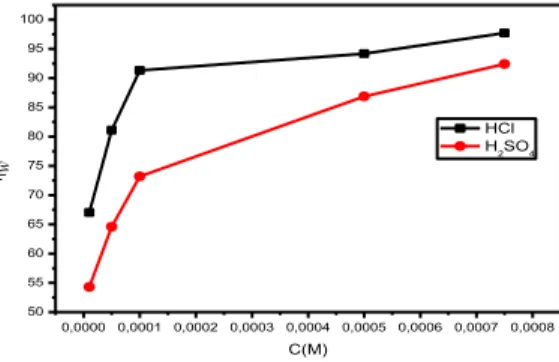
The variation in inhibition efficiency with concentration of ligand L is shown in Fig. 1, it can be seen that ηw increases sharply with an increase in concentration, especially in 1 M HClsolution.
0,0000 0,0001 0,0002 0,0003 0,0004 0,0005 0,0006 0,0007 0,0008 50 55 60 65 70 75 80 85 90 95 100 w C(M) HCl H2SO4
Figure 1. Plot of variation of inhibition efficiency with concentration of inhibitor L in 1 M HCl and 0.5 M H2SO4 at 25 0C
The inhibition efficiency ηw achieves a maximum value of 97.72 % in HCl 1M and 92.42% in
H2SO4 0.5 M at a concentration of 7,5.10-4 M. It is noticed, that the ligand inhibits the steel corrosion in both considered media. This behavior may be explained by a significant adsorption of the inhibitor at the carbon steel X48 surface, ηw values at any inhibitor concentration are higher in 1 M HCl solution than that in 0.5 M H2SO4 solution, well noticed at low concentration.
3.3. Electrochemical impedance spectroscopy (stationary method)
To confirm the results of weight loss measurement sand achieve more information on the corrosion mechanism (phrase incomprehensible), electrochemical techniques were used as a more complete method (electrochemical impedance spectroscopy and polarization curves).
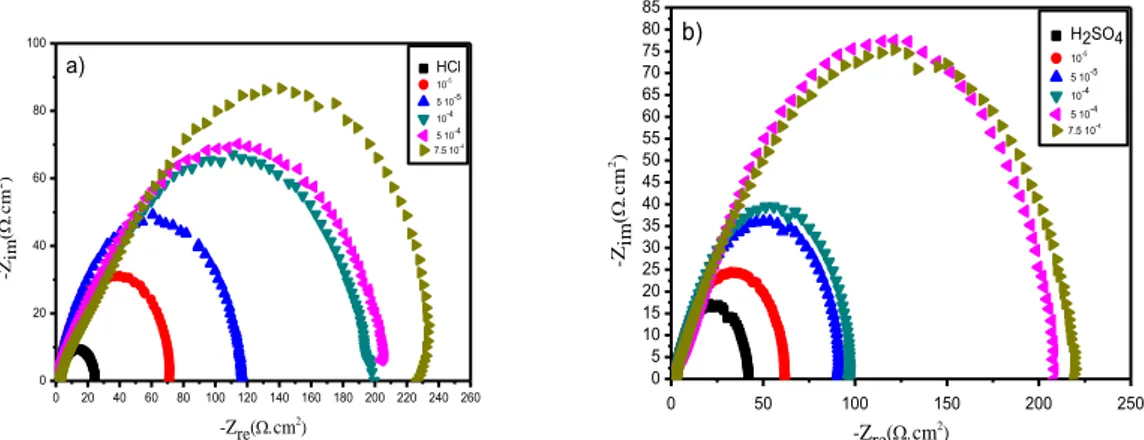
The electrochemical impedance spectroscopy diagrams obtained at open circuit potential, recorded after 30 minutes immersion in HCl 1 M and H2SO4 0.5 M media at 25 °C with and without various concentrations of the compound L are shown in Fig. 2.
0 20 40 60 80 100 120 140 160 180 200 220 240 260 0 20 40 60 80 100 HCl 10-5 5 10-5 10-4 5 10-4 7.5 10-4 -Z im cm 2) -Zre(cm2 ) a) 0 50 100 150 200 250 0 5 10 15 20 25 30 35 40 45 50 55 60 65 70 75 80 85 H2SO4 10-5 5 10-5 10-4 5 10-4 7.5 10-4 -Z im cm 2) -Zre(cm2) b)
Figure 2. Nyquist plot at different concentrations of inhibitor L in 1 M HCl (a) and 0.5 M H2SO4 (b) solution at 25 °C
Nyquist spectrum appears as a unique capacitive loop which confirms that Carbon steel X48 corrosion in acid medium with and without inhibitor is mainly controlled by charge transfer process [23]. These diagrams have a similar shape for all concentrations, indicating there is no change during the entire corrosion mechanism. Besides, these Nyquist curves are not perfect semi-circles due to the electrode heterogeneous surface. This heterogeneity may be due to the surface roughness, impurities, inhibitor adsorption and desorption phenomena, formation of porous layers and the carbon steel chemical composition [24].
The semi-circle diameter is larger in the presence of inhibitor than that observed in the blank solution (in HCl 1M and H2SO4 0.5 M medium) which increases with the increase of the concentration. This could be related to the increase in the surface coverage of steel by inhibitory molecule.
The charge transfer resistance values are calculated up on impedance difference for high and low frequencies on real axis. The corrosion inhibition efficiency of steel is calculated from the charge transfer resistance according to the equation (3):
(3)
Rct0 and Rcti are respectively, the charge transfer resistance values of carbon steel after
immersion in absence and in presence of inhibitors.
HCl 1 M and H2SO4 0.5 M medium are listed in Table 2.
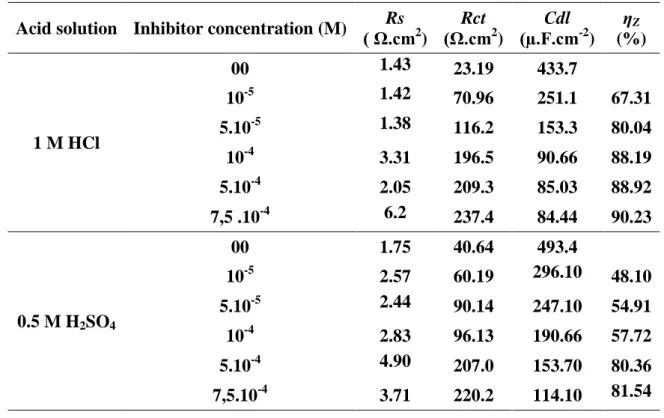
Table 2. Impedance parameters and inhibition efficiency values for carbon steel X48 after 30 min immersion period in 1 M HCl and 0.5 M H2SO4 in absence and presence of different concentrations of inhibitor L at 25 °C
Acid solution Inhibitor concentration (M) ( Ω.cmRs 2
) Rct (Ω.cm2 ) Cdl (µ.F.cm-2 ) ηZ (%) 1 M HCl 00 1.43 23.19 433.7 10-5 1.42 70.96 251.1 67.31 5.10-5 1.38 116.2 153.3 80.04 10-4 3.31 196.5 90.66 88.19 5.10-4 2.05 209.3 85.03 88.92 7,5 .10-4 6.2 237.4 84.44 90.23 0.5 M H2SO4 00 1.75 40.64 493.4 10-5 2.57 60.19 296.10 48.10 5.10-5 2.44 90.14 247.10 54.91 10-4 2.83 96.13 190.66 57.72 5.10-4 4.90 207.0 153.70 80.36 7,5.10-4 3.71 220.2 114.10 81.54
From Table 2, it can be noticed that:
-The inhibition efficiency ηz increases with the inhibitor L concentration and achieves a
maximum value of 90.23 % in HCl 1M and 81.54 % in H2SO4 0.5 M at 7,5.10-4 M. This result is in agreement with those found by gravimetric measurements.
-The charge transfer resistance (Rct) increases significantly with the increasing inhibitor concentration, whereas the double-layer capacity decreases when the inhibitor is added.
-The decreasing in the double-layer capacity (Cdl) is due to the inhibitor adsorption at the steel surface which reduces the dielectric constant of the medium and/or increases the electric double-layer width, suggesting that the L molecule acts by adsorption at the metal/solution interface.
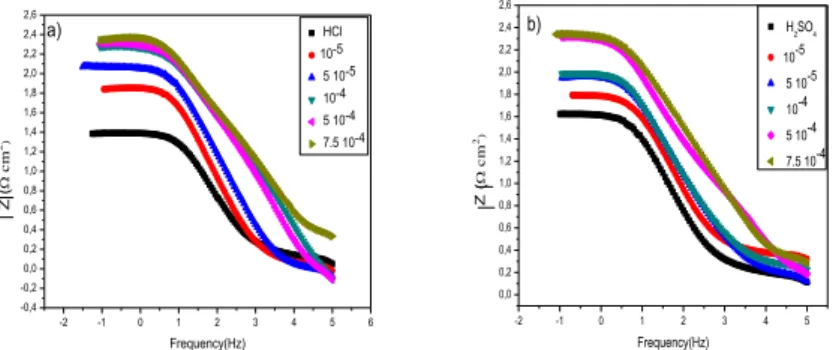
The same behavior is shown on the Bode-modulus plots (Fig. 3). Indeed, Inhibition effect of the inhibitor can easily be observed from the low frequency impedance modulus [25]. The low frequency impedance modulus increases with increasing the concentration of the inhibitor, which demonstrates that the adsorption of the inhibitor improves corrosion resistance of carbon steel in 1 M HCl and 0.5 M H2SO4 [26].
-2 -1 0 1 2 3 4 5 6 -0,4 -0,2 0,0 0,2 0,4 0,6 0,8 1,0 1,2 1,4 1,6 1,8 2,0 2,2 2,4 2,6 HCl 10-5 5 10-5 10-4 5 10-4 7.5 10-4 Z ( cm 2) Frequency(Hz) a) -2 -1 0 1 2 3 4 5 0,0 0,2 0,4 0,6 0,8 1,0 1,2 1,4 1,6 1,8 2,0 2,2 2,4 2,6 Z ( cm 2) Frequency(Hz) H2SO4 10-5 5 10-5 10-4 5 10-4 7.5 10-4 b)
Figure 3. Bode plot at different concentrations of inhibitor L in 1 M HCl (a) and 0.5 M H2SO4 (b) solution at 25 °C
3.4. Polarization curves
The polarization curves in absence and in presence of ligand L, at various concentrations between 10-5 M and 7,5.10-4 M, in HCl 1M and H2SO4 0.5 M of Carbon steel at 25 °C, are reported in Fig. 4. From the obtained results, it can be noticed that the addition of the compound L results systematically by a decrease of the anodic and cathodic current densities. This may be due to the adsorption of the inhibitor on the corroded surface [27].
-580 -560 -540 -520 -500 -480 -460 -440 -420 -400 -4,0 -3,5 -3,0 -2,5 -2,0 -1,5 -1,0 -0,5 0,0 0,5 1,0 HCl 10-5 5 10-5 10-4 5 10-4 7.5 10-4 L o g i c o r r ( m A .c m -2 ) E(mV) a) -600 -580 -560 -540 -520 -500 -480 -460 -440 -420 -3,0 -2,5 -2,0 -1,5 -1,0 -0,5 0,0 0,5 1,0 L o g ic o r r ( m A .c m -2 ) E(mV) H2SO4 10-5 5 10-5 10-4 5 10-4 7.5 10-4 b)
Figure 4. Tafel plot of Carbon steel X48 with different concentrations of inhibitor L in 1 M HCl (a) and 0.5 M H2SO4 (b) solution
The inhibition efficiency ηp obtained from the potentiodynamic polarization curves was calculated according to the following equation (4):
(4)
Where i°corr and icorr are the corrosion current densities values obtained by extrapolation of the
linear portions of the anodic current–potential curves to the corresponding corrosion potentials (Ecorr),
during 30 minutes immersion in acid medium (HCl 1 M and H2SO4 0.5 M) respectively in absence and in presence of inhibitor L.
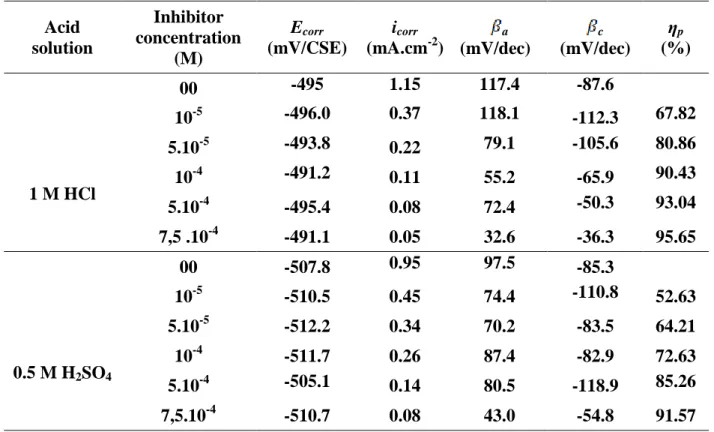
The various ligand L corrosion parameters in both media HCl 1 M and H2SO4 0.5 M obtained using this method, such as the corrosion potential Ecorr (mV), Tafel cathodic βc (mV/dec) and anodic βc
(mV/dec) slope, the corrosion current density icorr (mA.cm-2) and the inhibitive efficacy ηp (%) for
various concentrations are reported in the Table 3. It is obvious that the corrosion current density values (icorr) decreased from 1.15 mA.cm-2 to 0.055 mA.cm-2 and from 0.95 mA.cm-2 to 0.085 mA.cm-2
for a concentration of 7,5.10-4 M of ligand L in HCl 1 M and H2SO4 0,5 M respectively (Table 3).
Table 3. Polarization parameters and inhibition efficiency values for Carbone steel X48 after 30 minutes immersion period in 1 M HCl and 0.5 M H2SO4 in absence and presence of different concentrations of inhibitor L at 25 °C Acid solution Inhibitor concentration (M) Ecorr (mV/CSE) icorr (mA.cm-2) a (mV/dec) c (mV/dec) ηp (%) 1 M HCl 00 -495 1.15 117.4 -87.6 10-5 -496.0 0.37 118.1 -112.3 67.82 5.10-5 -493.8 0.22 79.1 -105.6 80.86 10-4 -491.2 0.11 55.2 -65.9 90.43 5.10-4 -495.4 0.08 72.4 -50.3 93.04 7,5 .10-4 -491.1 0.05 32.6 -36.3 95.65 0.5 M H2SO4 00 -507.8 0.95 97.5 -85.3 10-5 -510.5 0.45 74.4 -110.8 52.63 5.10-5 -512.2 0.34 70.2 -83.5 64.21 10-4 -511.7 0.26 87.4 -82.9 72.63 5.10-4 -505.1 0.14 80.5 -118.9 85.26 7,5.10-4 -510.7 0.08 43.0 -54.8 91.57
Polarization anodic and cathodic curves show that the addition of inhibitor L causes a decrease of anodic and cathodic current densities and modifies slightly the corrosion potential values (Ecorr). This inhibitor may so be classified as a dual inhibitor in both media (HCl and H2SO4).
The inhibition efficiency ηp (%) is noticed to increase with the increasing inhibitor L
concentration. This ligand protects almost totally the metal against HCl and H2SO4 corrosive attack. It is to be noted that the inhibitor provides a better inhibitive efficiency in HCl than in H2SO4.This is probably due to the significant adsorption of SO42- ions much more voluminous than Cl- ions on the active sites at the steel surface at the expense of organic molecules [28]. This result indicates clearly that adding the L inhibitor reduces the anodic dissolution of steel and slows the evolution of H+ proton discharge. This may result in a formation of a layer adsorbed on the metal surface.
The results obtained by gravimetric and electrochemical measurements are seen to be in agreement to each other.
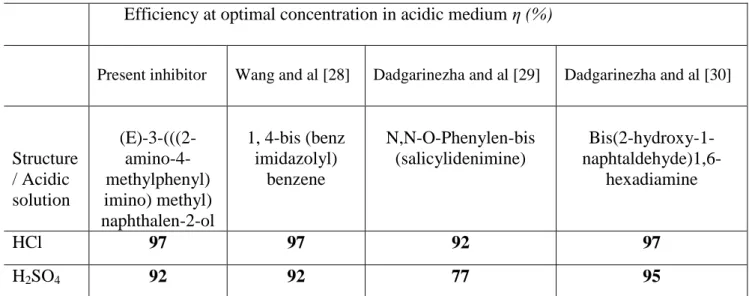
To confirm our results in the both media HCl and H2SO4, The comparison of previous studies results with those found for similar types of Schiff base compounds, we observe that from the data
presented in Table 4, these compounds are very good Inhibitors and behave better in HCl than in H2SO4 [28-30]. The good activity of the inhibitor could be attributed to the presence of C = N (imine) in the molecular structure and furthermore the substitution of -OH, -NH2 functions in its aromatic rings could increase the inhibitory performance of our Inhibitor and the three compounds reported in previous work.
Table 4. Comparison of the results obtained in this study by previous work for similar type of Schiff base compounds.
Efficiency at optimal concentration in acidic medium η (%)
Present inhibitor Wang and al [28] Dadgarinezha and al [29] Dadgarinezha and al [30]
Structure / Acidic solution (E)-3-(((2- amino-4-methylphenyl) imino) methyl) naphthalen-2-ol 1, 4-bis (benz imidazolyl) benzene N,N-O-Phenylen-bis (salicylidenimine) Bis(2-hydroxy-1-naphtaldehyde)1,6- hexadiamine HCl 97 97 92 97 H2SO4 92 92 77 95 3.5. Adsorption isotherms
The inhibition of the corrosion of metals by organic compounds is reflected in their adsorption. The latter appears under three well-known aspects: physisorption, chemical adsorption or mixed adsorption (physisorption tending to chemisorption or the inverse
Metal corrosion inhibition by organic compounds is reflected in their adsorption. The latter appears under three well known aspects: physisorption, chemical adsorption or mixed adsorption ( physisorption tending to chemisorption or the reverse). It depends on many factors such as the metal charge, its nature, the organic species chemical structure and the electrolyte type. It is generally accepted that the chemical adsorption process involves an electron transfer or sharing between the inhibitor molecules and the unsaturated "d" orbitals of the metal surface that allowing the formation of dative and covalent bonds, respectively.
The surface coverage values (θ) for various concentrations of the ligand in acid medium, obtained from the polarization curves, electrochemical impedance spectroscopy and gravimetric measurements at 25°C, were used to explain the best isotherm and to determine the adsorption process, it can be estimated using from the inhibitor efficiency as θ = η (%)/100.
During this investigation, Langmuir, Temken and Frinmkin isotherms have been tested in order to find the most suitable isotherm. Langmuir isotherm [31] was found to be the most appropriate and can be given by the following equation (5) [32, 33]:
(5)
Where Cinh the concentration of inhibitor is, Kads is the adsorption equilibrium constant, and θ is the surface coverage expressed by the ration η /100.
Fig. 5 shows that the variation of the ratio Cinh/ θ as a function of the inhibitor concentration Cinh is linear for the three methods studied at 25 °C. This indicates that the ligand L adsorption on the Carbon steel surface in HCl and H2SO4 follows Langmuir isotherm with linear correlation coefficients (R2 = 0.999) are close to 1 [34]. 0,0000 0,0001 0,0002 0,0003 0,0004 0,0005 0,0006 0,0007 0,0008 -10 0 10 20 30 40 50 60 70 80 90 grav tafel imp HCl C/ C(M) a) 0,0000 0,0001 0,0002 0,0003 0,0004 0,0005 0,0006 0,0007 0,0008 0 20 40 60 80 100 Grav taf imp H2SO4 C/ (M) C(M) b)
Figure 5. Langmuir adsorption of ligand on the steel surface in HCl 1M (a) and 0.5 M H2SO4 (b) solution using different methods.
From the intercepts of the straight lines Cinh/θ axis, the Kads values were calculated and given in Table 5. The adsorption constant Kads is related to the adsorption standard free energy (ΔG°ads) by the following equation (6)[35]:
(6)
Where R is the gas constant (8.314 J.mol-1.K-1), T the absolute temperature (K), and the value 55.5 represents the concentration of water in solution (mol.l-1) [35].
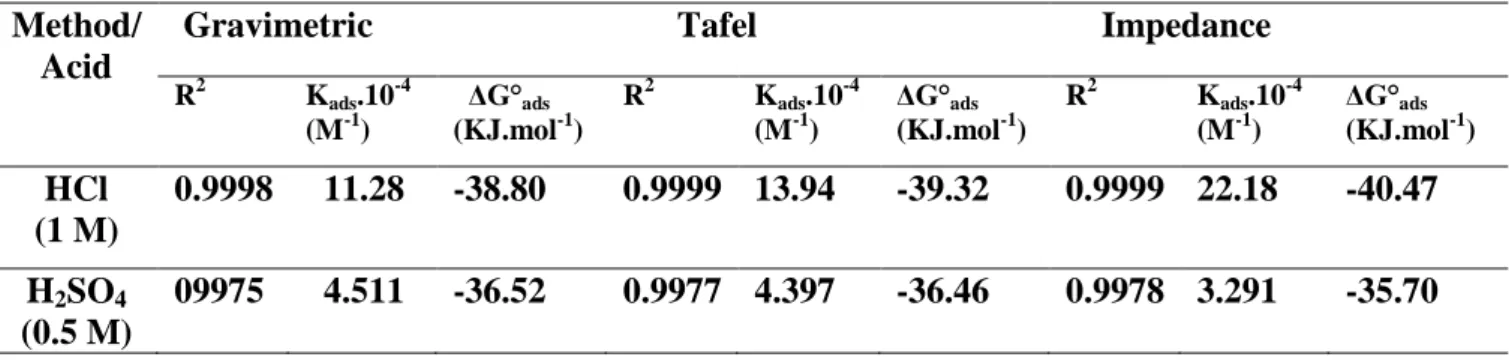
Adsorption constant values Kads, and standard free energy of adsorption (ΔG°ads) values calculated from Langmuir isotherms are reported in Table 5.
Table 5. Thermodynamic parameters for the adsorption of ligand in 1 M HCl and 0.5 M H2SO4 on the Carbon steel X48 at 25 °C
Method/ Acid
Gravimetric Tafel Impedance
R2 Kads.10 -4 (M-1) ΔG°ads (KJ.mol-1) R2 Kads.10 -4 (M-1) ΔG°ads (KJ.mol-1) R2 Kads.10 -4 (M-1) ΔG°ads (KJ.mol-1) HCl (1 M) 0.9998 11.28 -38.80 0.9999 13.94 -39.32 0.9999 22.18 -40.47 H2SO4 (0.5 M) 09975 4.511 -36.52 0.9977 4.397 -36.46 0.9978 3.291 -35.70
Generally, (ΔG°ads) values less or equal to -20 Kj.mol-1, are related to the interactions between the charged molecules and the metal charges (physisorption), however, those close to or greater than -40 kJ.mol-1, result in a charge transfer between the inhibitor molecules and the metal surface creating covalent or coordination bonds (chemisorption) [36 , 37].
In the present case, ΔGads values are noticed to be less than -40 Kj.mol-1in HCl and -36 Kj.mol-1 in H2SO4 (Table 5), which indicates that the inhibitor (L) is strongly adsorbed on the steel surface as a neutral molecule via chemisorption and physisorption mechanism [38].
Furthermore, negative values ΔG°ads (from -35.70 to -40.47 Kj.mol-1), and the high values of the adsorption constant Kads are indicative of the adsorption process spontaneity and the adsorbed layer on metal surface stability [38].
3.6. Effect of the temperature
The effect of temperature on the corrosion inhibitive activity of organic compounds in acid media is very important, which can modify the behavior of inhibitors. The temperature accelerates the corrosion reactions and can weaken the corrosion steel resistance.
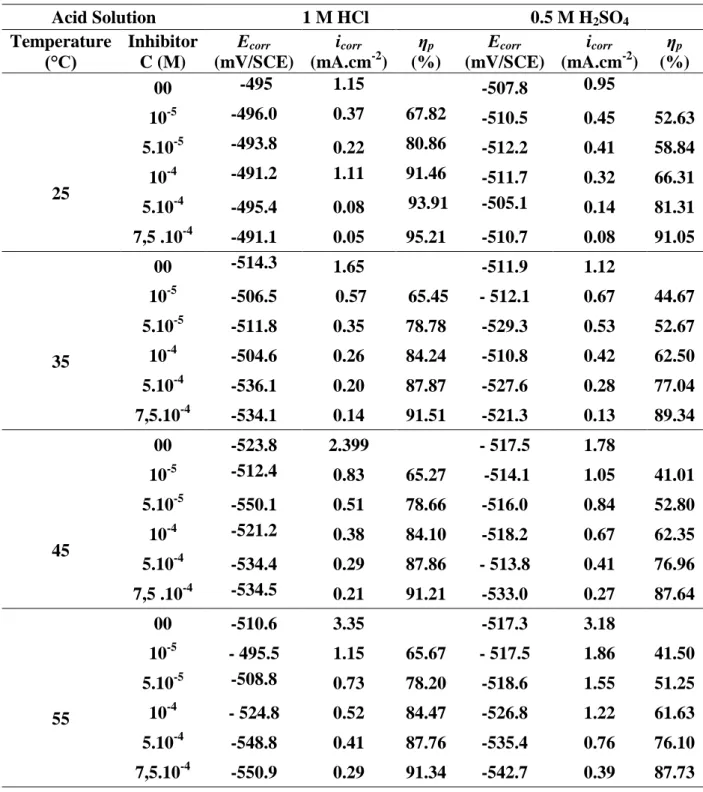
In the aim to study the influence of this parameter on the efficiency, a potentiodynamic analysis of steel in both media HCl and H2SO4, in absence and in presence of inhibitor L, studied at concentrations from 10-5 to 7,5.10-4 M and at various temperatures comprised between 25 °C and 55 °C. The electrochemical properties are gathered in Table 6.
Corrosion current density evolution in the corrosive medium only (HCl, H2SO4) shows a rapid and regular increase, confirming an increasing metal dissolution with the increasing temperature.
The increase in the corrosion current density with the temperature in presence of inhibitor is weaker than that in the reference. These results confirm that the studied compound inhibits the corrosion process in this temperature range [25, 35, 45 and 55 °C]. This result suggests that the inhibitor acts by both physical and chemical adsorption [39].
In HCl medium, the inhibition efficiency decreases from 95.21 % (25 °C) to 91.51 % (35°C), then becomes constant in the temperature range from 35 °C to 55 °C, but in H2SO4 medium, it decreases within the temperature range of 25 to 45 °C.
The temperature increase shifts the adsorption-desorption equilibrium in favor of the desorption process, thereby reducing the inhibitive potency of the compound (imine) [40, 41].
Many authors [42-44] use Arrhenius equation to define the temperature T effect on the corrosion current density in acid medium According to equation (7):
(7)
Table 6. Effect of temperature on electrochemical parameters and inhibition efficiency for carbon steel in 1 M HCl or 0.5 M H2SO4 in the absence and presence of ligand L
Acid Solution 1 M HCl 0.5 M H2SO4 Temperature (°C) Inhibitor C (M) Ecorr (mV/SCE) icorr (mA.cm-2) ηp (%) Ecorr (mV/SCE) icorr (mA.cm-2) ηp (%) 25 00 -495 1.15 -507.8 0.95 10-5 -496.0 0.37 67.82 -510.5 0.45 52.63 5.10-5 -493.8 0.22 80.86 -512.2 0.41 58.84 10-4 -491.2 1.11 91.46 -511.7 0.32 66.31 5.10-4 -495.4 0.08 93.91 -505.1 0.14 81.31 7,5 .10-4 -491.1 0.05 95.21 -510.7 0.08 91.05 35 00 -514.3 1.65 -511.9 1.12 10-5 -506.5 0.57 65.45 - 512.1 0.67 44.67 5.10-5 -511.8 0.35 78.78 -529.3 0.53 52.67 10-4 -504.6 0.26 84.24 -510.8 0.42 62.50 5.10-4 -536.1 0.20 87.87 -527.6 0.28 77.04 7,5.10-4 -534.1 0.14 91.51 -521.3 0.13 89.34 45 00 -523.8 2.399 - 517.5 1.78 10-5 -512.4 0.83 65.27 -514.1 1.05 41.01 5.10-5 -550.1 0.51 78.66 -516.0 0.84 52.80 10-4 -521.2 0.38 84.10 -518.2 0.67 62.35 5.10-4 -534.4 0.29 87.86 - 513.8 0.41 76.96 7,5 .10-4 -534.5 0.21 91.21 -533.0 0.27 87.64 55 00 -510.6 3.35 -517.3 3.18 10-5 - 495.5 1.15 65.67 - 517.5 1.86 41.50 5.10-5 -508.8 0.73 78.20 -518.6 1.55 51.25 10-4 - 524.8 0.52 84.47 -526.8 1.22 61.63 5.10-4 -548.8 0.41 87.76 -535.4 0.76 76.10 7,5.10-4 -550.9 0.29 91.34 -542.7 0.39 87.73
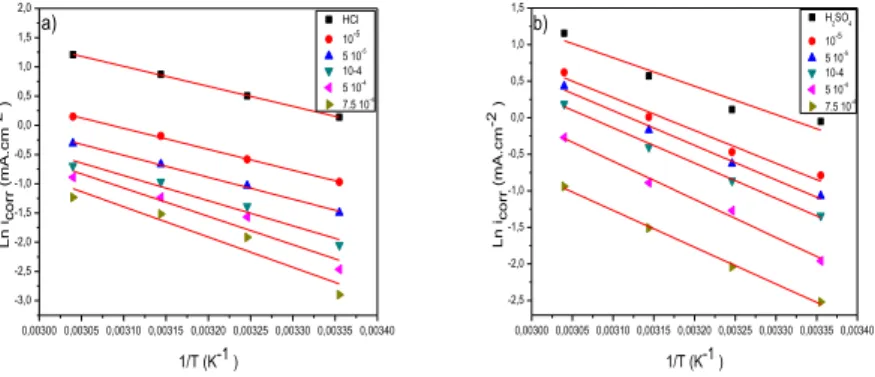
The activation energies shown in Table 6 were determined by linear regression between Lnicorr and 1 / T (Fig. 6) from the Arrhenius equation for various inhibitor L concentrations in two media (HCl and H2SO4). It is obvious that in presence of inhibitor, the activation energy values Ea are higher than those calculated with its absence in both media. This behavior is reported as being specific of a physisorption phenomenon of the inhibitor at the metal surface [46-49]. Adding the inhibitor L with increasing concentration in the two solution media HCl and H2SO4 increases the activation energy. This increase may be assigned to a significant decrease of the inhibitor adsorption on the steel surface
with the increasing temperature [50]. This phenomenon may be assigned by the fact that the steel corrosion process in presence of inhibitor depends not only on the reaction occurring at the bare metal surface, but also on Fe2+ ion diffusion through the adsorbed inhibitor layer.
0,00300 0,00305 0,00310 0,00315 0,00320 0,00325 0,00330 0,00335 0,00340 -3,0 -2,5 -2,0 -1,5 -1,0 -0,5 0,0 0,5 1,0 1,5 2,0 HCl 10-5 5 10-5 10-4 5 10-4 7.5 10-4 Ln ico rr ( m A. c m -2 ) 1/T (K-1 ) a) 0,00300 0,00305 0,00310 0,00315 0,00320 0,00325 0,00330 0,00335 0,00340 -2,5 -2,0 -1,5 -1,0 -0,5 0,0 0,5 1,0 1,5 H2SO4 10-5 5 10-5 10-4 5 10-4 7.5 10-4 Ln i co rr ( m A. c m -2 ) 1/T (K-1 ) b)
Figure 6. Arrhenius plot for Carbon steel X48 corrosion in the absence and presence of different concentrations of ligand L in 1 M HCl (a) and 0.5 M H2SO4 (b)
An alternative formula of Arrhenius’ equation allows determine the activation enthalpy ΔH°a and entropy ΔSa° according to the following equation [51]:
(8) h: Planck constant, N: Avogadro’s number.
The variation of Ln (icorr /T) as a function of the inverse of the temperature is a straight line (Fig. 7), with a slope equal to (ΔH°a/R) and an intercept (Ln R/Nh +ΔSa°/R) [51]. Thus, the values of ΔH°a and ΔS°a can be calculated.
3,00 3,05 3,10 3,15 3,20 3,25 3,30 3,35 3,40 -8,5 -8,0 -7,5 -7,0 -6,5 -6,0 -5,5 -5,0 -4,5 HCl 10-5 5 10-5 10-4 5 10-4 7.5 10-4 Ln (ico rr /T ) (m A. c m -2 . K -1) 1/T (K-1 ) a) 0,00300 0,00305 0,00310 0,00315 0,00320 0,00325 0,00330 0,00335 0,00340 -8,0 -7,5 -7,0 -6,5 -6,0 -5,5 -5,0 -4,5 b) H2SO4 10-5 5 10-5 10-4 5 10-4 7.5 10-4 Ln (ico rr /T ) (m A. c m -2 . K -1) 1/T (K-1 )
Figure 7. Transition state plot for Carbon steel corrosion in the absence and presence of different concentrations of ligand L in 1 M HCl (a) and 0.5 M H2SO4 (b)
The enthalpy ΔH°a and entropy ΔS°a values are given in Table 7. Positive signs of the enthalpies ΔH°a reflect the endothermic aspect of the steel dissolution process. In fact, the activation enthalpy ΔH°a increases with the concentration corresponds to a decrease in the metal dissolution [52]. This result shows that the activation energy values (Ea) are higher than their analogues of ΔH°a indicating that the corrosion process involves a gas reaction, forming H2. High negative values of the
entropy ΔS°a prove a decrease in disorder during the transformation of reactive into activated Fe-molecule complex in the solution [53].
Table 7. Activation parameters of the dissolution of carbon steel in 1 M HCl and 0.5 M H2SO4 in the absence and presence of different concentrations of ligand L
Acid solution Inhibitor concentration (M) Ea (KJ.mol-1) ΔH0 a (KJ.mol-1) ΔS0 a (KJ.mol-1) 1 M HCl 00 28.44 25.98 -156.43 10-5 29.81 26.87 -162.42 5 x 10⁻⁵ 31.29 29.33 -158.65 10-4 35.69. 37.86 -134.78 5 x 10⁻⁴ 40.35 37.78 -137.10 7.5 x 10⁻⁴ 43.39 40.18 -132.34 0.5 M H2SO4 00 32.66 30.09 -145.12 10-5 37.67 35.35 -133.39 5 x 10⁻⁵ 39.64 37.48 -128.27 10-4 40.36 36.29 -134.26 5 x 10⁻⁴ 43.49 41.10 -122.88 7.5 x 10⁻⁴ 42.14 39.70 -132.65
3.7. Adsorption isotherms at various temperatures
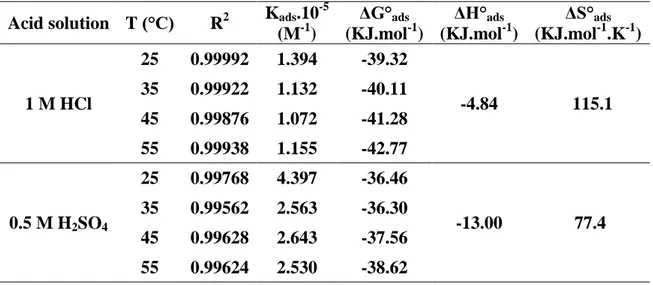
Table 8. Thermodynamic parameters for the adsorption of ligand L in 1 M HCl and 0.5 M H2SO4 on the Carbon steel at 25–55 °C
Acid solution T (°C) R2 Kads.10
-5 (M-1) ΔG°ads (KJ.mol-1) ΔH°ads (KJ.mol-1) ΔS°ads (KJ.mol-1.K-1) 1 M HCl 25 0.99992 1.394 -39.32 -4.84 115.1 35 0.99922 1.132 -40.11 45 0.99876 1.072 -41.28 55 0.99938 1.155 -42.77 0.5 M H2SO4 25 0.99768 4.397 -36.46 -13.00 77.4 35 0.99562 2.563 -36.30 45 0.99628 2.643 -37.56 55 0.99624 2.530 -38.62
In order to compare the standard free energy of adsorption values (ΔG°ads) at various temperatures from 25 to 55 °C for various inhibitor concentrations from the polarization curves, we have drawn (C/θ) as a function of inhibitor concentration (C) in HCl and H2SO4. The (C/θ) curve as a function of C is linear, indicating that adsorption of L follows Lagmuir’s isotherm model with a correlation unity [54]. Thermodynamic parameters Kads and ΔG°ads obtained from adsorption isotherms in the same previous conditions are listed in Table 8.
According to result shown in table 8, it is noticed that:
-The negative values of ΔGads indicate the adsorption process spontaneity and the adsorbed
layer on metal surface stability [55].
-Absolute values of ΔG°ads calculated (table) in H2SO4 are higher than 20 Kj.mol-1 and lower than 40 KJ.mol-1, this shows that the inhibitor was physically and chemically adsorbed. Whereas, in HCl, ΔG°ads values are close or higher than 40 Kj.mol-1, showing that this inhibitor was chemisorbed on the metal surface with the increasing temperature [56].
If ΔG°ads values decrease as a function of temperature (become more negative), then,
adsorption process is endothermic, the inhibitor adsorption is privileged by the temperature increase [57]. The calculated values of ΔG°ads show that the inhibitor adsorption is a chemical endothermic process with the temperature increase. However, the physisorption phenomenon cannot be excluded. This conclusion is supported by the fact that the corrosion inhibitive activity of this ligand L decreases at high temperature.
These results confirm that the inhibitor into HCl medium contributes to a chemical adsorption stronger than in H2SO4. The inhibitor L adsorption may also occurred trough (π) electron interactions between the molecule imine structure and the metal surface because of the existence of a much more sites on the metal surface into HCl solution because of the weak adsorption of chloride ions on the steel surface [58].
The variation of (ΔG°ads) as a function of the temperature (Fig. 8) allows calculate the standard adsorption enthalpy (ΔH°ads) and entropy (ΔS°ads) using Gibbs–Helmholtz’s equation (9) [59, 60]:
(9)
An adsorption endothermic process (ΔH°ads>0) is attributed to the chemisorption, however, an exothermic one (ΔH°ads< 0) may be indicative of physisorption and/or chemisorption [61-63].
295 300 305 310 315 320 325 330 -43,0 -42,5 -42,0 -41,5 -41,0 -40,5 -40,0 -39,5 -39,0 -38,5 -38,0 -37,5 -37,0 -36,5 -36,0 HCl H2SO4 G (K J,mo l-1 ) T(K)
In the present case, ΔH°ads values are negative and equal to -4.84 and -13 Kjmol-1 in HCl and H2SO4 respectively, indicating that this inhibitor is physisorbed and chemisorbed on the metal surface. The standard entropy positive values ΔS°ads in presence of inhibitor mean an increase of disorder during the formation of the metal/adsorbed molecules complex [64]. Such a disorder results from desorption of several water molecules at the metal surface by a single inhibitor molecule adsorption [65-67].
Finally, it can be concluded that both adsorption modes may be considered namely, the physical adsorption and the chemisorption [68].
3.8. Quantum Chemical Studies
Quantum chemical calculations were performed in order to analyze the effect of the Schiff base molecular structure and also electronic parameters on inhibition performance of compound L.
Protection efficiency of inhibitors depends on the electronic properties of the corrosion inhibitors such as: highest occupied molecular orbital (HOMO), the lowest unoccupied molecular orbital (LUMO) [69]. In addition, Fig. 9 illustrates the optimized molecular structures and highest occupied molecular orbital of the compound L.
HOMO LUMO
Figure 9. The optimized structure (left) and HOMO (center) and LUMO (right) distribution for molecules.
The calculated quantum chemical data reported in Table 9 include the energy of the highest occupied molecular orbital (EHOMO), the energy of the lowest unoccupied molecular orbital (ELUMO), the energy gap (△E=ELUMO-EHOMO), the dipolar moment (μ), the absolute electronegativity (χ), global hardness (γ) and the fraction of the transferred electrons (ΔN).
Table 9. Calculated quantum chemical parameters of the Inhibitor L Quantum chemical
parameters EHOMO (eV) ELUMO (eV) ΔE (eV) µ (Debye) Χ (eV) γ (eV) ΔN
High value of EHOMO (-5.16 eV) indicates the tendency of a molecule to donate electrons to an appropriate acceptor molecule with empty molecular orbitals.
Therefore, the energy of ELUMO (-1.39) indicates the ability of a molecule to accept electrons [70, 71].
These energies of a molecule facilitate adsorption and therefore enhance the inhibition
efficiency by influencing the transport process through the adsorbed layer.
In the same way, values of energy gap (△E=ELUMO-EHOMO) is the measure of excitation energy to remove an electron from the last occupied molecular orbital. Low values of △E=ELUMO-EHOMO will provide good inhibition efficiencies [72].
The dipolar moment is the measure of polarity of a polar covalent bond. it is clear that, the dipolar moment of ligand L µL (3.34D) is more than that of µH2O (1.88 D), this is related to stronger dipole–dipole interactions of molecules L and metallic surface. This shows the strong adsorption of ligand L on the surface of the steel.
The energies of EHOMO and ELUMO are related to the ionization potential (I) and the electron
affinity (A) of the iron atoms and the inhibitor molecules [73], defined as and I = -EHOMO and A= -ELUMO. The absolute electronegativity (χ) and the global hardness (γ) of the inhibitor molecule are
approximated by Eqs. (11) and (12): (11)
(12)
Thus, the fraction of electrons transferred from the inhibitor to metallic surface (ΔN) is calculated by equation (13) [74]:
(13)
Where the χFe and γFe are the absolute electronegativity and global hardness of the Fe atom, and
the χinh and γinh are the absolute electronegativity and global hardness of the self-assembled molecules.
The theoretical values of χFe and γFe are 7 eV and 0 eV [75].
The inhibitor tested has the value of ΔN <3.6 (Table 9) and therefore the molecules of the inhibitor are electron donors and the iron surface is an acceptor [76].
Inhibitors containing atoms with high negative charges are often considered to have the highest tendency to donate electrons to the metal surface [77]. Therefore, N and O atoms are the active center, which have the strongest ability of bonding to the metal surface. In addition, the areas containing N and O atoms are the most possible sites of bonding metal surface by donating electrons to the metal iron.
Finally, it is worth noting that, the data obtained from quantum chemical calculations give good evidence on the obtained results by electrochemical techniques and the adsorption of the inhibitor was mainly concentrated around the nitrogen and oxygen atoms.
4. CONCLUSION
From the above results and discussion, the following conclusions are drawn:
- The new Schiff base named (E)-3-(((2-amino-4-methylphenyl)imino)methyl)naphthalen-2-ol (L) was synthesized then purified. The chemical structure of this compound was confirmed by elemental analysis and spectroscopic methods.
- This synthesized inhibitor L was found to be effective as a corrosion inhibitor for Carbon steel in both 1M HCl and 0.5M H2SO4 media by weight loss and electrochemical techniques.
- The inhibition efficiencies of ligand L for Carbon steel tend to increase with increasing ligand L concentration in both acidic media. The inhibition performance in 1 M HCl solution is higher than that in 0.5 M H2SO4 solution at any inhibitor concentration.
- Inhibition efficiencies obtained from weight loss are in good agreement with both potentiodynamic polarization curves and electrochemical impedance spectroscopy methods.
- The polarization measurements show that the inhibitor L is found to behave as a mixed type inhibitor.
- The adsorption of this ligand L was successfully described by the Langmuir adsorption isotherm and the corresponding values of ΔGo
ads revealed that the adsorption mechanism of this inhibitor on Carbon steel X48 surface in 1 M HCl and 0.5 M H2SO4 solution is mainly due to mixed form physical and chemical adsorption.
- The study of the temperature effect on the inhibition efficiency shows that the inhibition decreases with the increasing temperature, which confirms that the adsorption of the inhibitor to the surface occurs by means of an intermediate adsorption between physisorption and chemisorption.
- Finally, this study shows a good correlation between the theoretical and electrochemical data which confirms the reliability of quantum chemical methods to investigate the corrosion inhibition of metal surfaces.
References
1. G. Trabanelli, Corrosion., 47 (1991) 410.
2. K.C. Emregül, R. Kurtaran, and O. Atakol, Corros. Sci., 45 (2003) 2803.
3. M.J. Banera, J. A. Caram, C.A. Gervasi, and M.V. Mirifico, J. Appl. Electrochem., 44 (2014) 1337.
4. H. DeryaLeçe, K.C. Emregül, and O. Atakol, Corros. Sci., 50 (2008) 1460.
5. M.G. Hosseini, M. Ehteshamzadeh, and T. Shahrabi, Electrochimica. Acta., 52 (2007) 3680. 6. H. Keleş, M. Keleş, I. Dehri, and O. Serindağ, Mater. Chemi. Phys., 112 (2008) 173.
7. M. Ehteshamzadeh, A.H. Jafari, E. Naderi, and M.G. Hosseini, J. Chem. Phys., 113 (2009) 986. 8. M.N. Desai, M.B. Desai, C.B. Shah, and S.M. Desai, Corros. Sci., 26 (1986) 827.
9. M. Ehteshamzade, T. Shahrabi, and M.G. Hosseini, Appl. Surf. Sci., 252 (2006) 2949. 10. U.J. Naik, V.A. Panchal, A.S. Patel, and N.K. Shah, J. Mater. Environ., Sci. 3 (2012) 935. 11. S.S. Abd El Rehim, H.H. Hassan, and M.A. Amin, Corros. Sci.,46 (2004) 5.
12. K.C. Emregül, O. Atakol, J. Mater. Chem. Phys., 83 (2004) 373.
13. S. Benabid, T. Douadi, S. Issaadi, C. Penverne, and S. Chafaa, Measurement., 99 (2017) 53. 14. M.G. Hosseini, M. Ehteshamzadeh, and T. Shahrabi, Electrochimica. Acta., 52 (2007) 3680-3685
15. M. Hosseini, S.F.L. Mertens, M. Ghorbani, and M.R. Arshadi, J. Mater. Chem. Phys., 78 (2003) 800.
16. D.K. Dey, M.K. Saha, M.K. Das, N. Bhartiya, R.K. Bansal, G. Rosair, and S. Mitra, Polyhedron., 18 (1999) 2687.
17. D. Majumdar, Int. J. Chem. Stud., 4 (2016) 30.
18. P. Crews, J. Rodriguez, and M. Jaspars, organic structure analysis, Oxford University Press Inc, New York, 1998.
19. J. Matijević-Sosa, M. Vinković, and D. Vikić-Topić, Croatica. Chemica. Acta., 79 (2006) 489. 20. R.M. Silverstein, F.X. Webster, and D.J. Kiemle, Spectrometric identification of organic
compounds, seventh ed., John Wiley & Sons, Inc., New York, 2005.
21. T.A. Alsalim, J.S. Hadi, O.N. Ali, H.S. Abbo, and S.J.J. Titinchi, J. Chem. Cent., 7 (2013) 3. 22. T.K. Venkatachalam, G.K. Pierens, M.R. Campitelli, and D.C. Reutensa, Magn. Reson. Chem., 48
(2010) 585.
23. R. Solmaz, Corros. Sci., 52 (2010) 3321.
24. I.D. Raistrick, D.R. Franceschetti, and J.R. Macdonald, Impedance spectroscopy, in:E. Barsoukov, J.R. Macdonald (Eds.), Theory, Experimental and Applications,second ed., John Wiley & Sons, New Jersey, 2005
25. Y.Tang , F. Zhang, S. Huc, Z. Cao, Z. Wua, and W. Jing, Corros. Sci., 74 (2013) 271. 26. M. Mahdavian, S. Ashhari, Electrochim. Acta., 55 (2010) 1720.
27. X. Li, S. Deng, G. Muc, H. Fu, and F. Yang, Corros. Sci., 50 (2008) 420.
28. X. Wang, Y. Wan, Q. Wang,and Y. Ma, Int. J. Electrochem. Sci., 8 (2013) 806. 29. A. Dadgarinezhad, F. Baghaei, GU. J. Sci., 3 (2012) 593.
30. A. Dadgarinezhad, I. Sheikhshoaie. And F. Baghaei, Asi. J. Chem., 16 (2004) 1109. 31. H.M. Abd El-Lateef, V.M. Abbasov, L.I. Aliyeva, I.T. Ismayilov, E.E. Qasimov, and M.M.
Narmin, J. Korean Chem. Soc., 57 (2013) 25.
32. H.J. Guadalupe, E. García-Ochoa, P.J. Maldonado-Rivas, J. Cruz, and T. Pandiyan, J. Electroanal. Chem., 655 (2011) 164.
33. A.O. Yüce, B.D. Mert, G. Kardas , and B. Yazıcı, Corros. Sci., 83 (2014) 310. 34. B. Liu, H. Xi, Z. Li, and Q. Xia, Appl. Surf. Sci., 258 (2012) 6679.
35. L. Wang, X. Yin, W. Wang, L. Jin, and Z. Li, Int. J. Electrochem. Sci., 9 (2014) 6088 36. E. Khamis, F. Bellucci, R.M. Latanision, and E.S.H. El-Ashry, Corros. Sci., 47 (1991) 677. 37. F. Donahue, K. Nobe, J. Electrochem. Soc., 112 (1965) 886.
38. W. Durnie, R.D. Marco, A. Jefferson, and B. Kinsella, J. Electrochem. Soc., 146 (1999) 1751. 39. L. Vracar, D. Drazic, Corros. Sci., 44 (2002) 1669.
40. N.M. Guan, L. Xueming, and L. Fei, Mater. Chem. Phys., 86 (2004) 59. 41. I.B.Obot, N.O. Obi-Egbedi, Corros. Sci., 52 (2010) 198.
42. A.E. Stoyanova, E.I. Sokolova, and S.N. Raicheva, Corros. Sci., 39 (1997)1595.
43. A.S. Fouda, S.S Elkaabi, and A.K. Mohamed, Anti-Corros. Methods. Mater., 36 (1989) 9. 44. E. Stupnisek-Usac, Z. Ademovic, Proceedings of the 8th European Symposium on Corrosion
Inhibitors, Ann. Univ. Ferrara (Italy), N. S. Sez suppl. 3, 1995, V l, p. 257. 45. M.J. Bahramia , S.M.A. Hosseinia, and P. Pilvarb, Corros. Sci., 52 (2010) 2793 46. R.L. Liu, Y.J. Qiao, M.F. Yan, and Y.D. Fu, J. Mater. Sci. Technol., 28 (2012) 1046. 47. Z. Tianpei, M. Guannan, Corros. Sci., 41 (1999) 1937.
48. H. Jafari, I. Danaee, H. Eskandari, and M. Rashvand Avec, J. Mater. Sci. Technol., 30 (2014) 239. 49. W. Durnie, R.D. Marco, A. Jefferson, and B. Kinsella, J. Electrochem. Soc., 146 (1999) 1751. 50. K.M. Hijazi, A.M. Abdel-Gaber, and G.O. Younes, Int. J. Electrochem. Sci., 10 (2015) 4366 51. E.A. Noor, Int. J. Electrochem. Sci., 2 (2007) 996.
52. M. Dahmani, A. Et-Touhami, S.S. Al-Deyab, B. Hammouti, and A. Bouyanzer, Int. J. Electrochem. Sci., 5 (2010) 1060.
53. S.K.A. Ali, M.T. Saeed, and S.U. Rahman, Corros. Sci., 45 (2003) 253. 54. Y. Xie, Y. Liu, and Z. Yang, Int. J. Electrochem. Sci., 10 (2015)1292
55. Y. Zhou, S. Zhang, L. Guo, S. Xu, H. Lu and F. Gao, Int. J. Electrochem. Sci., 10 (2015) 2072 56. A. S. El-Tabei, M.A. Hegazy, A.H. Bedair, and M.A. Sadeq, J. Surfact. Deterg., 17 (2014) 341. 57. L. Tang, G. Mu, and G. Liu, Corros. Sci., 45 (2003)2251.
58. O. Benali, L. Larabi, M. Traisnel , L. Gengenbre, and Y. Harek, Appl. Surf. Sci., 253 (2007) 6130. 59. F. Bentiss, M. Lebrini, and M. Lagrenée, Corros. Sci., 47 (2005) 2915.
60. E.A. Noor, A.H. Al-Moubaraki, Mater. Chem. Phys., 110 (2008) 145.
61. M.A. Migahed, M.A. Hegazy, and A.M. Al-Sabagh, Corros. Sci., 61 (2012) 10. 62. S.Pournazari, M.H. Moayed, and M. Rahimizadeh, Corros. Sci., 71 (2013) 20. 63. X. Li, G. Mu, Appl. Surf. Sci., 252 (2005) 1254.
64. L. Larabi, O. Benali, S.M. Mekelleche, and Y. Harek, Appl. Surf. Sci., 253 (2006) 1371. 65. H. Ashassi-Sorkhabi, B. Shaabani, and D. Seifzadeh, Electrochim. Acta., 50 (2005) 3446. 66. G. Gece, Corros. Sci., 50 (2008) 2981.
67. R. Fuchs-Godec, V. Doleček, Colloids Surf. A., 244 (2004) 73.
68. M. Dahmani, A. Et-Touhami, S.S. Al-Deyab, B. Hammouti, and A. Bouyanzer, Int. J. Electrochem. Sci., 5 (2010) 1060.
69. M. Finsgar, A. Lesar, A. Kokalj, and I. Milosev, Electrochim. Acta., 53 (2008) 8287. 70. D.K. Yadav, B. Maiti, and M.A. Quraishi, Corros. Sci., 52 (2010) 3586.
71. J. Zhang, G. Qiao, S. Hu, Y. Yan, Z. Ren, and L. Yu, Corros. Sci., 53 (2011) 147.
72. Z. Zhang, N.Tian, X. Li, L. Zhang , L. Wu, and Y. Huang, Appl. Surf. Sci., 375 (2015) 845. 73. H. Tian, W. Li, K. Cao, and B. Hou, Corros. Sci., 73 (2013) 281.
74. H. Zhao, X. Zhang, L. Ji, H. Hu, and Q. Li, Corros. Sci., 83 (2014) 261.
75. K. Zhang, B. Xu, W. Yang, X. Yin, Y. Liu, and Y. Chen, Corros. Sci., 90 (2015) 284. 76. A.Y. Musa, R.T.T. Jalgham, and A.B. Mohamad, Corros. Sci., 56 (2012) 176.
77. H. Ju, Z.P. Kai, and Y. Li, Corros. Sci., 50 (2008) 865.
© 2017 The Authors. Published by ESG (www.electrochemsci.org). This article is an open access article distributed under the terms and conditions of the Creative Commons Attribution license (http://creativecommons.org/licenses/by/4.0/).