Environmental
Science
Processes & Impacts
rsc.li/espi
ISSN 2050-7887 PAPER Michael S. McLachlan et al.
Predicting global scale exposure of humans to PCB 153 from historical emissions Volume 20 Number 5 May 2018 Pages 737-856
Environmental
Science
Processes & Impacts
This is an Accepted Manuscript, which has been through the Royal Society of Chemistry peer review process and has been accepted for publication.
Accepted Manuscripts are published online shortly after acceptance, before technical editing, formatting and proof reading. Using this free service, authors can make their results available to the community, in citable form, before we publish the edited article. We will replace this Accepted Manuscript with the edited and formatted Advance Article as soon as it is available.
You can find more information about Accepted Manuscripts in the
Information for Authors.
Please note that technical editing may introduce minor changes to the text and/or graphics, which may alter content. The journal’s standard
Terms & Conditions and the Ethical guidelines still apply. In no event shall the Royal Society of Chemistry be held responsible for any errors or omissions in this Accepted Manuscript or any consequences arising from the use of any information it contains.
Accepted Manuscript
This article can be cited before page numbers have been issued, to do this please use: C. Lihl, B. Heckel, A. Grzybkowska, A. Dybala-Defratyka, V. Ponsin, C. Torrentó, D. Hunkeler and M. Elsner, Environ. Sci.: Processes Impacts, 2020, DOI: 10.1039/C9EM00503J.
Compound-Specific Chlorine Isotope Fractionation
in Biodegradation of Atrazine
†
Christina Lihla,b, Benjamin Heckela,b,Anna Grzybkowskac, Agnieszka Dybala-Defratykac,
Violaine Ponsind,e , Clara Torrentód,f, Daniel Hunkelerd, Martin Elsnera,b,*
a Institute of Groundwater Ecology, Helmholtz Zentrum München, Ingolstädter Landstraße 1, 85764
Neuherberg, Germany
b Chair of Analytical Chemistry and Water Chemistry, Technical University of Munich, Marchioninistraße
17, 81377 Munich, Germany
c Institute of Applied Radiation Chemistry, Faculty of Chemistry, Lodz University of Technology,
Zeromskiego 116, 90-924 Lodz, Poland
d Centre of Hydrogeology and Geothermics (CHYN), University of Neuchâtel, 2000 Neuchâtel, Switzerland e Département des sciences de la Terre et de l’atmosphère, Université du Québec à Montréal, 201 avenue
du Président Kennedy, Montréal, QC, Canada
f Grup MAiMA, Departament de Mineralogia, Petrologia i Geologia Aplicada, Facultat de Ciències de la
Terra, Universitat de Barcelona (UB), C/ Martí i Franquès s/n, 08028, Barcelona, Spain. * Corresponding Author: Phone: +49 89/2180-78231. E-mail: [email protected]
† Electronic Supplementary Information (ESI) available: Information concerning the HPLC temperature
programs, two Figures and one Table illustrating the GC-qMS method optimization for chlorine analysis, one Table illustrating the method comparison of the GC-qMS for chlorine analysis, one Figure and one Table considering H-abstraction during chlorine CSIA, two Figures illustrating the results of HPLC concentration analysis. 4 5 6 7 8 9 10 11 12 13 14 15 16 17 18 19 20 21 22 23 24 25 26 27 28 29 30 31 32 33 34 35 36 37 38 39 40 41 42 43 44 45 46 47 48 49 50 51 52 53 54 55 56
Environmental
Science:
Processes
&
Impacts
Accepted
Manuscript
KEYWORDS: hydrolysis, oxidative dealkylation, compound-specific isotope analysis, chlorine isotope effect, Arthrobacter, Rhodococcus
Environmental Significance:
Atrazine is an important chlorinated micropollutant. Although degradable via different
pathways (dealkylation and hydrolytic dechlorination), it is often recalcitrant and persists in groundwater. To assess and understand its degradation pathways, compound-specific carbon and nitrogen isotope analysis has been advanced, but information from chlorine isotope fractionation has been missing until today. This study explores the added benefit of chlorine isotope fractionation as indicator of natural atrazine transformation. Together with carbon and nitrogen isotope analysis, this enables a multi-element approach which can improve source identification and differentiation of microbial transformation pathways in the environment.
ABSTRACT
Atrazine is a frequently detected groundwater contaminant. It can be microbially degraded by oxidative dealkylation or by hydrolytic dechlorination. Compound-specific isotope analysis is a powerful tool to assess its transformation. In previous work, carbon and nitrogen isotope effects were found to reflect these different transformation pathways.
4 5 6 7 8 9 10 11 12 13 14 15 16 17 18 19 20 21 22 23 24 25 26 27 28 29 30 31 32 33 34 35 36 37 38 39 40 41 42 43 44 45 46 47 48 49 50 51 52 53 54 55 56
Environmental
Science:
Processes
&
Impacts
Accepted
Manuscript
However, chlorine isotope fractionation could be a particularly sensitive indicator of natural transformation since chlorine isotope effects are fully represented in the molecular average while carbon and nitrogen isotope effects are diluted by non-reacting atoms. Therefore, this study explored chlorine isotope effects during atrazine hydrolysis with
Arthrobacter aurescens TC1 and oxidative dealkylation with Rhodococcus sp. NI86/21.
Dual element isotope slopes of chlorine vs. carbon isotope fractionation (ΛArthroCl/C = 1.7
± 0.9 vs. ΛRhodoCl/C = 0.6 ± 0.1) and chlorine vs. nitrogen isotope fractionation (ΛArthroCl/N =
-1.2 ± 0.7 vs. ΛRhodoCl/N = 0.4 ± 0.2) provided reliable indicators of different pathways.
Observed chlorine isotope effects in oxidative dealkylation (ɛCl = -4.3 ± 1.8 ‰) were
surprisingly large, whereas in hydrolysis (ɛCl = -1.4 ± 0.6 ‰) they were small, indicating
that C-Cl bond cleavage was not the rate-determining step. This demonstrates the importance of constraining expected isotope effects of new elements before using the approach in the field. Overall, the triple element isotope information brought forward here enables a more reliable identification of atrazine sources and degradation pathways.
4 5 6 7 8 9 10 11 12 13 14 15 16 17 18 19 20 21 22 23 24 25 26 27 28 29 30 31 32 33 34 35 36 37 38 39 40 41 42 43 44 45 46 47 48 49 50 51 52 53 54 55 56
Environmental
Science:
Processes
&
Impacts
Accepted
Manuscript
INTRODUCTION
The herbicide atrazine has been used in agriculture to inhibit growth of broadleaf and
grassy weeds1. In the U.S. atrazine was the second most commonly used herbicide in
2012 and is still in use today2. In the European Union atrazine was banned in 20043, but
together with its metabolites it is still frequently detected at high concentrations in
groundwater4, 5. The massive and widespread use has led to a wide-ranging presence of
atrazine in the environment, which can have harmful effects on living organisms and
humans6. Therefore, the environmental fate of atrazine is of significant concern and much
attention has been directed at detecting and enhancing its natural biodegradation. However, assessing microbial degradation of atrazine in the environment is challenging with conventional methods like concentration analysis. Sorption and remobilization of the parent compound and its metabolites, as well as further transformation of the metabolites
inevitably lead to fluctuations in concentrations7-10, which make it difficult to assess the
net extent of atrazine degradation in the field.
In recent years, compound-specific isotope analysis (CSIA) has been proposed as an
alternative approach to detect and quantify the degradation of atrazine11-13.
In contrast to, and complementary to traditional methods, CSIA informs about transformation without the need to detect metabolites. The reason is that during (bio)chemical transformations molecules with heavy isotopes are typically enriched in the remaining substrate since their bonds are more stable and, therefore, usually react slower
4 5 6 7 8 9 10 11 12 13 14 15 16 17 18 19 20 21 22 23 24 25 26 27 28 29 30 31 32 33 34 35 36 37 38 39 40 41 42 43 44 45 46 47 48 49 50 51 52 53 54 55 56
Environmental
Science:
Processes
&
Impacts
Accepted
Manuscript
than molecules containing light isotopes (normal kinetic isotope effect). The ratios of
heavy to light isotopes (e.g. 13C/12C for carbon) in the remaining substrate, therefore,
change during transformation. Observing such changes can be used as direct (and
concentration-independent) indicator of degradation14, 15.
Isotope values are reported in the δ-notation relative to an international reference
material, e.g. for carbon14, 15:
δ13C = [(13C/12C)Sample – (13C/12C)Reference] / (13C/12C)Reference (1)
The magnitude of the degradation-induced isotope fractionation depends on different factors, which can make isotope ratios of specific elements particularly attractive to observe degradation-induced isotope fractionation. To this end, first, an element needs to be directly involved in the (bio)chemical reaction. For example, a carbon isotope effect would be quite generally expected in organic molecules, whereas a chlorine isotope effect would be primarily expected if a C-Cl bond is cleaved. Second, isotope fractionation depends on the underlying kinetic isotope effect (see above), but also on the extent to which this effect is represented in the molecular average isotope fractionation described by the enrichment factor ɛ (see below). Atrazine, for example, contains only one chlorine atom but eight carbon and five nitrogen atoms. Hence, chlorine isotope effects at the reacting position are fully represented in the molecular average, whereas position-specific
carbon and nitrogen isotope effects are diluted by non-reacting atoms14, 15.
4 5 6 7 8 9 10 11 12 13 14 15 16 17 18 19 20 21 22 23 24 25 26 27 28 29 30 31 32 33 34 35 36 37 38 39 40 41 42 43 44 45 46 47 48 49 50 51 52 53 54 55 56
Environmental
Science:
Processes
&
Impacts
Accepted
Manuscript
Most of the publications studying the chemical mechanisms of abiotic and microbial
atrazine degradation have focused on the analysis of carbon (13C/12C) and nitrogen
(15N/14N) isotope fractionation. Thereby, ɛ-values in the range of -5.4 ‰ to -1.8 ‰ for
carbon and -1.9 ‰ to 3.3 ‰ for nitrogen were observed9, 10, 16, 17. Chlorine isotope effects
for microbial atrazine degradation were so far not reported due to analytical challenges18:
Until recently19, 20, suitable methods were not available for chlorine isotope analysis of
atrazine. However, from the magnitude of chlorine isotope effects observed for dechlorination of trichloroethenes (-5.7 ‰ to -3.3 ‰, where intrinsic isotope effects are
diluted by a factor of three21), very large chlorine enrichment factors ɛCl (-8 ‰ to -10 ‰ or
even larger) could potentially occur for a C-Cl bond cleavage in atrazine. For example, enzymatic hydrolysis of the structural homologue ametryn (atrazine structure with a
-SCH3 instead of a -Cl group) yielded a sulfur isotope enrichment factor ɛS of
-14.7 ‰ ± 1.0 ‰17. If the cleavage of carbon-chlorine bonds is involved in the
rate-determining step of a (bio)transformation, chlorine isotope effects could, therefore, enable a particularly sensitive detection of natural transformation processes by compound-specific (i.e., molecular average) isotope analysis.
The measurement of chlorine isotope fractionation is attractive for yet another reason – multiple element isotope analysis bears potential for a better distinction of sources and transformation pathways. From isotope analysis of one element alone, it is difficult to distinguish sources of a particular compound, or competing transformation pathways that
4 5 6 7 8 9 10 11 12 13 14 15 16 17 18 19 20 21 22 23 24 25 26 27 28 29 30 31 32 33 34 35 36 37 38 39 40 41 42 43 44 45 46 47 48 49 50 51 52 53 54 55 56
Environmental
Science:
Processes
&
Impacts
Accepted
Manuscript
may lead to metabolites of different toxicity15. For example, two different microbial
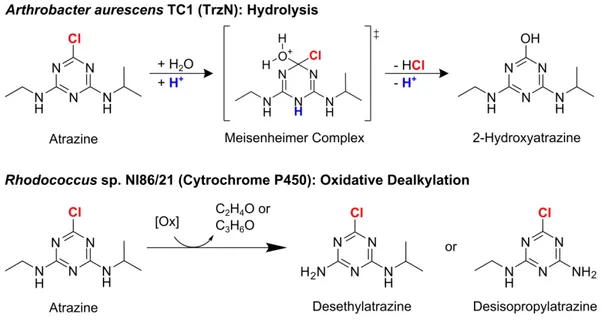
transformation pathways can lead to the degradation of atrazine in the environment. Hydrolysis forms the nontoxic dehalogenated product 2-hydroxyatrazine (HAT) whereas oxidative dealkylation degrades atrazine to the still herbicidal products desethyl- (DEA)
or desisopropylatrazine (DIA)22, 23. Prominent examples for microorganisms catalyzing
these pathways are Arthrobacter aurescens TC1 and Rhodococcus sp. NI86/21 (see
Figure 1). A. aurescens TC1 was directly isolated from an atrazine-contaminated soil24.
By expressing the enzyme TrzN, it is capable of performing hydrolysis of atrazine24, 25.
Rhodococcus sp. NI86/21 uses a cytochrome P450 system for catalyzing oxidative
dealkylation of atrazine26.
Figure 1. Microbial degradation of atrazine by Arthrobacter aurescens TC1 and
Rhodococcus sp. NI86/21 (adapted from Meyer et al.9 and Meyer & Elsner10).
4 5 6 7 8 9 10 11 12 13 14 15 16 17 18 19 20 21 22 23 24 25 26 27 28 29 30 31 32 33 34 35 36 37 38 39 40 41 42 43 44 45 46 47 48 49 50 51 52 53 54 55 56
Environmental
Science:
Processes
&
Impacts
Accepted
Manuscript
For these two pathways, carbon isotope fractionation was very similar, but significant
differences were observed in nitrogen isotope effects9, 10, 16, 17. Plotting the changes of
isotope ratios of these two elements relative to each other results in the regression
slope Λ for carbon and nitrogen27, 28
ΛC/N = Δδ15N / Δδ13C ≈ ɛN / ɛC (2)
Hence, dual element (C, N) isotope trends for oxidative dealkylation of atrazine with
Rhodococcus sp. NI86/21 (ΛRhodoC/N = 0.4 ± 0.1)16 were significantly different compared
to hydrolysis with A. aurescens TC1 (ΛArthroC/N = -0.6 ± 0.1)9 offering an opportunity to
distinguish atrazine degradation pathways in the field. However, in environmental assessments it is advantageous to have isotopic information of as many elements as
possible in order to distinguish degradation pathways and sources at the same time29-31.
Therefore, information from a third element, chlorine, would be highly valuable. Also on the mechanistic end, information gained from a change in the chlorine isotope value could lead to a more reliable differentiation of transformation pathways and contribute to a better
mechanistic understanding of the underlying chemical reaction31. Along these lines, triple
element (3D) isotope analysis was already accomplished for chlorinated alkanes31, 32 and
alkenes33, 34.
Until now, however, compound-specific chlorine isotope analysis has not been accessible so that chlorine isotope ratio changes for hydrolysis of atrazine have only been
analyzed in abiotic systems or via computational calculations35, 36. For oxidative
4 5 6 7 8 9 10 11 12 13 14 15 16 17 18 19 20 21 22 23 24 25 26 27 28 29 30 31 32 33 34 35 36 37 38 39 40 41 42 43 44 45 46 47 48 49 50 51 52 53 54 55 56
Environmental
Science:
Processes
&
Impacts
Accepted
Manuscript
dealkylation, chlorine isotope effects have, so far, not been studied. Recently a GC-qMS
method for chlorine isotope analysis of atrazine has been brought forward20 which offers
the opportunity to enable deeper mechanistic insights into its transformation processes. Therefore, our objective was to analyze carbon, nitrogen and chlorine isotope effects
associated with the biodegradation of atrazine via hydrolysis with A. aurescens TC1 and
via oxidative dealkylation with Rhodococcus sp. NI86/21. In addition, we computationally
predicted the chlorine isotope effect associated with hydrolysis and oxidative dealkylation for comparison. Further, we evaluated whether the additional information from chlorine isotope fractionation is a particularly sensitive indicator for transformation processes and whether it can confirm previously proposed mechanisms of different pathways. With this study, we bring forward information about degradation-induced chlorine isotope fractionation of atrazine as a basis to apply triple element (3D) isotope analysis in environmental assessments.
MATERIAL & METHODS
Bacterial strains and cultivation. A. aurescens strain TC1 was grown in mineral salt medium supplemented with approx. 20 mg/L of atrazine according to the protocol of
Meyer et al.9 Likewise, Rhodococcus sp. strain NI86/21 was cultivated in autoclaved
nutrient broth (8 g/L, DifcoTM) with approx. 20 mg/L of atrazine according to the protocol
of Meyer et al.16. In the late-exponential growth phase the strains were harvested via
centrifugation (4000 rpm, 15 min). For the start of the degradation experiments, cell
4 5 6 7 8 9 10 11 12 13 14 15 16 17 18 19 20 21 22 23 24 25 26 27 28 29 30 31 32 33 34 35 36 37 38 39 40 41 42 43 44 45 46 47 48 49 50 51 52 53 54 55 56
Environmental
Science:
Processes
&
Impacts
Accepted
Manuscript
pellets of each strain were transferred to 400 mL fresh media and atrazine was added to achieve a starting concentration of 20 mg/L. All experiments were performed in triplicate at 21 °C on a shaker at 150 rpm. Control experiments, which were performed without the bacterial strains, did not show any degradation of atrazine.
Concentration measurements via HPLC. The process of atrazine degradation was
monitored by concentration measurements. For analysis, 1 mL samples were taken and filtered through a 0.22 µm filter. Atrazine and its degradation products were directly analyzed using a Shimadzu UHPLC-20A system, which was equipped with an ODS column 30 (Ultracarb 5 μM, 150 × 4.6 mm, Phenomenex). After sample injection (10 µL) an adequate gradient program (see SI) was used for compound separation. The oven temperature was set to 45 °C and the compounds were detected by their UV absorbance at 222 nm. Quantitation was performed by the software “Lab Solutions” based on internal calibration curves.
Preparation of samples for isotope analysis. According to the protocol of Meyer et al.9
between 10 and 260 mL of sample were taken for isotope analysis of atrazine at every sampling event. After centrifugation (15 min, 4000 rpm) the supernatant was collected in a new vial. Subsequently, samples were extracted by adding dichloromethane (5-130 mL) and shaking the vial for at least 20 min. The sample extracts were dried at room temperature under the fume hood. Afterwards, the dried extracts were dissolved in ethyl acetate to a final atrazine concentration of approx. 200 mg/L.
4 5 6 7 8 9 10 11 12 13 14 15 16 17 18 19 20 21 22 23 24 25 26 27 28 29 30 31 32 33 34 35 36 37 38 39 40 41 42 43 44 45 46 47 48 49 50 51 52 53 54 55 56
Environmental
Science:
Processes
&
Impacts
Accepted
Manuscript
Isotope analysis of carbon and nitrogen. The protocol for isotope analysis of carbon and
nitrogen was adapted from the studies of Meyer et al.9, 16. A TRACE GC Ultra gas
chromatograph hyphenated with a GC-III combustion interface and coupled to a Finnigan MAT253 isotope ratio mass spectrometer (GC-C-IRMS, all Thermo Fisher Scientific) was used. Each sample was analyzed in triplicate. Sample injection (2-3 µL) was performed by a Combi-PAL autosampler (CTC Analysis). The injector had a constant temperature of 220 °C, was equipped with an “A” type packed liner for large volume injections (GL Sciences) and was operated for 1 min in splitless and then in split mode (split ratio 1:10) with a flow rate of 1.4 mL/min. For peak separation, the GC oven was equipped with a DB-5 MS column (30 m × 0.25 mm, 1 µm film thickness, Agilent). The temperature program of the oven started at 65 °C (held for 1 min), ramped at 20 °C/min to 180 °C (held for 10 min) and ramped again at 15 °C/min to 230 °C (held for 8 min). In the combustion interface, a GC Isolink II reactor (Thermo Fisher Scientific) was installed,
which was operated at a temperature of 1000 °C. After combustion of the analytes to CO2
and subsequent reduction of any nitrogen oxides, the compounds were analyzed as CO2
for carbon and N2 for nitrogen isotope measurements. Three pulse of CO2 or N2,
respectively, were introduced at the beginning and at the end of each run as monitoring
gas. Beforehand, these monitoring gases were calibrated against RM8563 (CO2) and
NSVEC (N2), which were supplied by the International Atomic Energy Agency (IAEA).
The analytical uncertainty 2σ was ±0.5 ‰ for carbon isotope values and ±1.0 ‰ for nitrogen isotope values.
4 5 6 7 8 9 10 11 12 13 14 15 16 17 18 19 20 21 22 23 24 25 26 27 28 29 30 31 32 33 34 35 36 37 38 39 40 41 42 43 44 45 46 47 48 49 50 51 52 53 54 55 56
Environmental
Science:
Processes
&
Impacts
Accepted
Manuscript
Isotope analysis of chlorine. For chlorine isotope analysis of atrazine, a 7890A gas
chromatograph coupled to a 5975C quadrupole mass spectrometer (GC-qMS, both Agilent) was used. Sample injection (2 µL) was performed by a Pal Combi-xt autosampler (CTC Analysis). For the injector and the GC oven, the same parameters as for carbon and nitrogen isotope analysis were used with the exception that a different liner type, a “FocusLiner” (SGE), was used. The ion source had a constant temperature of 230 °C and
the quadrupole of 150 °C. Prior to sample analysis, the method of Ponsin et al.20 was
tested and optimized for our instrument (see details in SI). Chlorine isotope ratios were evaluated by monitoring the mass-to-charge ratio m/z of 202/200. Standards and samples were measured ten times each and uncertainties were reported as standard deviation. Results were only evaluated if the peak areas of samples were inside a defined linearity
range (peak area of 1.2 x 10⁸ – 3.0 x 10⁸ for m/z 200). Inside the linearity range, the
determined precision of the method is associated with a maximal deviation of ±1.1 ‰. For analysis, the samples were diluted with ethyl acetate to a final concentration of approx. 75 mg/L and measured with a dwell time of 100 ms. Correction of the chlorine isotope values relative to Standard Mean Ocean Chloride (SMOC) was performed by an
external two-point calibration with characterized standards of atrazine (Atr #4 δ37Cl =
-0.89 ‰ and Atr #11 δ37Cl = +3.59 ‰)37. To this end, the standards were measured at the
beginning, in between and at the end of each sequence.
4 5 6 7 8 9 10 11 12 13 14 15 16 17 18 19 20 21 22 23 24 25 26 27 28 29 30 31 32 33 34 35 36 37 38 39 40 41 42 43 44 45 46 47 48 49 50 51 52 53 54 55 56
Environmental
Science:
Processes
&
Impacts
Accepted
Manuscript
Evaluation of stable isotope fractionation. Determination of isotope enrichment factors ε
was achieved by the Rayleigh equation, which describes the gradual enrichment of the residual substrate fraction ƒ with molecules containing heavy isotopes, as expressed by
isotope values according to eq. 115, 38. For example, for chlorine:
ln [ (δ37Cl + 1) / (δ37Cl
0 + 1) ] = ɛCl • ln ƒ (3)
Here δ37Cl
0 refers to the chlorine isotope value at the starting point (t = 0) of an
experiment. Regression slopes Λ of dual element isotope plots were obtained by plotting isotope ratios of two different elements against each other, e.g. carbon vs. nitrogen (see eq. 2). The uncertainties of the calculated ɛ-values and Λ-values are reported as 95 %
confidence intervals (CI). Furthermore, (apparent) kinetic isotope values, (A)KIECl, that
express the ratio of reaction rates 35k and 37k of heavy and light isotopologues,
respectively,
KIECl = 35k / 37k (4)
were calculated according to Elsner et al.15 by converting ɛCl-values into (A)KIECl and
taking into account that atrazine contains only one chlorine atom (n = 1):
(A)KIECl = 1 / (n × ɛCl + 1) (5)
Prediction of chlorine kinetic isotope effects during oxidative dealkylation and hydrolysis of atrazine. In the computational part of the study, we considered hydrogen atom transfer
and hydride transfer taking place at the -position of the ethyl side chain of the atrazine
4 5 6 7 8 9 10 11 12 13 14 15 16 17 18 19 20 21 22 23 24 25 26 27 28 29 30 31 32 33 34 35 36 37 38 39 40 41 42 43 44 45 46 47 48 49 50 51 52 53 54 55 56
Environmental
Science:
Processes
&
Impacts
Accepted
Manuscript
molecule in the oxidative dealkylation reaction promoted by permanganate and the hydronium ion, respectively. Furthermore, we considered hydrolysis under acidic/enzymatic, neutral and alkaline conditions. All molecular structures and analytical vibrational frequencies for involved reactant complexes and transition states were taken
from a previous study16. Chlorine kinetic isotope effects on dealkylation were calculated
using the complete Bigeleisen equation39 implemented in the ISOEFF program40 at
300 K. Additional isotope effects predictions for hydrolysis under acidic as well as neutral
conditions were performed following the previous computational protocol36.The tunneling
contributions to the overall kinetic isotope effect were omitted. RESULTS & DISCUSSION
Observation of normal chlorine isotope effects in biotic hydrolysis and oxidative dealkylation. Atrazine degradation by A. aurescens TC1 resulted in the metabolite 2-hydroxyatrazine, whereas the metabolites DEA and DIA were observed for
Rhodococcus sp. NI86/21 (see Figure S4 and S5 in the SI). Detection of these expected
degradation products (Figure 1) demonstrates that hydrolysis and oxidative dealkylation were the underlying biochemical reactions during atrazine degradation, respectively. In
both biodegradation experiments – biotic hydrolysis with A. aurescens TC1 and oxidative
dealkylation with Rhodococcus sp. NI86/21 – normal chlorine isotope fractionation was
observed (see Figure 2A). In the three replicates of hydrolytic degradation by
A. aurescens TC1 90 %, 90 % and 60 % transformation of atrazine was reached after
4 5 6 7 8 9 10 11 12 13 14 15 16 17 18 19 20 21 22 23 24 25 26 27 28 29 30 31 32 33 34 35 36 37 38 39 40 41 42 43 44 45 46 47 48 49 50 51 52 53 54 55 56
Environmental
Science:
Processes
&
Impacts
Accepted
Manuscript
approx. 26 h, respectively (see SI, Figure S4). Evaluation of δ37Cl values during biotic
hydrolysis according to Equation 3 resulted in a small normal isotope effect of ɛCl = -1.4
± 0.6 ‰. In oxidative dealkylation with Rhodococcus sp. NI86/21 approx. 90 %
degradation was reached after approx. 186 h in all three replicates (see SI, Figure S5). Evaluation of changes in chlorine isotope ratios resulted in a surprisingly large normal
isotope effect of ɛCl = -4.3 ± 1.8 ‰ considering that the C-Cl bond is not broken during
the reaction (see Figure 1). In a next step, carbon and nitrogen isotope effects were therefore analyzed to confirm whether the same reactions mechanisms are at work as
observed in previous studies9, 16.
4 5 6 7 8 9 10 11 12 13 14 15 16 17 18 19 20 21 22 23 24 25 26 27 28 29 30 31 32 33 34 35 36 37 38 39 40 41 42 43 44 45 46 47 48 49 50 51 52 53 54 55 56
Environmental
Science:
Processes
&
Impacts
Accepted
Manuscript
Figure 2. Isotope fractionation of (A) chlorine, (B) nitrogen and (C) carbon during
microbial degradation of atrazine by A. aurescens TC1 (red) and Rhodococcus sp.
4 5 6 7 8 9 10 11 12 13 14 15 16 17 18 19 20 21 22 23 24 25 26 27 28 29 30 31 32 33 34 35 36 37 38 39 40 41 42 43 44 45 46 47 48 49 50 51 52 53 54 55 56
Environmental
Science:
Processes
&
Impacts
Accepted
Manuscript
NI86/21 (blue) and corresponding enrichment factors ε evaluated according to eq. 3. (The 95 % confidence intervals are given as values and as black lines).
Observed carbon and nitrogen isotope fractionation is consistent with previous studies.
Carbon and nitrogen isotope fractionation for atrazine degradation by A. aurescens TC1
and Rhodococcus sp. NI86/21 was consistent with previous studies: Both experiments
showed significant changes in isotope ratios (see Figure 2B and C). For hydrolysis with
A. aurescens TC1, an inverse nitrogen isotope effect (ɛN = 2.3 ± 0.3 ‰) and a normal
carbon isotope effect (ɛC = -3.7 ± 0.4 ‰) were observed, which were slightly smaller
compared to the results of a former publication of Meyer et al. (ɛN = 3.3 ± 0.4 ‰, ɛC =
-5.4 ± 0.6 ‰)9, but gave the same dual element isotope plot (ΛArthroC/N = -0.6 ± 0.1)
confirming that the same mechanism was at work (see Figure 3A).
Oxidative dealkylation of atrazine with Rhodococcus sp. NI86/21 resulted in a normal
nitrogen isotope effect of ɛN = -2.0 ± 0.3 ‰ and a normal carbon isotope effect of ɛC =
-2.9 ± 0.7 ‰. These ɛ-values are similar to those published by Meyer & Elsner10 (ɛN = -1.5
± 0.3 ‰, ɛC = -4.0 ± 0.2 ‰) and Meyer et al.16 (ɛN = -1.4 ± 0.3 ‰, ɛC = -3.8 ± 0.2 ‰). The
slightly more pronounced nitrogen isotope fractionation in this study can probably be attributed to the fact that oxidation was primarily observed at the C-H bond adjacent to the nitrogen atom (α-position of the ethyl or isopropyl group, see closed mass balance in
Figure S5 in the SI)16. In the study of Meyer et al.16 48 % of the oxidation was observed
at the β-position of the ethyl or isopropyl group resulting in a smaller nitrogen isotope
4 5 6 7 8 9 10 11 12 13 14 15 16 17 18 19 20 21 22 23 24 25 26 27 28 29 30 31 32 33 34 35 36 37 38 39 40 41 42 43 44 45 46 47 48 49 50 51 52 53 54 55 56
Environmental
Science:
Processes
&
Impacts
Accepted
Manuscript
fractionation effect. The obtained regression slope of ΛRhodoC/N = 0.7 ± 0.1 in this study is
slightly larger than the previously reported regression slopes (ΛRhodoC/N = 0.4 ± 0.1)10, 16
which may again be explained by the small difference in average nitrogen isotope effects. Also here, however, the similar dual element isotope trend confirms that in this study
atrazine was transformed by the same mechanism as in Meyer et al.16 leading to the
observed oxidative dealkylation products by Rhodococcus sp. NI86/21.
4 5 6 7 8 9 10 11 12 13 14 15 16 17 18 19 20 21 22 23 24 25 26 27 28 29 30 31 32 33 34 35 36 37 38 39 40 41 42 43 44 45 46 47 48 49 50 51 52 53 54 55 56
Environmental
Science:
Processes
&
Impacts
Accepted
Manuscript
Figure 3. Isotope effects in microbial degradation of atrazine by A. aurescens TC1 (red)
and Rhodococcus sp. NI86/21 (blue) resulting in dual element isotope plots. (The 95 %
confidence intervals are given as values and as black lines next to the regression slopes).
4 5 6 7 8 9 10 11 12 13 14 15 16 17 18 19 20 21 22 23 24 25 26 27 28 29 30 31 32 33 34 35 36 37 38 39 40 41 42 43 44 45 46 47 48 49 50 51 52 53 54 55 56
Environmental
Science:
Processes
&
Impacts
Accepted
Manuscript
(A) Regression slopes of nitrogen and carbon isotope values (ΛC/N). (B) Regression
slopes of chlorine and carbon isotope values (ΛCl/C). (C) Regression slopes of chlorine
and nitrogen isotope values (ΛCl/N).
Multi-element isotope approach. Results of chlorine isotope analysis were combined
with data for carbon and nitrogen isotope measurements in dual element isotope plots
(see Figure 3B and C). For hydrolysis with A. aurescens TC1 regression slopes of
ΛArthroCl/C = 1.7 ± 0.9 and ΛArthroCl/N = -1.2 ± 0.7 were obtained. Oxidative dealkylation by Rhodococcus sp. NI86/21 resulted in regression slopes of ΛRhodoCl/C = 0.6 ± 0.1 and
ΛRhodoCl/N = 0.4 ± 0.2. Since the dual element isotope plots of chlorine and carbon and of
chlorine and nitrogen provide significantly different regression slopes for the respective elements, they can provide an additional line of evidence to differentiate the two degradation mechanisms of atrazine from each other.
Surprising mechanistic evidence from chlorine isotope effects. For degradation with
A. aurescens TC1, rather small chlorine isotope fractionation was observed (ɛCl = -1.4
± 0.6 ‰) despite the fact that the chlorine is cleaved off during hydrolysis (see Figure 1).
For oxidative dealkylation with Rhodococcus sp. NI86/21, the chlorine is not cleaved off
(see Figure 1), therefore, no or just a small chlorine isotope effect was expected.
However, here more pronounced chlorine isotope fractionation was observed (ɛCl = -4.3
± 1.8 ‰). 4 5 6 7 8 9 10 11 12 13 14 15 16 17 18 19 20 21 22 23 24 25 26 27 28 29 30 31 32 33 34 35 36 37 38 39 40 41 42 43 44 45 46 47 48 49 50 51 52 53 54 55 56
Environmental
Science:
Processes
&
Impacts
Accepted
Manuscript
The corresponding apparent kinetic isotope effects (AKIECl, see Table 1) were
compared to the AKIECl values of other studies focusing on the same degradation
mechanisms. In addition, the AKIECl values were compared to the theoretical maximum
Streitwieser Limit associated with the cleavage of a C-Cl bond (KIECl = 1.02)41-43 and to
the predictions of computational calculations (Table 2).
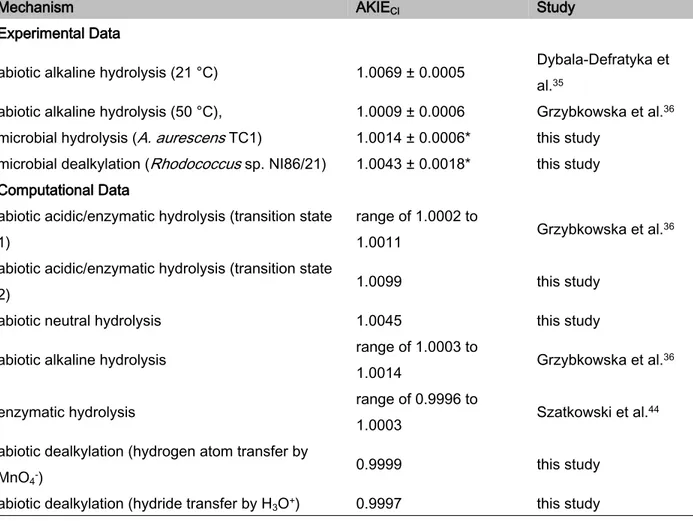
Table 1. AKIECl values associated with atrazine degradation.
Mechanism AKIECl Study
Experimental Data
abiotic alkaline hydrolysis (21 °C) 1.0069 ± 0.0005 Dybala-Defratyka et al.35
abiotic alkaline hydrolysis (50 °C), 1.0009 ± 0.0006 Grzybkowska et al.36
microbial hydrolysis (A. aurescens TC1) 1.0014 ± 0.0006* this study microbial dealkylation (Rhodococcus sp. NI86/21) 1.0043 ± 0.0018* this study
Computational Data
abiotic acidic/enzymatic hydrolysis (transition state 1)
range of 1.0002 to
1.0011 Grzybkowska et al.36 abiotic acidic/enzymatic hydrolysis (transition state
2) 1.0099 this study
abiotic neutral hydrolysis 1.0045 this study abiotic alkaline hydrolysis range of 1.0003 to
1.0014 Grzybkowska et al.36 enzymatic hydrolysis range of 0.9996 to
1.0003 Szatkowski et al.44 abiotic dealkylation (hydrogen atom transfer by
MnO4-) 0.9999 this study
abiotic dealkylation (hydride transfer by H3O+) 0.9997 this study
* calculated according to eq. 5
4 5 6 7 8 9 10 11 12 13 14 15 16 17 18 19 20 21 22 23 24 25 26 27 28 29 30 31 32 33 34 35 36 37 38 39 40 41 42 43 44 45 46 47 48 49 50 51 52 53 54 55 56
Environmental
Science:
Processes
&
Impacts
Accepted
Manuscript
For microbial hydrolysis of atrazine an experimental AKIEArthroCl value of 1.0014
± 0.0006 was calculated (see Table 1). Dybala-Defratyka et al.35 reported a more
pronounced AKIEalk.hydrol.
Cl value of 1.0069 ± 0.0005 (see Table 1). However, that study35
was conducted in an abiotic alkaline solution at 21 °C so that another hydrolysis pathway
was involved. Newer data reported a much smaller value of AKIEalk.hydrol.
Cl = 1.0009
± 0.000636 for the same alkaline hydrolysis at 50 °C. Later on it was confirmed that abiotic
alkaline hydrolysis performed earlier at 21 °C resembles rather neutral than alkaline conditions36.
Table 2 illustrates the different computed mechanisms that lie at the heart of the computational predictions. It shows the different mechanistic routes between the alkaline (substitution of Cl without protonation of the atrazine ring) and the acidic/enzymatic
pathway characterized in Meyer et al.9 (substitution of Cl with protonation of the atrazine
ring) include different possible transition states. Chlorine KIEs are, among other factors45,
determined by the percent extension of the C-Cl bond in the transition state. As this is directly related to the structure of the transition state, it can be linked to the C-Cl bond orders (Table 2), which decrease in the studied hydrolysis reactions when the C-Cl bond is more ruptured as compared to its length in the reactants, resulting in increased chlorine
KIEs. Previously performed computations36 and computations of this study mimicking
alkaline, acidic, and neutral conditions indicated that the largest AKIECl should be
expected under neutral conditions (except for transition state 2 of acidic/enzymatic hydrolysis). Under neutral conditions the C-Cl bond is elongated leading to a transition state geometry which differs substantially from hydrolysis reactions promoted either by
4 5 6 7 8 9 10 11 12 13 14 15 16 17 18 19 20 21 22 23 24 25 26 27 28 29 30 31 32 33 34 35 36 37 38 39 40 41 42 43 44 45 46 47 48 49 50 51 52 53 54 55 56
Environmental
Science:
Processes
&
Impacts
Accepted
Manuscript
alkaline or acidic conditions (see Table 2). However, hydrolysis at neutral pH is too slow to be of relevance. Computational calculations taking into account the transition state
structures at a molecular level predicted AKIECl values ranging from 0.9996 to 1.0014 for
alkaline, acidic and enzymatic hydrolysis (see Table 1 and 2)36, 44. Hence, on the
mechanistic level, the computational studies predict that the formation of a Meisenheimer complex rather than the subsequent C-Cl bond cleavage is the rate-determining step
during the nucleophilic aromatic substitution reaction catalyzed by TrzN36, 44. In both
abiotic pathways the C-Cl bond at the transition state of the rate determining step is
almost intact giving rise to very small AKIECl (the computed bond orders for both alkaline
and acidic hydrolysis are the same and equal to 1.03, see also Table 2). In this study, we
therefore observed a similarly small AKIEArthroCl value for enzymatic hydrolysis in
A. aurescens TC1 which resembles acid-catalyzed hydrolysis rather than alkaline
hydrolysis9. Hence, the picture emerges that different hydrolytic pathways give rise to
experimental AKIECl values much lower than the Streitwieser Limit of 1.0241-43 indicating
that the chlorine isotope effect is masked in all cases and that the C-Cl bond cleavage is not the rate-determining step. Interestingly, this is in contrast to ametryn hydrolysis where
strong sulphur isotope effects were observed in enzymatic hydrolysis by TrzN17. Further
experimental work, including degradation experiments with other strains, hydrolysis and crude enzyme experiments, will be required to further substantiate the picture on chlorine isotope effects observed in this study. For the moment, since chlorine isotope effects were found to be masked, we must conclude, however, that information from chlorine isotope
4 5 6 7 8 9 10 11 12 13 14 15 16 17 18 19 20 21 22 23 24 25 26 27 28 29 30 31 32 33 34 35 36 37 38 39 40 41 42 43 44 45 46 47 48 49 50 51 52 53 54 55 56
Environmental
Science:
Processes
&
Impacts
Accepted
Manuscript
analysis alone would not be enough to differentiate the different reaction mechanisms. This illustrates the importance of analyzing more than one element for mechanistic differentiation. 4 5 6 7 8 9 10 11 12 13 14 15 16 17 18 19 20 21 22 23 24 25 26 27 28 29 30 31 32 33 34 35 36 37 38 39 40 41 42 43 44 45 46 47 48 49 50 51 52 53 54 55 56
Environmental
Science:
Processes
&
Impacts
Accepted
Manuscript
25
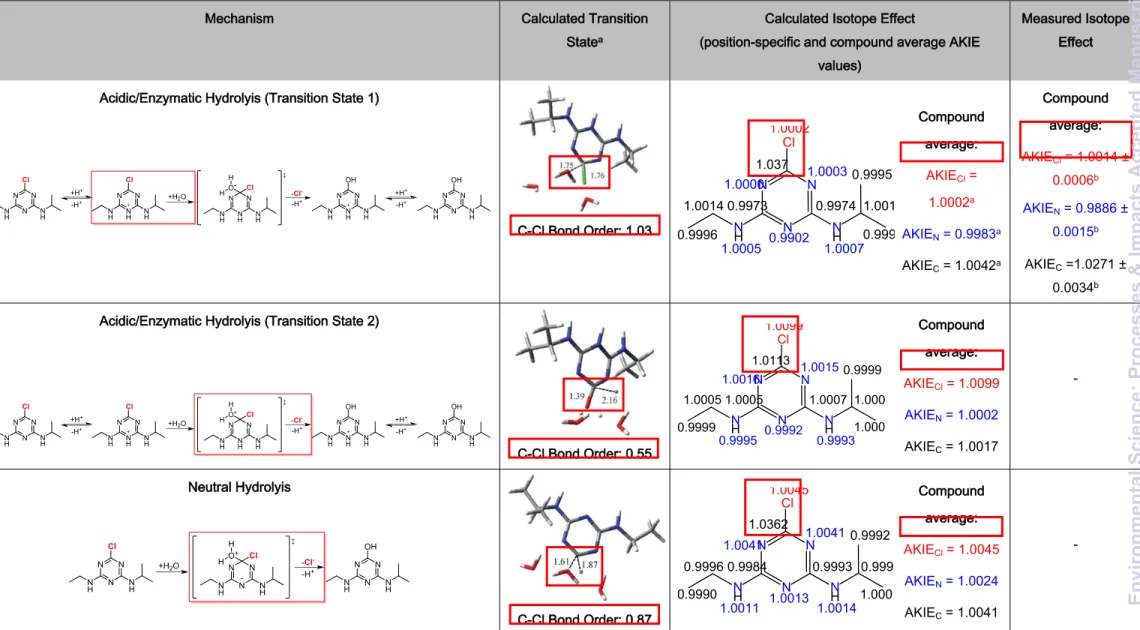
Table 2. Mechanisms and transition states of acidic/enzymatic, neutral and alkaline hydrolysis and corresponding
calculated and measured isotope effects.
Mechanism Calculated Transition Statea
Calculated Isotope Effect
(position-specific and compound average AKIE values)
Measured Isotope Effect Acidic/Enzymatic Hydrolyis (Transition State 1)
N N N N H NH Cl N N N OH N H N H N N H N N H NH Cl O+ H H +H+ -H+ N N H N N H NH Cl +H2O -Cl --H+ N N H N N H NH OH +H+ -H+ C-Cl Bond Order: 1.03 N N N N H NH Cl 1.0002 1.0003 0.9902 1.0000 1.0005 1.0007 0.9974 0.9973 1.037 1.0014 0.9996 1.0019 0.9997 0.9995 Compound average: AKIECl = 1.0002a AKIEN = 0.9983a AKIEC = 1.0042a Compound average: AKIECl = 1.0014 ± 0.0006b AKIEN = 0.9886 ± 0.0015b AKIEC =1.0271 ± 0.0034b
Acidic/Enzymatic Hydrolyis (Transition State 2)
N N N N H NH Cl N N N OH N H N H N N H N N H NH Cl O+ H H +H+ -H+ N N H N N H NH Cl +H2O -Cl --H+ N N H N N H NH OH +H+ -H+ C-Cl Bond Order: 0.55 N N N N H NH Cl 1.0099 1.0015 0.9992 1.0016 0.9995 0.9993 1.0007 1.0005 1.0113 1.0005 0.9999 1.0006 1.0000 0.9999 Compound average: AKIECl = 1.0099 AKIEN = 1.0002 AKIEC = 1.0017 -Neutral Hydrolyis N N N N H NH Cl N N N N H NH Cl O+ H H N N N OH N H N H -Cl --H+ +H2O C-Cl Bond Order: 0.87 1.0045 1.0041 1.0013 1.0041 1.0011 1.0014 0.9984 0.9993 1.0362 0.9996 0.9990 0.9998 1.0009 0.9992 N N N N H NH Cl Compound average: AKIECl = 1.0045 AKIEN = 1.0024 AKIEC = 1.0041
-Page 25 of 35 Environmental Science: Processes & Impacts 1 2 3 4 5 6 7 8 9 10 11 12 13 14 15 16 17 18 19 20 21 22 23 24 25 26 27 28 29 30 31 32 33 34 35 36 37 38 39 40 41 42 43 44 45 46 47 48 49 50 51 52 53 54 55 Environmental Science: Processes & Impacts Accepted Manuscript
26
a taken from Grzybkowska et al.36, b calculated according to eq. 5 with n = 5 for N and n = 8 for C, c taken from Meyer et al.9
Alkaline Hydrolyis N N N N H NH Cl N N N N H NH Cl O H N N N OH N H N H -Cl -+OH -C-Cl Bond Order: 1.03 1.0003 1.0010 1.0011 1.0009 1.0027 1.0026 1.0007 1.0007 1.0314 1.0001 1.0007 0.9998 1.0007 1.0006 N N N N H NH Cl Compound average: AKIECl = 1.0003a AKIEN = 1.0017a AKIEC =1.0043a Compound average: AKIECl = 1.0009 ± 0.0006a AKIEN = 1.001 ± 0.000c AKIEC =1.031 ± 0.003c Page 26 of 35 Environmental Science: Processes & Impacts
1 2 3 4 5 6 7 8 9 10 11 12 13 14 15 16 17 18 19 20 21 22 23 24 25 26 27 28 29 30 31 32 33 34 35 36 37 38 39 40 41 42 43 44 45 46 47 48 49 50 51 52 53 54 55 Environmental Science: Processes & Impacts Accepted Manuscript
For oxidative dealkylation, so far, no chlorine isotope effects were reported. Regarding
the reaction mechanism, Meyer et al.16 concluded that oxidative dealkylation of atrazine
with Rhodococcus sp. NI86/21 is initiated by hydrogen atom transfer based on the
observed product distribution and the carbon and nitrogen isotope effects. Hydrogen atom transfer leads directly to a homolytic cleavage of the C-H bond adjacent to the nitrogen atom (α-position of the ethyl or isopropyl group) producing a relative unstable
1,1-aminoalcohol which is then further transformed to DEA or DIA16. In parallel, two additional
products could be detected which were formed by oxidation of the C-H bond in the β-position of the ethyl or isopropyl group. For this mechanistic pathway, chlorine isotope effects would be expected to be rather small since the chlorine is not involved in the reaction steps. The closed mass balance of the concentration analysis (see Figure S5 in
the SI) of this study and the results of product distribution of Meyer et al.16 also indicate
that there is no C-Cl bond cleavage taking place since corresponding hydrolysis products were not detected. Furthermore, our computations for hydrogen atom transfer at a catalytic center mimicking cytochrome P450 predicted no chlorine isotope effect
(AKIEhydro.atom trans.Cl = 0.9999, see Table 1). Hydride transfer promoted by the hydronium
ion also resulted in no chlorine isotope effect (AKIEhydride trans.Cl = 0.9997, see Table 1). At
previously located transition state structures for these two reactions16 the carbon-chlorine
bond remains intact and no stretching of this bond is involved in the reaction coordinate
(hydrogen transfer) mode. The observed more pronounced AKIERhodoCl value of 1.0043
±0.0018 in this study (see Table 1) could, therefore, be indicative of isotope effects
4 5 6 7 8 9 10 11 12 13 14 15 16 17 18 19 20 21 22 23 24 25 26 27 28 29 30 31 32 33 34 35 36 37 38 39 40 41 42 43 44 45 46 47 48 49 50 51 52 53 54 55 56
Environmental
Science:
Processes
&
Impacts
Accepted
Manuscript
caused by enzymatic interactions. Meyer et al.16 proposed that for oxidative dealkylation
no selectivity itself is observed, however, the preferred oxidation of the α-position over the β-position could be explained by steric factors of the catalyzing enzyme which could have an influence on the transformation pathway. Thus, the sensitive chlorine isotope effect, which is observed even though the C-Cl bond is not cleaved during degradation, can be interpreted as an indicator that non-covalent interactions between the cytochrome P450 complex and the chlorine cause significant chlorine isotope
fractionation46.
CONCLUSION
Since atrazine is frequently detected in groundwater systems, major efforts should be put into understanding its environmental fate. We provide an approach to 3D-isotope (C, N, Cl) analysis of atrazine and explored isotope fractionation in different transformation pathways. Together, this provides the basis to more confidently assess sources and degradation of atrazine in the environment. Specifically, we demonstrated that pronounced changes in chlorine isotope values are not an indicator of microbial hydrolysis (as one might have expected without knowledge of our experimental data), but – surprisingly – rather of oxidative dealkylation. Therefore, although trends are different than expected, they can nonetheless be used for a more confident identification of different sources and transformation pathways in field samples. Regarding the sensitivity of chlorine isotope effects, our study demonstrates the importance of performing
4 5 6 7 8 9 10 11 12 13 14 15 16 17 18 19 20 21 22 23 24 25 26 27 28 29 30 31 32 33 34 35 36 37 38 39 40 41 42 43 44 45 46 47 48 49 50 51 52 53 54 55 56
Environmental
Science:
Processes
&
Impacts
Accepted
Manuscript
controlled laboratory experiments before applying the approach in the field. Specifically, in other cases chlorine isotope fractionation can be much more pronounced than observed for atrazine in this study. Large chlorine isotope effects were observed in
proof-of-principle experiments by Ponsin et al.20 studying hydrolytic dechlorination of
S-metolachlor, an herbicide containing also only one chlorine atom. Here preliminary data
suggest a large chlorine isotope effect of ɛCl = -9.7 ± 2.9 ‰ for abiotic alkaline hydrolysis.
Therefore, in the case of other substances chlorine isotope effects can be even more sensitive indicators of degradation provided that the C-Cl bond cleavage occurs in the rate-determining step of a reaction. Further, gaining deeper insights into these chemical processes is the basis for understanding the biotic catalysis of organic micropollutant degradation. This, in turn, is essential for identifying and developing optimized strategies for micropollutant removal in order to make successful bioremediation possible.
CONFLICT OF INTEREST
There are no conflicts to declare. ACKNOWLEDGMENT
This work was supported by the Swiss National Science Foundation (SNSF, Grant CRSII2_141805), the German Israeli Foundation for Scientific Research and
Development (GIF, Grant I-251-307.4-2013) and the National Science Center in Poland (Sonata BIS grant UMO-2014/14/E/ST4/00041). We thank PLGrid Infrastructure
4 5 6 7 8 9 10 11 12 13 14 15 16 17 18 19 20 21 22 23 24 25 26 27 28 29 30 31 32 33 34 35 36 37 38 39 40 41 42 43 44 45 46 47 48 49 50 51 52 53 54 55 56
Environmental
Science:
Processes
&
Impacts
Accepted
Manuscript
(Poland) for computer resources and Armin Meyer for his advice regarding the microbial degradation experiments.
REFERENCES
1. H. Gysin and E. Knusli, Chemistry and herbicidal properties of triazine
derivatives, Adv. in Pest Control Res., 1960, 3, 289-353.
2. EPA, Pesticides Industry Sales and Usage: 2008–2012 Market Estimates, US
Environmental Protection Agency, Washington (DC), 2017.
3. European Commission, Commission decision of 10 March 2004 concerning the
non‐inclusion of atrazine in Annex I to Council Directive 91/414/EEC and the withdrawal of authorisations for plant protection products containing this active
substance., Official Journal of the European Union, 2004, 78, 53-55.
4. R. Loos, G. Locoro, S. Comero, S. Contini, D. Schwesig, F. Werres, P. Balsaa,
O. Gans, S. Weiss, L. Blaha, M. Bolchi and B. M. Gawlik, Pan-European survey on the occurrence of selected polar organic persistent pollutants in ground water,
Water Res., 2010, 44, 4115-4126.
5. D. Vonberg, J. Vanderborght, N. Cremer, T. Pütz, M. Herbst and H. Vereecken,
20 years of long-term atrazine monitoring in a shallow aquifer in western
Germany, Water Res., 2014, 50, 294-306.
6. S. Singh, V. Kumar, A. Chauhan, S. Datta, A. B. Wani, N. Singh and J. Singh,
Toxicity, degradation and analysis of the herbicide atrazine, Environ. Chem. Lett.,
2018, 16, 211-237.
7. S. Kern, H. P. Singer, J. Hollender, R. P. Schwarzenbach and K. Fenner,
Assessing exposure to transformation products of soil-applied organic
contaminants in surface water: comparison of model predictions and field data,
Environ. Sci. Technol., 2011, 45, 2833-2841.
8. C. Moreau-Kervevan and C. Mouvet, Adsorption and desorption of atrazine,
deethylatrazine, and hydroxyatrazine by soil components, J. Environ. Qual. ,
1998, 27, 46-53. 4 5 6 7 8 9 10 11 12 13 14 15 16 17 18 19 20 21 22 23 24 25 26 27 28 29 30 31 32 33 34 35 36 37 38 39 40 41 42 43 44 45 46 47 48 49 50 51 52 53 54 55 56
Environmental
Science:
Processes
&
Impacts
Accepted
Manuscript
9. A. H. Meyer, H. Penning and M. Elsner, C and N isotope fractionation suggests similar mechanisms of microbial atrazine transformation despite involvement of
different Enzymes (AtzA and TrzN), Environ. Sci. Technol., 2009, 43, 8079-8085.
10. A. H. Meyer and M. Elsner, 13C/12C and 15N/14N Isotope Analysis To
Characterize Degradation of Atrazine: Evidence from Parent and Daughter
Compound Values, Environ. Sci. Technol., 2013, 47, 6884-6891.
11. A. H. Meyer, H. Penning, H. Lowag and M. Elsner, Precise and accurate
compound specific carbon and nitrogen isotope analysis of atrazine: critical role
of combustion oven conditions, Environ. Sci. Technol., 2008, 42, 7757-7763.
12. S. Reinnicke, D. Juchelka, S. Steinbeiss, A. H. Meyer, A. Hilkert and M. Elsner,
Gas chromatography-isotope ratio mass spectrometry (GC-IRMS) of recalcitrant target compounds: performance of different combustion reactors and strategies for standardization, Rapid. Commun. Mass. Sp., 2012, 26, 1053-1060.
13. K. Schreglmann, M. Hoeche, S. Steinbeiss, S. Reinnicke and M. Elsner, Carbon
and nitrogen isotope analysis of atrazine and desethylatrazine at sub-microgram
per liter concentrations in groundwater, Anal. Bioanal. Chem., 2013, 405,
2857-2867.
14. T. C. Schmidt, L. Zwank, M. Elsner, M. Berg, R. U. Meckenstock and S. B.
Haderlein, Compound-specific stable isotope analysis of organic contaminants in natural environments: a critical review of the state of the art, prospects, and
future challenges, Anal. Bioanal. Chem., 2004, 378, 283-300.
15. M. Elsner, Stable isotope fractionation to investigate natural transformation
mechanisms of organic contaminants: principles, prospects and limitations, J.
Environ. Monit., 2010, 12, 2005-2031.
16. A. H. Meyer, A. Dybala-Defratyka, P. J. Alaimo, I. Geronimo, A. D. Sanchez, C.
J. Cramer and M. Elsner, Cytochrome P450-catalyzed dealklyation of atrazine by
Rhodococcus sp. strain NI86/21 involves hydogen atom transfer rather than
single electorn transfer, Dalton Trans., 2014, 43, 12111-12432.
17. H. K. V. Schürner, J. L. Seffernick, A. Grzybkowska, A. Dybala-Defratyka, L. P.
Wackett and M. Elsner, Characteristic Isotope Fractionation Patterns in
s-4 5 6 7 8 9 10 11 12 13 14 15 16 17 18 19 20 21 22 23 24 25 26 27 28 29 30 31 32 33 34 35 36 37 38 39 40 41 42 43 44 45 46 47 48 49 50 51 52 53 54 55 56
Environmental
Science:
Processes
&
Impacts
Accepted
Manuscript
Triazine Degradation Have Their Origin in Multiple Protonation Options in the
s-Triazine Hydrolase TrzN, Environ. Sci. Technol., 2015, 49, 3490-3498.
18. T. B. Hofstetter and M. Berg, Assessing transformation processes of organic
contaminants by compound-specific stable isotope analysis, TrAC, Trends Anal.
Chem., 2011, 30, 618-627.
19. J. Renpenning, A. Horst, M. Schmidt and M. Gehre, Online isotope analysis of
37Cl/35Cl universally applied for semi-volatile organic compounds using
GC-MC-ICPMS, J. Anal. At. Spectrom., 2018, 33, 314-321.
20. V. Ponsin, C. Torrentó, C. Lihl, M. Elsner and D. Hunkeler, Compound-specific
chlorine isotope analysis of the herbicides atrazine, acetochlor and metolachlor,
Anal. Chem., 2019, 91, 14290-14298.
21. C. Lihl, L. M. Douglas, S. Franke, A. Pérez-de-Mora, A. H. Meyer, M. Daubmeier,
E. A. Edwards, I. Nijenhuis, B. Sherwood Lollar and M. Elsner, Mechanistic Dichotomy in Bacterial Trichloroethene Dechlorination Revealed by Carbon and
Chlorine Isotope Effects, Environ. Sci. Technol., 2019, 53, 4245-4254.
22. L. E. Erickson, Degradation of atrazine and related s-triazines, Crit. Rev. Env.
Con., 1989, 19, 1-14.
23. H. M. LeBaron, J. E. McFarland and O. C. Burnside, The triazine herbicides,
Elsevier, Oxford, 1 edn., 2008.
24. L. C. Strong, C. Rosendahl, G. Johnson, M. J. Sadowsky and L. P. Wackett,
Arthrobacter aurescens TC1 metabolizes diverse s-triazine ring compounds,
Appl. Environ. Microbiol., 2002, 68, 5973-5980.
25. K. Sajjaphan, N. Shapir, L. P. Wackett, M. Palmer, B. Blackmon, J. Tomkins and
M. J. Sadowsky, Arthrobacter aurescens TC1 Atrazine Catabolism Genes trzN,
atzB, and atzC Are Linked on a 160-Kilobase Region and Are Functional in
Escherichia coli, Appl. Environ. Microbiol., 2004, 70, 4402-4407.
26. I. Nagy, F. Compernolle, K. Ghys, J. Vanderleyden and R. De Mot, A single
cytochrome P-450 system is involved in degradation of the herbicides EPTC (S-ethyl dipropylthiocarbamate) and atrazine by Rhodococcus sp. strain NI86/21,
Appl. Environ. Microbiol., 1995, 61, 2056-2060.
4 5 6 7 8 9 10 11 12 13 14 15 16 17 18 19 20 21 22 23 24 25 26 27 28 29 30 31 32 33 34 35 36 37 38 39 40 41 42 43 44 45 46 47 48 49 50 51 52 53 54 55 56
Environmental
Science:
Processes
&
Impacts
Accepted
Manuscript
27. M. Elsner, L. Zwank, D. Hunkeler and R. P. Schwarzenbach, A new concept linking observable stable isotope fractionation to transformation pathways of
organic pollutants, Environ. Sci. Technol., 2005, 39, 6896-6916.
28. L. Zwank, M. Berg, M. Elsner, T. C. Schmidt, R. P. Schwarzenbach and S. B.
Haderlein, New evaluation scheme for two-dimensional isotope analysis to decipher biodegradation processes: application to groundwater contamination by
MTBE, Environ. Sci. Technol., 2005, 39, 1018-1029.
29. S. Reinnicke, A. Simonsen, S. R. Sørensen, J. Aamand and M. Elsner, C and N
Isotope Fractionation during Biodegradation of the Pesticide Metabolite
2,6-Dichlorobenzamide (BAM): Potential for Environmental Assessments, Environ.
Sci. Technol., 2012, 46, 1447-1454.
30. T. Gilevska, M. Gehre and H. H. Richnow, Multidimensional isotope analysis of
carbon, hydrogen and oxygen as tool for identification of the origin of ibuprofen,
J. Pharm. Biomed. Anal., 2015, 115, 410-417.
31. J. Palau, O. Shouakar-Stash, S. Hatijah Mortan, R. Yu, M. Rosell, E.
Marco-Urrea, D. L. Freedman, R. Aravena, A. Soler and D. Hunkeler, Hydrogen Isotope Fractionation during the Biodegradation of 1,2-Dichloroethane: Potential for Pathway Identification Using a Multi-element (C, Cl, and H) Isotope Approach,
Environ. Sci. Technol., 2017, 51, 10526-10535.
32. S. Franke, C. Lihl, J. Renpenning, M. Elsner and I. Nijenhuis, Triple-element
compound-specific stable isotope analysis of 1,2-dichloroethane for characterization of the underlying dehalogenation reaction in two
Dehalococcoides mccartyi strains, FEMS Microbiol. Ecol., 2017, 93, fix137.
33. T. Kuder, B. M. van Breukelen, M. Vanderford and P. Philp, 3D-CSIA: Carbon,
Chlorine, and Hydrogen Isotope Fractionation in Transformation of TCE to
Ethene by a Dehalococcoides Culture, Environ. Sci. Technol., 2013, 47,
9668-9677.
34. B. Heckel, K. McNeill and M. Elsner, Chlorinated Ethene Reactivity with Vitamin
B12 Is Governed by Cobalamin Chloroethylcarbanions as Crossroads of
Competing Pathways, ACS Catal., 2018, 8, 3054-3066.
4 5 6 7 8 9 10 11 12 13 14 15 16 17 18 19 20 21 22 23 24 25 26 27 28 29 30 31 32 33 34 35 36 37 38 39 40 41 42 43 44 45 46 47 48 49 50 51 52 53 54 55 56
Environmental
Science:
Processes
&
Impacts
Accepted
Manuscript
35. A. Dybala-Defratyka, L. Szatkowski, R. Kaminski, M. Wujec, A. Siwek and P. Paneth, Kinetic isotope effects on dehalogenations at an aromatic carbon,
Environ. Sci. Technol., 2008, 42, 7744-7750.
36. A. Grzybkowska, R. Kaminski and A. Dybala-Defratyka, Theoretical predictions
of isotope effects versus their experimental values for an example of uncatalyzed
hydrolysis of atrazine, Phys. Chem. Chem. Phys., 2014, 16, 15164-15172.
37. C. Lihl, J. Renpenning, S. Kümmel, F. Gelman, H. K. V. Schürner, M. Daubmeier,
B. Heckel, A. Melsbach, A. Bernstein, O. Shouakar-Stash, M. Gehre and M. Elsner, Toward Improved Accuracy in Chlorine Isotope Analysis: Synthesis Routes for In-House Standards and Characterization via Complementary Mass
Spectrometry Methods, Anal. Chem., 2019, 91, 12290-12297.
38. D. Hunkeler, R. U. Meckenstock, B. Sherwood Lollar, T. Schmidt, J. Wilson, T.
Schmidt and J. Wilson, A Guide for Assessing Biodegradation and Source
Identification of Organic Ground Water Contaminants using Compound Specific
Isotope Analysis (CSIA), O. o. R. a. Development Report PA 600/R-08/148 |
December 2008 | www.epa.gov/ada, US EPA, Oklahoma, USA, 2008.
39. J. Bigeleisen, The relative reaction velocities of isotopic molecules, J. Chem.
Phys., 1949, 17, 675-679.
40. V. Anisimov and P. Paneth, ISOEFF98. A program for studies of isotope effects
using Hessian modifications, J. Math. Chem., 1999, 26.
41. A. Streitwieser Jr, R. Jagow, R. Fahey and S. Suzuki, Kinetic isotope effects in
the acetolyses of deuterated cyclopentyl tosylates1, 2, J. Am. Chem. Soc., 1958,
80, 2326-2332.
42. K. Świderek and P. Paneth, Extending limits of chlorine kinetic isotope effects, J.
Org. Chem., 2012, 77, 5120-5124.
43. L. Szatkowski and A. Dybala-Defratyka, A computational study on enzymatically
driven oxidative coupling of chlorophenols: An indirect dehalogenation reaction,
Chemosphere, 2013, 91, 258-264.
44. L. Szatkowski, R. N. Manna, A. Grzybkowska, R. Kamiński, A. Dybala-Defratyka
and P. Paneth, in Methods in enzymology, Elsevier, 2017, vol. 596, pp. 179-215.
4 5 6 7 8 9 10 11 12 13 14 15 16 17 18 19 20 21 22 23 24 25 26 27 28 29 30 31 32 33 34 35 36 37 38 39 40 41 42 43 44 45 46 47 48 49 50 51 52 53 54 55 56
Environmental
Science:
Processes
&
Impacts
Accepted
Manuscript
45. A. Dybala-Defratyka, M. Rostkowski, O. Matsson, K. C. Westaway and P. Paneth, A New Interpretation of Chlorine Leaving Group Kinetic Isotope Effects;
A Theoretical Approach, J. Org. Chem., 2004, 69, 4900-4905.
46. A. Siwek, R. Omi, K. Hirotsu, K. Jitsumori, N. Esaki, T. Kurihara and P. Paneth,
Binding modes of DL-2-haloacid dehalogenase revealed by crystallography,
modeling and isotope effects studies, Arch. Biochem. Biophys., 2013, 540,
26-32. Graphical Abstract: 4 5 6 7 8 9 10 11 12 13 14 15 16 17 18 19 20 21 22 23 24 25 26 27 28 29 30 31 32 33 34 35 36 37 38 39 40 41 42 43 44 45 46 47 48 49 50 51 52 53 54 55 56