by
CYRIL J. GALVIN, JR. B.S., Saint Louis University
(1957)
SUBMITTED IN PARTIAL FULFILLMENT OF THE REQUIREMENTS FOR THE DEGREE OF MASTER OF SCIENCE
at the
MASSACHUSETTS INSTITUTE OF TECHNOLOGY June, 1959
Signature of Author ... - .
Department of Geology and Geophysics, May 25 Certified by . .... ... ...
Thesis Supervisor
Accepted by .....- '.'.- . .4.
DETERMINATION OF PRINCIPAL STRAINS FROM DEFORMED BRACHIOPODS
by
Cyril J. Galvin, Jr.
Abstract
It is possible to compute the magnitudes and directions priaicipal strains from any fossil in which at least two of three mutually perpendicular lines remain recognizable after deformation. Ratios of lengths of these lines in deformed and undeformed fossils, and angular changes from the perpendicular of these lines in deformed fossils constitute the basic data. From Nadaits graphical represent~ ation of strain on the Mohr diagram this data yields the magnitude and direction of principal strains for a particular case of deformation. For the general case of deformation this theory approximately deter~ mines elongations in three, non-principal directions of each fossil.
The procedure is applied to the brachiopod Leptocoelia flabellites from folded Devonian rocks in northwestern Maine. Two determina-tions of principal strains indicate that the maximum strain axis
approximately parallels the fold axis and the intermediate strain axis is perpendicular to the cleavage. Computations of non-principal elongations support these results.
Two strain axes lie in the plane of cleavage: the maximum strain axis (about 50% extension) parallel or sub.parallel with the fold axis, and probably the minimum strain axis (about 25% shortening) approxi-mately perpendicular to the fold axis. Directions of principal strains indicated for Tarratine rocks are unlike published results in the literature, but further results are needed to verify this.
$train is probably not homogeneous over a distance 15 meters along strike.
page ABSTRACT 2 INTRODUCTION 7 The Problem 7 Acknowledgements 9 Outline of Investigatipn 11 HISTORICAL REVIEW 12 Deformed Fossias 1z Deformed Ooids 22 Deformed Pebbles 23
Summary of Previous Work 26
GEOLOGY OF THE AREA SOUTHEAST OF TARRATINEI MAINE 30
The Tarratine Formation 30
Shell Beds 32 Structural Geology 34 Tectonic History 39 METHOD 41 Leptocoelia Flabellites 41 Description 41 Parameters 45 Growth curves 48
Sample Collection and Preparation 56
Collection 56
Preparation 57
Position Data 61
Instrument description 61
Strain Data 65 LI, W', Tt measurements 66 p and
4
measurements 67 THEORY 68 Definition 68 Mohr Diagrams 69Mohr diagrams for unstrained state 70 Mohr diagrams for strained state 71 Mohr Diagrams Applied To Leptocoelia Steinkerns 72
Initial information 72
Strain on ),T, y1 plane 76
Determination of principal strains 78 Summary of strain determination in Leptocoelia
steinkerns 85
RESULTS 87.
Strain in Leptocgelia Steinkerns 87
Principal strains 87 Parameter elongation 87 Analysis of Errors 93 Experimental errors 93 Theoretical assumptions 94 SUMMARY 98 Conclusions 98
Suggestions for Future Work 99
BIBLIOGRAPHY 101
APPENDIX 106
Figure Page 1 Distribution of bedding, joints, cleavage, and faults
in the Tarratine formation 37
2 Leptocoelia steinkern terminology 42 3 L vs. W for Leptocoelia steinkerns 50 4 T vs. W for Leptocoelia. steinkerns 52 5 Samples of fossiliferous Tarratine sandstone 58
6 Goniometer and strain gage 63
7 Possible angle changes resulting from deformation 74 8 LWT vs. W for Leptocoelia steinkerns 83 9 Principal strains in C3 and elongation in C2A,
C3, C5A 88
Plate
Plate I Outcrop Map and Cross Section of Lower Tarratine
Tables
Table Page
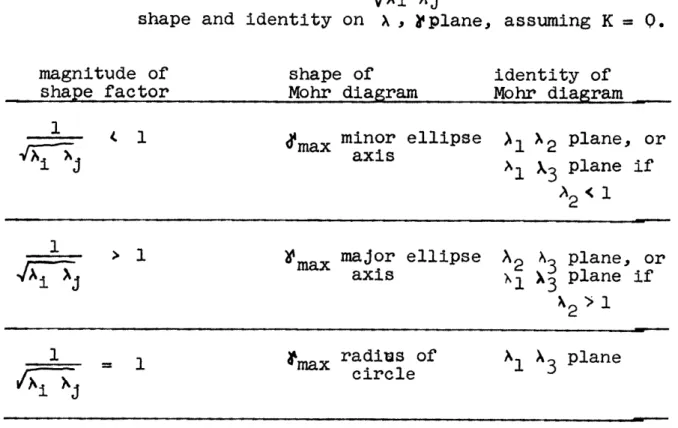
I Previous strain measurements in rocks 13 II Relation of to the shape of the Mohr diagram
1 3
in the unstrained state 81
III Measurements of deformed Leptocoelia steinkerns 91 IV Deformation characteristics of CZA, C3, and C5A 92
For more than a century, the geometry and genesis of folds in the earth's crust have been studied by structural geologists, but although much information has accumulated about their spatial distribution, there is little detailed knowledge of how folds develop. To understand the genesis of folds, geologists still lack basic geometric information about the character of strain involved in folding.
A fold is the final product of a long deformational
history, but reconstruction of this history is impossible without an accurate knowledge of the original and inter-mediate states through which the deformed rocks have passed. If folded rocks contain objects whose original unstrained shapes are adequately known (for example, fossils), then at least the initial and final stages in this history can be learned, although the exact path between these stages is still ambiguous.
It is the purpose of this paper to compare the present strained state with the inferred undeformed state of 300 meters of sandstone and slate from the Tarratine formation
on the southeastern limb of the Moose River synclinorium in northwestern Maine. This comparison between initial and
final strain states is made possible by the frequent inclusion, in the sandstone, of shell beds containing many deformed
specimens of the brachiopod Leptocoelia flabellites, whose original shape is known from collections in undeformed areas. By measuring changes in shape of the deformed Leptocoelia, this study attempts to show quantitatively the finite geometric changes introduced into these rocks by folding.
In particular, this study tries to determine: 1) the strain at given localities; 2) the size of the region over which strain is homogeneous; 3) the variation in strain
along and across a minor fold on the limb of the synclinorium. Like the ordinary structural field investigation, this is a study of the geometry of deformed rocks, but it differs
by being more quantitative and on a very small scale. Also
like the ordinary field investigation, the results are strictly applicable only to the area studied. And since this is a study of geometric changes only, the results are insufficient to describe the nature of the deforming forces.
However, it is reasonable to assume that folded rocks elsewhere in the crust of the earth will show similarities to those in northwestern Maine, and that the forces which produce these folds do have some relationship to the amount and type of strain produced. Thus it is hoped that the
results of this study will indicate qualitatively how folding
in general might have occurred, as well as describe quanti-tatively how it did occur in a small area in northwestern Maine.
Massachusetts Institute of Technology, suggested this study and supervised the work. The application of the theory of finite strain to deformed fossils, and the
design of the goniometer and strain gage are due largely, to Brace. The writer is also indebted to Brace for aid in collecting oriented samples of fossils near Tarratine, Maine, and for critically reviewing earlier versions of
this paper.
A. J. Boucot, Assistant Professor of Geology at
Massachusetts Institute of Technology, suggested the suitability of the Tarratine locality for this study, aided in paleontologic problems, suggested the use of the goniometer, and read part of the manuscript.
Permission to measure steinkerns of Leptocoelia flabellites from the Camden chert collection at the United States National Museum was obtained from G. A. Cooper. The
steinkerns from the Highland Mills member of the Esopus formation were supplied by Boucot. Permission to borrow and measure steinkerns from the Shaler collection at the Museum of Comparative Zoology of Harvard was obtained from
H. D. Whittington.
Richard Maehl and John Griffin, geology students at Massachusetts Institute of Technology, suggested the
inter-pretation of cleavage-bedding relationships at the Tarratine railroad cut.
This study was supported by a grant, to Brace, from the Geological Society of America.
The opportunity to make this study under active
supervision and with adequate facilities is gratefully
Outline of Investigation
This paper begins with a review of previous
studies of finite strain in fossils, ooids, and pebbles. The second section describes the structure and strati-graphy of the rocks southeast of Tarratine, Maine from which fossils used in this study were collected.
These fossils, the steinkerns of Leptocoelia flabellites, are described, and the parameters selected for measurement are defined. Measurements of Leptocoelia steinkerns from rocks of Tennessee, New York, and Quebec are presented to show the natural variation of the para-meters as a function of the size of the steinkern. The method of collecting, preparing, and measuring the stein-kerns is described.
The theory of finite strain, graphically illustrated
by Mohr diagrams, is used to analyze the data obtained
from measuring Tarratine steinkerns. The state of strain thus determined for Tarratine steinkerns is compared with results obtained by previous investigators in different
areas using different geologic strain gages. Possible errors in measurement, and the validity of assumptions necessary for this study are discussed.
Symbols used in this paper are summarized in the appendix.
HISTORICAL REVIEW
Deformed Fossils
The previous application of deformed fossils to the study of strained rocks, and the analogous use of stretched pebbles and ooids is here briefly outlined. For ease of comparison, the conclusions of principal studies
are presented in Table I.
Wherever possible in Table I, the maximum,
inter-mediate, and minimum axes (4.C 1' 4>'2' \'3) of the strain ellipsoid are listed, and their directions in a,b,c coordi-nates are given. a is assumed to be the dip direction of cleavage, b the axial direction of folds, and c the normal to cleavage. The particular object whose strain was
measured, the type and age of rock from which it came, and the geographic location of the rocks are also listed
where-ever possible.
The information for some of the studies, particularly those in French, has been obtained from reviews by Cloos
direction of the fold axes, and c is normal to the cleavage. Direction of tectonic transport is not implied. ,1' 2'
are the maximum, intermediate, and minimum axes of the strain ellipsoid. Where not otherwise stated, values have been computed from averages of the original data.
Refer-ences not examined first hand are marked by an asterisk. This table includes many of the important papers on strain measurements, but it is not a complete bibliography of the
Phillips, 1844 no measurements; IT in b? brachiopods, slates, and North Devon trilobites, flagstones
algae
Sharpe, 1847 1.5 + ? in a 1 in b <1 in c spirifers slates Tintagel
trilobites U. Dev.? Petherwin
Sorby,1853*, 1908 1.6 in a 1.0 in b 0.27 in c spots in Welsh slates Wales (recomputed Cloos- 1947, slates
p. 847)
Haughton, 1856 1.79 in b 1.64 in a .44 in c spirifers slates, Sil. and 8 loc.
~~trilobites Carboniferous including
Tintagel & Petherwin
Dufet, 1875 47, = T2 in plane of trilobites shist
shistosity
T3
perpendicular toshistosity (Breddin, 1956a, p. 239)Wettstein, 1886
4ig
A 272
JX
in a fish skeletons shists, chalks Kanton Glarus,1 2 b Oligocene Switz.
(Heim, 1921, p. 89)
Chapman, 1893* 1.4 1 .7 - average ooids limestone Ilfracombe
3 1 .3 - extremes
1 2 3
Sieburg, 1909 & TX2 in cleavage ooids limestone Thuringia
Loretz, 1882*
plane (Cloos, 1947)
Heim, 1921 1.6 .79 .79 fossils, pebbles varied litho- Switzerland
2.9 .58 .58 and ooids gies
r > 10 for some intensely Cret. and
deformed rocks Jurassic
(Cloos, 1947)
Runner, 1934 4 in b in a m2 4ig in c pebbles conglomerate Black Hills
Pre-Cambrian
Fairbairn, 1937 b V 2in in a in c quartz pebbles conglomerate Patricia
1 2Pre-Cambrian District,
Ontario
Mehnert, 1939* 2 =
8
3 coarse quartzite Meta conglomerate Saxony2TTm2(10 to 12)
\
dense graywacke218
43
shistosegray-wacke & shales (Cloos, 1947) Strand, 1944 2.7 Goldschmidt 1916* 2.6
.83
.87
.46 in c.43 quartzite boulders and cobbles quartzite cong. Eo-Cambrian Southcentral H NorwayReference Strain Ellipsoid
axes and directions strain gagegeologic
rock age
and lithology location
Kvale, 1945 7.5 1.2 .12 quartzite quartzite Bergen,
,R1 parallel lineation pebbles conglomerate Norway
based on a 2:1:1 ellipsoid
Cloos, 1947 1.45 in a 1.05 in b .66 in c ooids oolites Maryland,
average value Cambrian Pennsylvania
Ordovician
Oftedahl, 1948 2.0 1.2 0.42 in c pebbles conglomerate Central
no folding say Oftedahi Eo-Cambrian Norway
4Xl 1 2 in cleavage plane based on sphere
Flinn, 1955 2.1 in b .97 in a .48 in c quartzite conglomerate Shetland
based on sphere pebbles pre-Old Red ss. Islands
Elwell, 1955
3.5
in b 0.9 in a .3 in c ss.& granitic conglomerate County Mayobased on sphere cobbles Dalradian
Hellmers, 1955 1.06 1.06 .85 in c
computed by Breddin, 1957 ~
crinoid plates sandstones
L. & M. Dev. rh. Schieferge-birge Breddin, 1956b i 1.35 1.35 ii 1 1 .85 in c .85 in c iii2.0 in a 1.3 in b .35 in c brachiopods, pelecypods, trilobites, crinoid plates, cephalopods shales; slightly sandy shales; sandy shales, gray-wacke Devonian and Carboniferous i most of rh. Schiefergebirge ii Karbongurtel iii Venmassiv .
Recognition of deformed fossils occurred at least as early as 1814 (Bucher, 1953, p. 276). In 1829, De la Beche used the existence of belemnites in garnetiferous mica shist of the Alps to disprove the Wernerian idea that metamorphic rocks are, a priori, the geologically most ancient rocks.
About the same time, fossils were identified in meta-morphic rocks of Massachusetts by Edward Hitchcock (1835), and later they were found in metamorphics of the Urals, Brittany, Norway, Venezuela, and elsewhere. The history of
the discovery of fossils in metamorphic rocks is thoroughly reviewed by Bucher (1953).
Early descriptive study of deformed fossils was con-cerned with proving the fossils' existence, and establishing the sedimentary origin of some metamorphic rocks. This study continued through the 19th century, and in modified form, still continues at present (Boucot, et al, 1958).
The importance of deformed fossils as measurements of strain in rocks was recognized by British geologists in the middle of the 19th century. Possibly the first recorded use of deformed fossils to measure strain is a comment by Phillips
(1844, p. 61) that "in the space occupied by a trilobite, it [the change in length] amounts to a quarter, or even half an inch." The author interprets Phillips' brief paper to indicate maximum extension parallel to the strike of cleavage in b. Phillips suggests that fossil deformation might be
useful in explaining the origin of cleavage.
Three years later, Sharpe (1847) made the following conclusions from a study of the relations between deformed spirifers and trilobites, and slatey cleavage: 1) maximum shortening is perpendicular to planes of cleavage, 2) max-imum extension is in the direction of dip of cleavage, and
3) in the direction of strike of cleavage, there is no
evidence for change in length. No measurements are given. Later, Sharpe (1849) supported his conclusions with evidence from deformed spots in slates.
These "spots in Welsh slates" were shortly afterwards investigated by Sorby (1853) who furnishes the first quanti-tative measurements of deformation, shown in Table I. By making assumptions concerning volume change and the
inter-mediate axis of strain, Sharpe's conclusions are quantitatively confirmed. Much later in a paper based on this 1853 work,
but published posthumously in 1908, Sorby makes the earliest attempt known to the author to calculate volume change due to deformation.
Haughton applied Cauchy's ellipsoid to the study of deformed fossils, including some of the same specimens studied previously by Sharpe (Haughton, 1856, p. 415), but he got
different results. The measurements, averaged in Table I, indicate that maximum extension is usually parallel to the strike of cleavage, and rarely parallel to the dip of cleavage as Sharpe had concluded. The difference between maximum and
intermediate axes of strain, FA and A 2' is small. For some reason, Haughton does not mention Sorby's earlier study on slate spots.
During the last quarter of the 19th century, European
geologists, including Dufet (1875), Daubree (1876, 1879), Albert Heim (1878, 1921), Janettag (1884) and others,
studied the relation of deformed fossils to shistosity and cleavage.
Heim's encyclopedic study of Swiss geology included observations on deformed pebbles, oolites, and fossils, particularly the use of belemnites in determining direction and amount of strain. Some of his results are included in Table I.
Hellmers (1955) applied Cloos' oolite technique (see below page 22) to the limited two dimensional problem of
crinoid columnals in a bedding plane. His study showed that the magnitude of maximum strain in the bedding plane
de-creased systematically across the rheinische Schiefergebirge, and that the direction of maximum strain varied from parallel
to fold axes in one region to independent of fold axes in another region.
At the time Hellmers published his paper, the problem of crinoid columnal deformation in the same region was being investigated by Hans Breddin as part of his extensive study of fossil deformation in the rheinische Schiefergebirge
the quantitative values of strain, but both studies agree in the direction of strain increase.
Breddin's recent papers include a detailed presentation of the theory of finite strain applied to deformed fossils
(1956a) and an application of this theory to regions about the Schiefergebirge (1956b, 1957).
Strain is measured in brachiopods, pelecypods, cephalo-pods, trilobites, and crinoids. Measurements are taken in the bedding plane to eliminate distortion due to compaction from the weight of overlying sediments.
Breddin assumed that the cleavage plane contains the direction of maximum and intermediate extension, and that generally maximum shortening is perpendicular to this plane. Volume changes due to tectonic deformation are assumed to be
15, 10, 5, and 0% for shale, slightly sandy shale, sandy shale, and sandstone respectively. It is emphasized that strain in fossils gives a minimum value for strain in the inclosing rocks.
Numerous measurements of varied fossil types from wide-spread localities in the Schiefergebirge indicate that defor-mation has been accomplished by shortening perpendicular to
the cleavage, and equal extension in all directions parallel to the cleavage. Exceptions to this rule are the Karbongurtel rocks where deformation was accomplished by shortening per-pendicular to the cleavage without corresponding extension in the plane of the cleavage, and rocks of east Sauerland where
extension in the dip of cleavage exceeds extension parallel to the strike of cleavage. Save for this last example, deformation in the rheinische Schiefergebirge is character-ized by a strain ellipsoid of rotation whose equator lies in the plane of cleavage.
Deformation in fossils supplies constructive information to the structural geologist, but to the paleontologist such deformation causes taxonomic confusion. Occasionally plates figured by paleontologists exhibit obviously deformed
specimens (Dawson, 1855, p. 317, fig. 35c; Barrande, 1852, plates 31, 35, 36; Hall, 1859, pl. XLVII, fig. 8), but be-cause deformed fossils have doubtful value for classification,
such pictures are infrequent. But when the fossil has no original symmetry, or when elongation parallels a direction of original symmetry, the undetected distortion of lengths
and angles may lead to the establishment of new, but imaginary, species.
As an example of this, Crickmay (1933, p. 52) des-dribes how Hyatt unwittingly set up pelecypod "species"
whose specific differences were established, not by inherited characteristics, but by orientation of the shell with respect to the directions of strain.
Another example is the Oligocene fish collection from the Glarnerschiefer beneath the Glarus overthrust in Switzer-land. Originally the fish skeletons were classified into
show, by applying the theory of plane finite strain, that most of Agassiz "species" had identical shapes when the effects of deformation were removed.
Most paleontologists do not discuss the problem of removing the effects of deformation, but they frequently mention deformed specimens (Elles, 1944; Imlay, 1939, and many others). Lake (1943) suggests a photographic technique of removing strain. Some fossils, such as deformed
Scolithus (Wanner, 1890), or ostracods (Johnson, 1936, p. 8),
would be valuable geologic strain gages for future study because of their simple geometry.
Deformed Ooids
The simplest of all original shapes for the study of strain is a sphere, and in common deformed rocks, the nearest approach to spheres are ooids (defined as in Cloos, 1947). Loretz (1882) and Sieburg (1909) studied Thuringian oolitic limestones, and noted that maximum and intermediate exten-sions lie in the cleavage plane. Chapman (1893) observed deformed oolites at Ilfracombe. Heim (1921) pictures de-formed ooids.
Ernst Cloos (1947) used deformed ooids in a thorough
study of strain in folded rocks. In this study, thin sections
were cut on mutually perpendicular planes in oriented oolite samples collected from known localities on the recumbent South Mountain fold. By assuming that the ooids had been originally spherical, and that no volume change had occurred,
strain was calculated from the elliptical outlines of the
deformed ooids.
Regional oolite deformation was found to vary continu-ously across South Mountain, reaching a maximum in the lower limb. Locally, strain varies unsystematically in small folds
(p. 881), or in parts of the major fold (p. 880). The
average maximum strain axis is 1.36 on the upper limb and
1.56 on the overturned lower limb.
Without exception the maximum and intermediate strain axes, A1 and 2' lie in the plane of cleavage, and the least strain axis,
4i3,
normal to it. Cleavage attitude varies with position on the fold, forming a fan opening tothe southeast which is the direction of overturning.
, or the maximum strain, is oriented in the dip of cleavage in almost all cases. Extension has occurred parallel with the fold axes (in b), but it is usually very small. Linear structures, the presence or absence of
cleavage, or intensity of folding show no relation to exten-sion in b.
Stretched Pebbles
Besides ooids, pebbles are common subspherical com-ponents of deformed rocks, but for pebbles, the original shape is less certainly spherical.
Stretched pebbles are reported at least as early as
study of deformed fossils, most pebble investigations are relatively recent, and have been carried out by structural petrologists in an effort to correlate grain orientation with macroscopic features. The relationship of pebble elongation
to grain orientation and the direction of tectonic transport has recently been critically discussed by Turner (1957), but
the subject cannot be reviewed here.
Pebbles with their long axes parallel with fold axes have been noted by Fairbairn (1937), Cloos (1936), and
Runner (1934). Fairbairn and Runner both report that local geologic evidence indicates that the pebbles were deformed
only once.
Kvale (1945) measured greatly elongated pebbles from east of Bergen. Strand (1945) studied the Bygdin conglomer-ate which had previously been investigconglomer-ated by Goldschmidt
(1916). Kvale and Strand both found the long axes of pebbles parallel with the axes of minor folds, but in both studies
the direction of tectonic transport was also interpreted to lie parallel with these folds.
Oftedahl (1948) made a regional study of deformed quartz conglomerates in central Norway including samples from the Bygdin conglomerate of Strand's study. It is re-ported that the rocks have not been folded. By making the usual assumption of no volume change and an original spherical
shape for the pebbles, it is shown that strain is three di-mensional.
In a study of quartzite pebble deformation in central Vermont, Brace (1955) found that the long axes of pebbles
are subnormal to fold axes, a condition which has not been ob-served regionally in any other work known to the author.
Adjoining pebbles had radically different fabric diagrams, and no correlation was found between the intensity of maxima, and extension of pebbles. Brace suggested that some of the fabric is residual from earlier deformation.
Flinn (1956) describes the rapid increase of defor-mation away from a thrust fault in the FunZie conglomerate of the Shetland Island. The long and intermediate axes of
pebbles lie approximately in the plane of shistosity. Pebbles are elongated parallel to the strike of shistosity or linea-tion in the north, and about 40* from the strike of shistosity in the south of the area studied.
Ewell (1955) describes flattened and elongated cobbles from the Dalradian of Mayo, and concludes that they have been elongated in b by rolling. Deformation varies widely in neighboring outcrops.
Mehnert (1939) demonstrated the relation between defor-mation and composition of pebbles. That quartzite pebbles are less deformable than graywacke pebbles, and graywacke
pebbles are less deformable than shistose graywacke, as Mehnert showed, may seem intuitively obvious, yet the study is valuable because it indicates that, in at least some cases, the relative strengths of different pebble compositions under
ordinary surface conditions of temperature and pressure retain the same relationships under the extraordinary
conditions of diastrophism.
Summary of Previous Work
The accumulated values for both magnitude and
direction of principal strain axes are apparently contra-dictory. Much of the apparent confusion may result from differences in geologic history of the areas investigated, differences in composition of the material investigated, differences in assumptions and methods of investigations, and finally differences in personal prejudices of the
investigators. There are, however, tentative conclusions to be drawn from the work reviewed above.
Examination of Table I indicates that both direction and magnitude of maximum elongation \ can be correlated with the particular geologic strain gage used for measure-ments. Almost all studies of stretched pebbles find rX 1 parallel to fold axes, but almost all studies of deformed fossils and ooids find -AI = r32, o 1 perpendicular
to fold axes. Similarly, it is obvious that strain in
quartzose pebbles is surprisingly greater than in calcareous fossils and ooids. Possibly this second correlation results from too much strain obliterating the fossils and ooids
used to measure it.
be
probably accidental correlation between age and the lithology of the rock whose strain has been investigated. In part
this is due to the late arrival of fossils in the geologic
column.
Although their directions and magnitudes differ, 4X and r 2 are always reported to lie in the plane of
cleavage, or shistosity. 5 3 is normal to the AE 2 plane. The relation between strain axes and cleavage or shistosity is important in any theory of origin of these features, but it is not apparent from the literature whether the 'X 1 2 plane is identical to, or only closely
approximated by the plane of cleavage or shistosity.
Regional studies of Cloos, Flinn, Breddin, Hellmers, Strand, and Oftedahl show continuous, systematic variations of average strain which can be correlated with geologic
structures, but the variation at any given locality is often unsystematic.
Elwell reported extremely unsystematic variation from the Dalradian of County Mayo where outcrops of subspherical cobbles adjoin outcrops of intensely stretched and flattened cobbles (see Table I). In the Funzie conglomerate, Flinn found that the range of strain in pebbles from any given locality often exceeded the range of average strain for all the localities studied. Oolite deformation shows surprising variation in some of Cloos' cross sections.
Thus on a regional scale, strain varies continuously, but within any small area, wide variations can be expected. It seems logical to conclude that strain may be concentrated in individual beds. It also seems logical to assume that
the number of fossils, ooids, or pebbles to be measured at any locality should be statistically determined.
The principal points emphasized in the above dis-cussion are as follows:
1) for pebbles, li usually parallels fold axes,
but for fossils and ooids,
X
= 4X2 or 1is perpendicular to fold axes.
2) maximum strain in quartzose pebbles is usually greater than maximum strain in calcareous
fossils and ooids.
3) the
2 plane is parallel with, and the'[ 3 direction is perpendicular to cleavage or
shistosity.
4) strain varies systematically on a regional scale, but often is discontinuous on a local scale.
It is important to remember that the work reviewed above is based on assumptions that are not always explicitly
stated. Volume change is given some arbitrary value, usually zero. An original shape for the strained object
must be assumed. Often the intermediate strain axes is arbi-trarily determined. Strain in the fossil, ooid, or pebble is assumed to be a minimum, but reasonably close, value for
strain in the inclosing rock. Deformation is supposed to be mathematically comparable to the deformation of a sphere
into an ellipsoid.
Presumably, the reliability of a strain measurement is inversely proportional to the number of assumptions used in making the measurement. The number and the validity of the assumptions necessary for computing strain in deformed Leptocoelia is discussed in a later section of this paper.
GEOLOGY OF THE AREA SOUTHEAST OF TARRATINE, MAINE.
The Tarratine Formation
The deformed fossils studied in this report were taken from shell beds included in the Tarratine formation exposed along the Canadian Pacific railroad, one mile southeast of Tarratine, Brassua Lake Quadrangle, Somerset County, Maine.
These outcrops are in the basal third of the type section of the Tarratine formation as defined by A. J. Boucot (in preparation). The Tarratine forms the base of the Lower Devonian Moose River group, and it is equi-valent in age to the Oriskany sandstone of New York.
Possibly because of local sediment sources, the formation as a whole is highly variable in thickness and
individual beds lens out quickly among strike. Maximum
thickness reaches 10,000 feet (A. J. Boucot, in preparation), but along the railroad southeast of Tarratine, thickness is 4200 feet (unpublished map by Joyner and B. Boucot, 1950).
The dominant part (80 to 85%) of the Tarratine
formation studied in this paper is fine to medium grain-sized, well indurated, quartzitic sandstone (subgraywacke) which crops out in brown to gray beds ranging from a centi-meter to a centi-meter in thickness. Where freshly exposed, the
sandstone crops out in massive, dark blue-gray beds which appear at first glance to be many meters thick, but which actually are composed of thinner units less than a meter in
thickness.
None of the individual beds are persistent strati-graphic units, and some are contained within the width of
a single outcrop. In this study of finite strain, slip
along the bounding surfaces of these intertonguing sandstone beds must be considered as a possible method of strain
adjustment. However, slickensides on these surfaces were not observed, except near a few minor reverse faults.
Some massive beds show faint laminations of alternating dark and less dark sandstone, usually parallel to the bedding, or at a low angle as shallow crossbedding. One massive bed near the base of the formation contained several contorted sandstone rolls about 15 centimeters in diameter.
Where the sandstone is thin bedded, it frequently
alternates with lenses of siltstone and slate. These latter rock types make up to 15 to 20% of the lower Tarratine, and only about 10% of the Tarratine formation as a whole. The slate is gray to brown on the weathered surface and dark gray
where fresh. The siltstone weathers to a rusty brown and typically has an angle between cleavage and bedding greater than the slate, but less than the sandstone.
The occurrence of even this relatively small per-centage of slate with the sandstone puts an important limi-tation on this study of finite strain, for according to a classic concept of structural geology, the slate is more
incompetent than the sandstone, and thus a disproportionately large amount of strain might be concentrated in relatively few beds of the fold. However, as the slate occurs as thin
lenses in the sandstone and not as continuous beds across the fold, this possibility may be considerably lessened.
Shell Beds
The most significant feature of Tarratine lithology for this study is the concentrations of fossil brachiopods. Seventeen separate shell concentrations were found across
the strike of the lower Tarratine formation along the Canadian Pacific right of way southeast of Tarratine, Maine. These concentrations varied from a few dozen scattered shells
sprinkled on a bedding surface of the sandstone, to distinct, lenticular shell beds up to 20 centimeters thick and several meters long.
In the shell beds, fossil brachiopods, together with discoid slate pebbles up to five centimeters long, are packed in a sandstone matrix similar to the ordinary Tarratine
sand-stone described above. After investigating several possi-bilities, the internal casts, or steinkerns, of articulated specimens of Leptocoelia flabellites contained in these shell beds were selected for measurement of strain.
Except for a few small individuals composed of clay-sized fragments, the material of the steinkerns does not differ in grain size or composition from the surrounding matrix. This similarity of steinkern and matrix lithology is necessary if the strain of the surrounding rocks is to be validly described by the strain of the inclosed steinkerns.
A study of thin sections and polished sections of
shell beds indicates that the fossil concentrations contain as much as 15 percent carbonate shell material. This high percentage of relatively ductile carbonate shell material suggests the possibility of strain concentration in these beds similar to that discussed above for slate (page 32 ).
However, the fact that fossils still exist in easily recog-nizable form indicates that strain concentration in the cal-cite, if it occurred at all, was not great. Moreover,
experimental work by Handin (personal communication, 1958) indicates that calcite and quartz deform uniformly in a calcite-cemented quartz sandstone.
The paleoecology of these shell beds is a subject dis-tinct from this study and it has been treated elsewhere
(Boucot, Brace, and DeMar, 1958; Boucot, in preparation). However, it is interesting to note that, of the 17 fossil
concentrations encountered, 8 occur just above slate or siltstone at the base of a thickbedded sandstone sequence. Four of the 17 occur in sandstone lenses isolated in slate or siltstone, and two others occur in interbedded sandstone and slate. Only three of the 17 lenses occur more than 0.5
meters above slate or siltstone in thickbedded sandstone.
All fossil beds have a sandstone matrix, and most
of them are found in, or immediately above, the fine clastic material which makes up less than 20% of the total section.
It would seem unlikely that this observed correlation
between fossil concentrations and a position immediately
above or within fine elastic material is due to chance. This correlation is probably true for the formation as a whole, for most of the fossils are from the lower Tarratine where
the percentage of fine elastic sediments is greatest.
Perhaps the fossils inhabited shallow, muddy sea floors, and were swept together, along with mud pebbles, into lenses as the environment shifted from one of mud deposition to one of sandstone deposition. The consistent position of shell beds in sandstone above slate and siltstone would at least
suggest this possibility.
Structural Geology
The slates, siltstones, and fossiliferous sandstones studied in this report are on the steep southeastern limb of the Moose River synclinorium, which is a major structural
element of the northern Appalachians, extending 60 miles in a northeast direction through northern Somerset County and adjacent parts of Piscataquis and Franklin Counties, Maine (Boucot, in preparation).
The steep southeast limb and the more gentle north-west limb of the synclinorium contain many assymmetric, doubly plunging anticlines, one of which is exposed in the outcrops southeast of Tarratine (unpublished map by Joyner and B. Boucot, 1950). The northeast limb of this anticline dips steeply toward the synclinorium axes, and the other
limb dips gently to the southeast for 300 meters, inter-rupted by several higher order folds, before returning to
the steep northwesterly dip of the synclinorium limb.
See Plate I. Stereonet plots of cleavage and bedding shown in Figure 1 on page 37 indicate that the fold does not
plunge in the area studied.
It is unlikely that the major synclinorium and its minor folds originated simultaneously; rather it is more probable that the minor folds developed after the major fold. Therefore, because the data used in this study were obtained from positions on minor (higher order) folds, the
strain recorded in deformed Leptocoelia may be the result of two distinct sets of strain directions. This might be ex-pected near location A in Plate I where the shearing sense of the minor fold may be opposite that of the major fold.
Figure 1. Poles to bedding, joints, cleavage, and faults in the Tarratine formation southeast of Tarratine, Maine. Lower hemisphere projection, north at top. a average of 11 measurements of slate
cleavage at C
b one sandstone cleavage at E
c average of eight faults at E
d average of 21 measurements of sandstone cleavage at C e average bedding at E f average of 14 measurements of slate cleavage at E g average bedding at C
0
joints at C
x joints at ELocations of C and E are shown on Plate I inside rear cover.
sandstone between 100 and 150 meters above the base of the Tarratine formation. These faults strike parallel to
bedding and fold axis and dip 450 to 600 southeast. The
maximum observable stratigraphic throw is less than four
meters on all faults with the exception of one which has a minimum stratigraphic throw of four meters.
The rocks contain cleavage whose strike approximately parallels the fold axes, but whose dip varies with position on the fold and with the lithology of the rocks. A total of 47 cleavage orientations were measured at two localities. At locality C on the vertical northwest limb of the
anti-cline, 21 measurements in sandstone and 11 in slate yield average angles between cleavage and bedding of 420 and 150 respectively. At locality E where the beds regain the normal dip of the synclinorium limb, 14 measurements in slate yield an average angle of 150 between cleavage and bedding. At E cleavage in sandstone is rare, and the only two measurements of the angle between cleavage and bedding were 420 and 48*.
Figure 1 on page 37shows poles to cleavage and bedding at localities C and E. Between C and E, cleavage fans slightly across the crests of minor folds.
The constant angle between cleavage and bedding in slate, and probably in sandstone, at C where beds dip verti-cally and at E where beds dip 650 to 750 suggests that the cleavage may antedate the development of minor folds on the limb of the synclinorium.
In Figure
1,
the poles to sandstone cleavage and the eight minor thrust faults fall in the same region, indi-cating that the f-aults might have developed by shearing along pre-existing cleavage surfaces.There are at least two, and possibly three sets of joints, one of which is perpendicular to the fold axes and the other (or others) which parallels the fold axes, but they were not extensively studied. See Figure 1.
All rocks examined had undergone low-grade
metamor-phism. No igneous rocks crop out in the immediate vicinity of the fossil localities studied.
Tectonic History
Following Taconic diastrophism, thick sequences of Silurian and early Devonian rocks were deposited in north-western Maine. The rapid changes in thickness and
litho-logy of these sediments within short distances suggest their deposition in a tectonically mobile environment.
(A. J. Boucot, in preparation).
Subsequent to their deposition, the Silurian and
early Devonian rocks were strongly deformed by Acadian dia-strophism during middle Devonian time. No record remains of the post-Acadian, pre-Pleistocene history of the Moose River synclinorium, and there is no evidence that late Paleozoic deformation affected this area.
For lack of evidence to the contrary, the strain studied in this report is assumed to be the product of one period of deformation (Acadian).
METHOD
Leptocoelia Flabellites
Description. To experimentally measure strain re-sulting from a given state of stress, an engineer can tape strain gages on the material to be tested, and then measure the change in length after the stress has been
applied. For the geologist the problem is more difficult. The stress state which produced a given strain it unknown, and geologic strain gages are scarce and uncertain.
In this study of strain distribution in folded rocks, the steinkern (internal cast) of the brachiopod Leptocoelia flabellites is the geologic strain gage. The original dimensions of the deformed Leptocoelia are in-dicated by collections from undeformed regions.
Information for the following description of
Leptocoelia was supplied by A. J. Boucot. It is not in-tended as a paleontologic description but as a precise definition of the parameters chosen for measurement, and an explanation of the reasons for the choice. The necessary morphologic terminology can best be understood by referring to Figure 2.
Over a century ago, Conrad (1841) and Hall (1859) described Leptocoelia flabellites from the Lower Devonian
of New York State.
Figure 2. Leptocoelia flabellites steinkern terminology. L', W', T' are deformed counterparts of length L, width W, and thickness T in undeformed steinkerns.
F and (P are angular measures of strain. Other features mentioned in the text include impressions of the
sulcus
(S),
fold
(F),
costae (C),
cardinal process (CP), median septum
(MS), hinge line (HL), and diductor muscle scar (DMS), as well as the
approximate position of the hinge axis (HA).
Posterior View Anterior View
Brochiol View Pedicle View t/2
Side View
brachial valves, as shown in Figure 2.
In life, the larger, convex pediole valve was joined to the smaller, flat brachial valve by muscles internally attached to the posterior end of each valve on either side of a fulcrum-like structure. By contracting or relaxing
the proper muscles, the valves rotated open or closed about a line in space, the hinge axis (Rudwick, 1959, p. 18). The hinge axis is approximately parallel to the hinge line which is the edge of a shelf protruding into the posterior
of the brachiopod interior.
The area of attachment of a particular set of muscles, the diductors, are preserved as two small symmetric muscle scars on the pedicle valve, and as a protuberance on the brachial valve known as the cardinal process. This cardinal process passes anteriorly into the median septum, a small knife-like ridge usually coincident with the trace of the symmetry plane on the brachial valve.
The anterior and lateral edges of the steinkern are notched with mated saw-tooth crenulations caused by radial ribs, called costae, which ornament the brachial and pedicle valves. Where the symmetry plane crosses the anterior
margin, it bisects a large crenulation which is expressed by a pronounced trough, or sulcus, on the pedicle valve and a corresponding fold, less pronounced, on the brachial valve.
After death, complete separation of pedicle from
brachial valve is hindered by an internal, interlocking, tooth and socket mechanism, but the decay of the muscles permits the anterior margin to gape slightly and sediment sifts in to fill the shell interior. The sediment which accumulates inside the valves receives the detailed
impression of all interior features including the muscle scars, cardinal process, median septum, and costae. This interior cast is the steinkern, the geologic strain gage
used in this study.
Parameters. Strain is the deformation of shape. To measure strain in deformed Leptocoelia, certain dimensions
and angles must be compared with their pre-deformation value.
In studying strain, as will be shown below, it is
useful to measure three distances which were mutually per-pendicular before deformation. The length, width, and
thickness of Leptocoelia steinkerns are three such dimensions. Length, denoted as L, is defined as the distance along that line formed by the intersection of the symmetry plane with the plane of the brachial valve, and included between perpendicular projections to this line of the anterior and posterior extremities of the steinkern. This distance is slightly shorter than the straight line distance between anterior and posterior extremities of the steinkern. See Figure 2.
Width, denoted as W, is defined as the distance be-tween lateral edges of the steinkern in a direction
parallel to the hinge axis and bisecting the length L. For steinkerns with one lateral edge damaged, it is assumed that the width W is equal to twice the distance between the remaining lateral edge and the median septum impression, measured parallel to the hinge axis as in undamaged speci-mens. See Figure 2.
The direction of W in deformed steinkerns must be determined with care. It is defined as parallel to the
hinge axis, because the hinge axis is normal to the symmetry plane in undeformed specimens. Although the direction of the hinge axis is easily found in undeformed specimens, for deformed Leptocoelia it must be determined with less accu-racy from the approximately parallel direction of the hinge line impression on the brachial posterior of the steinkern. Possible errors introduced by this approximation will be evaluated in a later section of this paper.
Thickness, denoted as T, is defined for undeformed steinkerns as the maximum distance between the brachial and pedicle sides of the steinkern measured in a direction per-pendicular to the plane of the brachial valve. For deformed fossils, this distance must be multiplied by the secant of an angle
P
defined below and illustrated in Figure 2.To fully describe strain, angle changes as well as changes in length must be measured. In general, the most
convenient angular changes are related to changes from the perpendicular of three lines which were mutually perpendi-cular before deformation, such as L, W, and T in this study.
The angle P is defined as the angle between the line formed by the intersection of the symmetry plane with the TW plane, and the normal to the plane of the brachial valve. It is measured by viewing the posterior of the steinkern normal to the TW plane and noting the angle between the brachial plane normal and a line passing through the median septum and the pedicle muscle scar as shown in Figure 2.
The angle (P, illustrated in Figure 2, is defined as the angle in the LW plane between the median septum and the normal to W.
Both
f
and 9 are zero for undeformed steinkerns and, in special cases, for deformed specimens also.P
and <p adequately define the angular change in two perpendicular planes, the TW and LW planes, but the morphology ofLeptocoelia steinkerns does not permit accurate recognition of angular changes in the third perpendicular plane, the LT plane. Thus T, whose angular change is undefined in the LT plane, will always be too short by an amount proportional to
(sec x-1) where x is the unmeasurable angle in the LT plane. However, because P and x should be the same order of magnitude, and because JP is usually less than 100, this factor is effectively zero (sec 10*)-l = 1.015 - 1 V 0
Growth curves. To measure strain, geometry before and after deformation must be known. For Leptocoelia
steinkerns, five geometrical parameters L, W, T, P, and ) have been defined, but the pre-deformation values are known only for P and
9
.(
= )= 0 by definition for theunstrained state.)
Data for determining the ratios of any two of the parameters L, W, and T before deformation were obtained from collections of Leptocoelia flabellites from the Camden chert of Tennessee, from the Highland Mills member of the Esopus formation (Boucot, in preparation) at Highland Mills, N.Y., and from the Gaspe sandstone, eastern Gaspe, Quebec Province.
The Camden steinkerns were collected 60 years ago for the United States National Museum by Charles Schuchert from a 60 foot exposure of the Camden chert near Camden, Benton County, Tennessee (Saffard and Schuchert, 1899). At this locality, the formation is 275 feet thick, consisting mostly of thin-bedded, white to yellow chert containing abundant fossils whose details are preserved in unusual perfection (Dunbar, 1918, p. 751). Geologic structures are absent and the beds are nearly flat lying.
The slightly silicified steinkerns from the Highland Mills member of the Esopus formation were collected near
the railroad station at Highland Mills, Orange County, New York. Here, faulting and some folding have deformed
the beds so that they now dip 60 degrees.
The Gaspe steinkerns were collected a half century ago by Shaler from the Gaspe sandstone somewhere in
eastern Gaspe. The geology at the collecting locality is unknown to the writer, but regionally the Gaspe sandstone occupies the center of a broad syncline traversed by local faults and folds which occasionally impart vertical dips to the usually slightly inclined strata (McGerrigle, 1950).
L and T of all three collections are plotted as
functions of W in Figures 3 and 4. The steinkerns measured
(18 from the Camden chert, 14 from the Highland Mills
mem-ber, and 40 from the Gaspe sandstone) represent the least damaged, best preserved specimens from the collections available.
Ratios obtained from the growth curves shown in
Figures 3 and 4 are used in this study making the following assumptions: 1) Leptocoelia flabellites exhibited similar growth patterns irrespective of the time or place in which they grew, 2) these steinkerns have not been significantly deformed by diastrophism, 3) the compositional differences of the steinkerns do not significantly affect the final
shape by variations in their reaction to physical or chemical diagenesis, 4) steinkerns from the Camden, Highland Mills, and Gaspe collections are individuals of the same species contained in rocks near the Tarratine railroad cut.
Figure 3. L vs. W for Camden, Highland Mills, and Gaspe Leptocoelia steinkerns. Straight line visually estimated from
Camden steinkerns only, and only for size range of Tarratine steinkerns.
* Highland Mills . Gaspe *e x 10 91 B 9 10 11 12 13 14 15 16 17 18 19 20 21 22 23 Wmm. 16 15 14 13 12 II a 0 6
Figure 4. T vs. W for Camden, Highland Mills, and Gaspe Leptocoelia steinkerns. Straight line visually estimated from
Camden steinkerns only.
o Highland Mills * Gaspe 00x e xx x x x x x x x x 0. * 0 0 0 0 8 9 0 1 1 12 13 14 15 16 17 18 19 20 21 22 23 W
It
from which the growth curves were constructed are widely separated geographically and temporally. The Tarratine
Leptocoelia of Oriskany age are one fauni-zone older than the Esopus fossils from Highland Mills and the Gaspe, and three fauni-zones older than the Onondaga fossils of Camden
(Boucot, personal communication, 1959).
The second assumption, that there has been no signi-ficant deformation due to diastrophism, is doubtfully valid for the Highland Mills fossils which were taken from steeply dipping rocks, and the Gaspe specimen whose exact, original geologic environment is unknown to the writer. For this reason, the straight lines in Figures 3 and 4 are based only on well preserved Camden steinkerns collected from the flat-lying rocks of western Tennessee.
Assumption three, equal reaction to diagenesis, is necessary because the Camden steinkerns are chert, the Highland Mills steinkerns are silicified medium sand, the Gaspe steinkerns are fine to medium sand, and the Tarratine
steinkern are fine sand. Secondary growths of drusy quartz
were noticed on Camden steinkerns.
Within the size range of Tarratine steinkerns, L and T are linear functions of W, but the largest steinkerns from the Gaspe (see Figure 3) show that the curve probably
changes slope for large values of W, and the non-zero inter-cept of the straight lines (see equations on Figures 3 and 4) indicates that the slope of the curve must also change for
small values of W.
The non-zero intercepts of the linear relations shown in Figures 3 and 4 make exact determination of even the parameter ratios uncertain. For example, the slope of the L versus W line in Figure 3 is .78 anywhere along the line, but L/W for any particular point on this line will vary exponentially along the straight line, approaching the value of the slope, .78, in the limit as the size of the steinkerns becomes impossibly large.
However, the change of parameter ratios is very small within the size range of Tarratine steinkerns. L/W is
probably between .855 and .900 and T/W is probably between
.315 and .330 for all Tarratine steinkerns used in this study.
Because this variation is small compared to the variation imparted by strain, the growth curves in Figure 4 will be used to determine the pre-deformation ratio of any two of the strain parameters, L, W, and T, in the Tarratine stein-kerns. Notice that without further assumptions, the growth curves determine only deformation ratios, and not pre-deformation magnitudes of L, W, and T.
How these growth curves may be made to yield more information on the original shape of the steinkerns will be shown below in the section on strain.
Sample Collection and Preparation
Collection. Samples containing the deformed
Leptocoelia steinkerns studied in this report were
collected from the fossiliferous outcrops near Tarratine, Maine in the following manner.
Each fossiliferous outcrop was located on the fifty foot to the inch outcrop map previously prepared by Joyner and B. Boucot (1950). The exact location of each sample collected, and its position with respect to neighboring samples was established by a tape and compass survey.
On a suitable plane surface of the sample, an identification number, a horizontal line, and a line in the dip direction of the surface were marked with an acid-resisting marking pencil. The type of surface marked
(cleavage, bedding, or joint), the position of the marked surface with respect to the sample (top surface or under surface), and the strike and dip of the marked surface were recorded.
Usually, one or more photographs of the outcrop were taken with a Polaroid Land camera, and the photograph
immediately labeled with the sample number.
The sample was then freed from the outcrop with the aid of sledges, chisels, and a crow bar, and wrapped in newspaper. In anticipation of further research, many more
A 300 meter section of the lower Tarratine
sand-stone was described and measured. Orientation of bedding, cleavage, joints, and faults were recorded, and repre-sentative samples of the unfossiliferous beds were collected.
Preparation. In the laboratory, the oriented specimens were unwrapped, catalogued, and stored until needed. In preparing the steinkerns for measurement, the
sample was first soaked in dilute hydrochloric acid for
8 hours to dissolve the calcareous shell material, then
washed in running water for 8 to 12 hours to prevent deposition of iron salts in the rock, and then dried for at least twelve hours. Figure 5 shows the surface appear-ance of typical samples before and after treatment with acid.
Suitable steinkerns on the oriented surface of
dried samples were exposed, but not extracted, with a vibra tool in preparation for the position measurements.
The following sections describe measurement of the position of a steinkern with reference to the oriented
surface of the sample, and measurement of the magnitudes of L', W', T',
P
, and 9P in an extracted steinkern. The goniometer used for position measurements, the strain gage used for dimension measurements, and the device used for measuring P and C are all described and their use illustrated.Figure 5. Top: typical sample after acid treatment, showing pedicle side of several
steinkerns.
Lower left: typical sample before acid treatment.
Lower right: unpolished section of the untreated sample.
2-~
4
Position Data
Because part of the desired information is the orientation of principal strains in the structure from which the steinkerns were taken, it is necessary to keep
track of position during sampling and extracting. This is done most conveniently with the aid of three coordinate systems.
The first of these coordinate systems is the geo-graphic system established from the outcrop map, and tape and compass measurements. In this system, the locality of a fossiliferous sample is a point, and this point becomes
the origin of a new system, the right-handed sample
coordinates, in which the x axis is the horizontal strike line, the positive y axis is the dip line, and the positive
z axis is the outward normal to the marked surface of the sample. A point in the sample coordinates becomes the origin for the third coordinate system, the steinkern
coordinates, in which L', W', and T' form a right-handed,
usually non-orthogonal system where positive L' extends toward the anterior of the steinkern.
The orientation of principal strains is first found in the steinkern coordinate system by use of Mohr diagrams described below. By referring the steinkern coordinates back through the sample coordinates to the geographic
system, the orientation of principal strains is determined for a particular point in the deformed rocks southeast of
Tarratine. Because the geographic position is known from the outcrop map and tape and compass survey, and sample orientation is known from dip and strike measurements, this section deals only with determining the orientation of the steinkern coordinates L', W', T'.
Instrument description. To measure the position of L, W', and T', the large goniometer in Figure 6 was con-structed. By the proper combination of translation and rotation, this goniometer determines the direction of any line in a sample less than 9 inches in maximum diameter.
The horizontal translating apparatus consists of an east-west track on which is mounted a north-south track.
By motion in these perpendicular directions, any point in
the sample can be brought to the center of the goniometer.
A jack mounted on the north-south track provides vertical
translation which brings the steinkern into the plane of the outer circle.
The outer circle, shown in Figure 6, is part of the rotational mechanism of the goniometer which also includes the semicircle, the head, and a vertical axis about which the jack can rotate. The outer circle is a graduated circle free to rotate about the vertical axis of the goniometer. Fixed to the outer circle and perpendicular to it is the
semicircle on which the pointer and graduated dial of the head are located. The pointer in the head is free to rotate