HAL Id: hal-01698576
https://hal-mines-albi.archives-ouvertes.fr/hal-01698576
Submitted on 7 Nov 2018HAL is a multi-disciplinary open access
archive for the deposit and dissemination of sci-entific research documents, whether they are pub-lished or not. The documents may come from teaching and research institutions in France or abroad, or from public or private research centers.
L’archive ouverte pluridisciplinaire HAL, est destinée au dépôt et à la diffusion de documents scientifiques de niveau recherche, publiés ou non, émanant des établissements d’enseignement et de recherche français ou étrangers, des laboratoires publics ou privés.
Determination of porosity from shrinkage curves during
sintering of granular materials
Souhir Mankai, Jamel Madiouli, Jalila Sghaier, Didier Lecomte
To cite this version:
Souhir Mankai, Jamel Madiouli, Jalila Sghaier, Didier Lecomte. Determination of porosity from shrinkage curves during sintering of granular materials. Drying Technology, Taylor & Francis, 2018, 36 (5), p.557-566. �10.1080/07373937.2017.1348358�. �hal-01698576�
Determination of porosity from shrinkage curves during sintering of
granular materials
Souhir Mankaia, Jamel Madioulia,b, Jalila Sghaiera, and Didier Lecomtec,d
aDepartment of Energy Engineering, National Engineering School of Monastir, University of Monastir, Monastir, Tunisia; bDepartment of
Mechanical Engineering, Faculty of engineering, King Khalid University, Abha, KSA; cUniversity of Toulouse Midi-Pyrénées, Mines Albi, UMR
CNRS 5302, RAPSODEE Center, Jarlard Campus, F-81013 Albi CT Cedex 09, France; dInstitute of Technology of Cambodia, Phnom Penh,
Cambodia
ABSTRACT
This paper investigates the implementation of an analytical model to determine the porosity of a granular material during reactive and nonreactive sintering. A graphical interpretation of this model is proposed to calculate the porosity by comparing the experimental shrinkage curve with the ideal one. For the nonreactive sintering, some examples have been taken from the literature to illustrate the application of this method for two granular materials (alumina and zircon). In the case of reactive sintering, we have used our experiments to study the sintering behavior of magnesium hydroxide. The shrinkage curve was determined by dilatometer and the porosity was measured by helium pycnometer. The comparison revealed that the porosity calculated from the model is fully consistent with the porosity measurements in the both cases.
KEYWORDS
Graphical method; model; porosity; shrinkage; sintering
Introduction
Sintering can be described as the change of a powder compact in a coherent material under the action of heat. This industrial process is used in several areas such as biomedical material,[1] fabrication of nuclear
combustible,[2] catalyst in sensors,[3] etc.). It is considered
as a very complex phenomenon because the fundamental mechanisms of sintering are still a matter of controversy. The sintering process usually causes volume and surface change. In fact, atomic diffusion results in joining of the particles (formation of necks between grains,[4] neck growth, rearrangement, grain growth
with shrinkage, and deformation) and reduction of the porosity which is the main objective of sintering.
The control of these parameters (deformation, shrinkage, and porosity) is essential, to avoid post- treatment, to optimize, to better understand the sintering process, and therefore to improve the quality of the sintered components.
In many cases, there are chemical reactions of two or more components during sintering[5–9]; in this case,
the sintering allows the formation of a new chemical compound and its shrinkage.
For this, various techniques have emerged depending on the way of heating the powder. These techniques include natural sintering also called conventional
sintering (using an oven as a heating source)[7,9,10] and
nonconventional sintering such as microwave sintering (irradiation by a microwave field),[9,11] sintering under load
(compaction hot uniaxial or hot isostatic pressing),[12,13]
flash sintering also called SPS (applying a uniaxial pressure and an electric current),[14–16] and laser sintering (scan a
powder bed by a laser beam).[17,18]
In the literature, many works have been presented to determine experimental parameters during sintering.[19–21] Many products were studied like
alumina,[22,23] zircon,[22] copper oxide,[24,25]
ceramics,[19–21,26–28] titanium,[29] and alloys.[30] Parallelly,
numerous models have been developed taking into account the different mechanisms induced by sintering (particle size distribution effects, surface diffusion, particle coalescence, phase transformation, evaporation/ condensation, etc.). These models are ranging from macro-scopic (phenomenological) models to mesomacro-scopic and microscopic (physical) ones. The microscopic model, also called two spheres model, is the first analysis of sintering and the simplest model.[31–33] The micromechanical model
can handle agglomeration, anisotropy, and particle grain size distribution, but it cannot directly model the effect of impurities and doping. Their influence on the microstructural evolution is reflected in the diffusion coefficient and interfacial energies.
none defined
CONTACT Souhir Mankai souhirmankai@yahoo.fr Department of Energy Engineering, National Engineering School of Monastir, University of Monastir, Monastir 5019, Tunisia.
The mesoscopic models are based on simple geome-tries (like two or multisphere model). These models involve the mass transfer mechanisms during sintering and they are used to describe the evolution of microstruc-ture during sintering,[34] which determine the thermal,
mechanical, and electrical properties at macroscopic scale. The macroscopic models have been developed to simulate the shrinkage and the deformation during the sintering process. With these models, the tempera-ture, mechanical, and densification properties of the sintered compacts can be described by developing a constitutive law based on the continuum mechanics of porous media.[35–37]
In the literature, some numerical models[8,38–43]
describing the shrinkage and the porosity change during sintering have been validated by experiments. Ou et al.[38] studied the sintering behavior of micro-
bimaterial components during a powder injection molding with dilatometry experiments and gravitational beam bending. As a complement to their experimental study, a thermoelastoviscoplastic model was developed and simulated by finite element method. The simula-tions were based on constitutive equasimula-tions identified from specific experiments performed for each blend at different sintering heating rates and loadings. Maca et al.[39] developed a new automatic procedure to
recalculate dilatometric shrinkage data to plot density as a function of time and temperature. Maizza et al.[40,41]
have proposed a numerical/experimental methodology. Their experimental part is based on experiments of SPS sintering on pure and ultrafine tungsten carbide powder. The developed model is a thermoelectric model taking into account the shrinkage phenomenon. A comparison between shrinkage curves and the numerical and experimental temperatures was used to test the model developed and to estimate all the unknown variables (density, heat capacity, thermal dif-fusivity). Li et al.[42] have determined experimentally
the sintering behavior of TiO2 monomodal porous
com-pacts containing intergranular pores and bimodal porous scaffolds prepared by freeze casting, containing small intergranular pores and large interlamellar pores, then they comared the obtained results with those examined by finite element analysis. Wei et al.[43]
have used a model known as power-law creep of powder to describe the densification mechanism of zirconium carbide (ZrC) powder under SPS. The numerical
solution of this model is compared to the obtained experimental data in the inverse regression process to evaluate the power-law creep coefficients of the ZrC
powder.
Modeling can help estimate and better optimize the process parameters. In this context, the aim of the
present work is to develop a general model based on a graphical interpretation to determine the porosity from the experimental and ideal shrinkage curves during sintering. The graphical interpretation was used in our previous work[44] to determine porosity during drying.
In the literature, several works, allowing to calculate the porosity from the shrinkage during drying,[45–49]
have been presented.
During sintering, the proposed analytical models in the literature[32,33] can only treat complex diffusion
and transport mechanisms. The prediction of the porosity from shrinkage has been processed numerically.[38,43]
Model formulation
A granular material, composed of solid matrix and air, with an initial volume V0, initial mass m0, initial bulk
density q0, and initial porosity e0, is sintered under
controlled conditions.
At time instant t, the volume is V, the density is ρ, the mass is m, and the porosity is ε. We suppose that volumes of solid and air phases are additive and the mass of air phase is negligible with respect to the mass of solid. We will treat two cases of sintering: the reactive and the nonreactive sintering.
Reactive sintering
We consider that a solid S1, undergoing a thermal
process, is reacted to give a solid S2 and gas according
to the following chemical reaction: aS1 ! bS2á cg
where a, b, and c are the stoichiometric coefficients. Initially (at t à 0), the number of moles of the solid S1 is n0 and the mass of the solid m0 is given by the
following expression:
m0 à n0M0 Ö1Ü
where M0 is the initial molar mass.
During the thermal process, the chemical reaction occurs, the number of moles of the reactant S1 decreases
to n0 n. Considering the material balance of the
system, the number of moles of S1 is transformed into
several moles b
an of the solid S2 and c
an of gas.
where n is the number of moles decreasing from the solid S1 at time instant t.
The masses ms1 and ms1 of the solids S1 and S2 are,
respectively, given by the following equations:
ms2àbanMs2 Ö3Ü
where Ms1 and Ms2 are, respectively, the molar mass of
the solid S1 and S2.
The bulk density at the beginning of the chemical reaction is expressed as:
q0àmV0 0 à ms1 V0 à ms1 Vs1 Vs1 V0 Ö4Ü q0 àmVs1 s1 V0 Va Ö Ü V0 Ö5Ü Thus: q0 à 1Ö e0Üqs1 Ö6Ü
where qs1 is the solid density of the solid S1 and e0 is the
initial bulk porosity.
During the heating cycle, the bulk density is given by: q àmV àmVs1á ms2 s1á Vs2 Vs1á Vs2 V Ö7Ü q àÖmms1á ms2Ü qs2 s1qs2á ms2qs1 Ö1 eÜqs1 Ö8Ü
After development, we obtain the following expression: q 1 ms2 m qs2 qs1 qs2 ✓ ◆ ✓ ◆ à 1Ö eÜqs1 Ö9Ü
where qs2 is the solid density of the solid S2 and ε is the
bulk porosity. Knowing that: q q0 à m m0 V0 V Ö10Ü
And introducing the parameter Δ defined as d àqs2 qs1
qs2 , Eqs. (6), (9) and (10) can be combined to yield:
1 e Ö Ü 1 e0 Ö Ü V V0 à K á 1 á KÖ Ü m m0 Ö11Ü With K àbMbM2d 2 aM1 Ö12Ü
where Ms1 and Ms2 are, respectively, the molar mass of
the solids S1 and S2.
The parameters governing the shrinkage are the solid density, molar mass of the two solids (reactant and product), and the stoichiometric coefficients of the chemical reaction.
From Eq. (11), we deduce that the shrinkage Ö1 eÜ 1 e0
Ö ÜVV0 varies linearly with the reduced mass loss m
m0. Two basic cases can be examined:
Case (a): Ideal shrinkage with initial porosity; e à 0, e06à 0
In this case, the ideal shrinkage curve y can be written from the Eq. (11) in the form:
y àVV 0 à 1Ö e0Ü K á 1 á KÖ Ü m m0 ✓ ◆ Ö13Ü Case (b): The general case: Nonideal shrinkage with initial porosity; ε ≠ 0, e06à 0
In general case, Eq. (11) is reduced to: 1 e
Ö Üz à 1Ö e0Ü K á 1 á KÖ Ümm 0
✓ ◆
Ö14Ü where z is a dimensionless parameter representing the experimental shrinkage curve for a product.
The porosity can be easily deduced from Eqs. (13) and (14) and given by:
e àz yz Ö15Ü
A graphical interpretation of Eq. (15) is shown in Fig. 1a where the porosity is equal to the ratio of the
Figure 1. Determination of porosity using visual interpretation
of the shrinkage curves for: (a) nonreactive sintering and (b) reactive sintering.
segment AB to segment AC.
e àACAB Ö16Ü
Nonreactive sintering
In the case where sintering is not preceded by a chemi-cal reaction, the shrinkage will be deduced from Eq. (11) with m à m0 and K à 0, thus leading to the following
equation:
1 e 1 e0à
V0
V Ö17Ü
From Eq. (13), the ideal shrinkage coefficient becomes a constant:
y à 1 e0 Ö18Ü
Two properties measured at the beginning and at the end of the experiment (initial porosity e0 and initial
volume V0) are necessary for the full description of
the model.
The porosity change can easily be deduced from Eq. (15).
As the reactive case, the graphical interpretation can be used to determine the porosity (Fig. 1b).
The porosity thus depends on the experimental values of the shrinkage and on set of properties (initial bulk density and solid density).
Materials and methods
High-purity magnesium hydroxide powder (Sigma- Aldrich, 95%) with an average granule size of 2.86 µm (the particle size dimension of the powder was measured by Microtrac S3500) was used in all experiments.
The powder was uniaxially pressed at 10 1 Mpa, for
240 s, into 6 mm diameter cylindrical porous compacts and various thickness. The porosity in the green state (initial porosity), e0⇡ 71%, was calculated from the
geometric volume and the true volume, considering the true density measured by the helium pycnometer for Mg(OH)2.
The green compact was sintered at various tempera-tures (from 400 to 1,350°C) using a Nabertherm furnace. The heating and cooling rates were, respect-ively, 10 and 30°C min 1 with a holding time of
60 min at 400°C.
At 400°C (the decomposition temperature), the samples before and after sintering were weighted and examined by structural analysis with X-ray diffraction (XRD) in a X’PERT Pro MPD PANALYTICAL
diffractometer, using a CuKα radiation (k à 1.540060 Å). The crystallite size was determined by XRD through the full width at half-maximum (FWHM) of the (2h) Bragg peak using the formula:
s à dk= G cos hÖ Ü Ö19Ü where s is the FWHM, k is the X-ray wavelength, G is the crystallite size, h is the diffraction angle, and d is the Scherrer constant to account for the particle shape (close to unity, normally 0.9).
The crystalline phases were identified by reference to the International Center for Diffraction Data.
Differential thermal analysis and thermogravimetry were performed using 28.7 mg of powder with a DTA- TG SETARAM SETSYS Evolution-1750. Linear shrinkage was determined by dilatometry (SETARAM SETSYS Evolution-1750) using the same thermal cycle as for DTA.
Apparent and true densities were measured using helium pycnometer (Accu Pyc II 1340, Micromeritics), and the bulk material density of the body was calculated from the weight and geometrical dimensions.
In this study, open, closed, and total porosities are calculated according to the following formulas:
eclosedà 1 qqapp
true Ö20Ü
e à 1 qqbulk
true Ö21Ü
eopenà e eclosed Ö22Ü
To track the porosity change, the microstructures of the sintered specimens were observed by scanning electron microscopy (SEM) (JEOL JSM-5400). The pre-sintered and pre-sintered samples were fractured and gold sputtered before examination.
Results and discussion
To calculate porosity, we applied the shrinkage model for two nonreactive materials (alumina and zircon) sin-tered under free sintering. The data were collected from Falamaki et al.[22] (Table 1). For these materials, two
properties were listed: the bulk initial density and the solid density (Table 2).
The experimental works of Falamaki et al.[22] were
used for the application of the model for alumina and zircon to calculate porosity changes during sintering.
Fig. 2 shows the experimental data from Falamaki et al.[22] with the experimental values of solid density
and initial bulk density; an initial porosity ε0 was
calcu-lated (Table 2) allowing the calculation of the ideal shrinkage.
Equation (15) allows determining porosity during the whole sintering process.
The calculated porosity curve (Figs. 3 and 4) shows the same form as experimental porosity of Falamaki et al.[22] for both cases (alumina and zircon products).
We observe that at the initial stage of sintering (for small values of the temperature T < 1,300°C), the calcu-lated porosity obtained from the proposed model is quite different compared to the measured porosity. The difference may be due to the microstructure of the sample and measurement errors. In fact, in general, in the initial stages of sintering, pore growth may occur by different mechanisms such as particle coalescence, particle size distribution effects, surface diffusion. The result is some kind of particle rearrangement in the initial step of sintering. Some groups of relatively small
highly compact aggregates shrink on themselves by particle rearrangement with neck growth, resulting in the growth of irregular voids caused by the separation between the shrinking groups.
During this first stage, shrinkage is minimal and porosity deceases only slightly.
A transition zone (at higher sintering temperatures beginning from T à 1,350°C) may be observed in the porosity and in the experimental shrinkage versus temperature curves for alumina and zircon as well.
Within this transition zone, the densification process undergoes acceleration and shrinkage and porosity becomes significant.
The model was tested for a reactive product (the magnesium hydroxide). The XRD patterns of the initial and free sintered powder are given in Fig. 5. The XRD diffraction pattern of the initial powder reveals only peaks of Mg(OH)2 called brucite. At 400°C, the Mg
(OH)2 was decomposed; the phase composition of the
sample sintered at 400°C consists of magnesium oxide (called periclase): the following thermal reaction which takes place is:
Mg OHÖ Ü2!DTMgO á H2O
Table 1. Sintering conditions and material properties from the reference used in the application of present porosity estimation
model (Eq. (17)).
Product
Techniques and conditions of sintering
Measured
properties Measured apparatus Reference Techniques (heating program) Conditions
Alumina - Uniaxial pressing (forming pressure 31.2 MPa) - No binder addition
- Heating up to 1,000°C with a
heating rate of 20°C min 1 - Porosity - ASTM C 373-88 Falamaki et al. [22]
Zircon - Uniaxial pressing (forming pressure 31.2 MPa) - Addition of 4 wt% PVA -Firing in air atmosphere
- Heating up to the sintering temperature with a heating rate of 5°C min 1
- 1 h soaking time
- Shrinkage -Dilatometer Setaram 16/18
Table 2. Properties of the studied granular materials used in
the application of present model.
Product density (kg mInitial bulk 3) Solid density (kg m 3) Initial calculated porosity (%)
Alumina 2,300 4,000 0.425 Zircon 2,400 4,800 0.5 Magnesium hydroxide 795.403 2,360 0.662 Magnesium oxide – 3,580 –
Figure 2. Free nonreactive sintering of alumina and zircon:
ideal shrinkage (calculated using Eq. (18)) and experimental shrinkage curves (Falamaki et al.[22]).
Figure 3. Free nonreactive sintering: comparison of calculated
porosity (■) from Eq. (15) by referring to Table 2 and experi-mental porosity of alumina ( : Falamaki et al.[22]).
The study of thermal behavior of the initial and sintered powder has proved to be a powerful way for under-standing physical phenomena during sintering. Dilatometric analysis, differential and gravimetric analysis were used.
A feature that is interpreted from Fig. 6 is the bulk shrinkage coefficient of compacts. The bulk shrinkage coefficient is related to the linear shrinkage L L0
L0
⇣ ⌘
measured by the dilatometer by the relation: V V0 à 1 á L L0 L0 ✓ ◆3 Ö23Ü Dilatometric analysis was performed at 1,400°C. If shrinkage behavior is evaluated considering microstruc-tural evaluation, three main stages are observed in the system.
Figure 4. Free nonreactive sintering: comparison of calculated
porosity (■) from Eq. (15) by referring to Table 2 and experi-mental porosity of zircon ( : Falamaki et al.[22]).
Figure 5. XRD spectrums of Mg(OH)2 sintered at various
tem-peratures: (a) 30 and (b) 400°C. Note: XRD, X-ray diffraction.
Figure 6. Experimental (b) and ideal shrinkage (a) calculated
using Eq. (13) as a function of temperature for free reactive sintering (Mg(OH)2).
Figure 7. DTA and TGA thermograms of Mg(OH)2.
Figure 8. Free reactive sintering: comparison of calculated
porosity (▬) using Eq. (15) and referring to Table 2 and experi-mental porosity ( ) of magnesium hydroxide.
In the first stage, volumetric expansion is dominant and the grains grow larger (exaggerated grain growth). In the second stage, the microstructural evaluation is more complicated as sintering shrinkage is more effec-tive because thermal activation is enough to join parti-cles together and develop the neck formation between them. When the transformation is completed (third stage), shrinkage is dominant because sintering takes place for densification.
The decomposition path of Mg(OH)2 was studied by
DTA/TGA analysis (Fig. 7). Two endothermic peaks were observed. The small endothermic peak below 250°C with a weight loss of 1.4% is related to the dehydration process. The second peak (at 400°C) which
corresponds to the decomposition reaction was very strong with a weight loss of 10.71%.
The data in Fig. 8 show that the measured porosity is in concordance with that obtained by the proposed method which confirms the validity of the model in case of reactive sintering.
The SEM images of Mg(OH)2 sintered at various
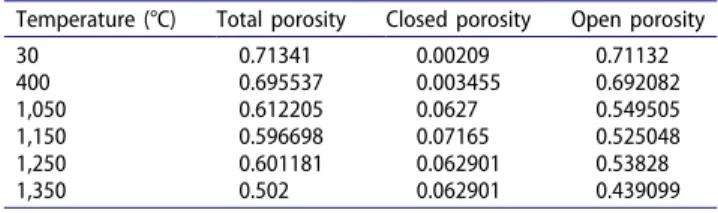
temperatures (30, 400, 1,050, 1,150, 1,250, 1,350°C) are reported in Fig. 9. The surface fractures reveal an apparent change in the sample microstructure. At 30°C, the sample presents an important intergranular porosity which disappears partially when the tempera-ture increases (Fig. 9). We can also notice the absence of intragranular porosity from the beginning, so it can
Figure 9. SEM micrographs of magnesium hydroxide samples sintered at different temperatures: (a) 30, (b) 400, (c) 1,050, (d) 1,150,
be assumed that powder porosity is opened which was confirmed by the values of porosity measured by pycnometry (Table 3).
Microstructure of the Mg(OH)2 sintered at 400°C
(decomposition reaction) was characterized by the for-mation of clusters of particles; this agglomeration becomes more important at 1,350°C and, at this tem-perature, the density increases.
Thus, the results due to the microphotography are consistent with the values of intragranular, intergranu-lar, and total porosities obtained by the model and by the experimental measurements.
Conclusion
In the frame of this study, an analytical model for deter-mining the porosity during reactive and nonreactive sintering using a limited number of parameters ident-ified with specific experiments (shrinkage, initial porosity, and weight loss) was proposed. This model, based on a graphical interpretation of the shrinkage curves to determine the variation of porosity, was applied to experimental data from the literature for the nonreactive sintering and ad hoc experiments for the reactive sintering.
For the case of nonreactive sintering, a transition zone is observed at the initial stage of sintering. After-ward, the densification process dominates and at 1,500°C, a quite dense product is obtained. A difference was observed between the calculated and experimental porosities. This difference is due to the microstructure sample and the error measurements.
For the reactive sintering, a microstructural analysis was performed to evaluate the microstructure of the magnesium hydroxide. The observations of micropho-tographs are consistent with the porosities obtained from the model and the experimental measurements. A slight difference between experimental and calculated porosities was observed. This difference can be attribu-ted to the experimental device or measurement errors. It can be concluded that the graphical interpretation which is a continuous and nondestructive method can be an efficient way to compute porosity from mass balances without using porosity measurement.
Nomenclature
m mass (kg)
n number of moles (mol) M molar mass (kg mol 1)
V volume (m3)
L length (m)
T temperature (°C)
y ideal shrinkage coefficient (-)
z experimental shrinkage coefficient (-) G crystallite size (µm)
g gas
d the Scherrer constant (-)
Greek letters
ε bulk porosity (-) q bulk density (kg m 3)
s Full width at half maximum (-) k wavelength (Å) h diffraction angle (°) a stoichiometric coefficient b stoichiometric coefficient c stoichiometric coefficient Subscripts 0 initial s solid a air App apparent References
[1] Guidara, A.; Chaari, K.; Bouaziz, J. Elaboration and Characterization of Alumina-Fluorapatite Composites. J. Biomater. Nanobiotechnol. 2011, 2, 103–113. [2] Martin, S. Contribution à la modélisation du frittage en
phase solide, PhD thesis, Université de Technologie Compiègne, 2014.
[3] Singh, A.; Dash, S.; Kamruddin, M.; Ajikumar, P. K.; Tyagi, A. K.; Raghunathan, V. S. Formation of Nano-crystalline Calcia by the Decomposition of Calcite. J. Am. Ceram. Soc. 2002, 85(4), 927–932.
[4] Bouvard, D.; McMeeking, R. M. Deformation of Interparticle Necks by Diffusion-Controlled Creep. J. Am. Ceram. Soc. 1996, 79(3), 666–672.
[5] Nachiappan, C.; Rangaraj, L.; Divakar, C.; Jayaram, V. Synthesis and Densification of Monolithic Zirconium Carbide by Reactive Hot Pressing. J. Am. Ceram. Soc. 2010, 93, 1341–1346.
[6] Dong, Y.; Zhou, J.; Lin, B.; Wang, Y.; Wang, S.; Miao, L.; Lang, Y.; Liu, X.; Meng, G. Reaction-Sintered Porous Mineral-Based Mullite Ceramic Membrane Supports Made from Recycled Materials. J. Hazard. Mater. 2009, 172, 181–186.
[7] Naga, S. M.; Kenawy, S. H.; Awaad, M.; Abd El-Wahab, H. S.; Greil, P.; Abadir, M. F. Synthesis and Characteri-zation of Laminated Si/SiC Composites. J. Adv. Res. 2013, 4, 75–82.
Table 3. Total and closed porosities of Mg(OH)2 measured by
pycnometry, balance and calipers, and open porosity calculated using Eq. (22) at different temperatures.
Temperature (°C) Total porosity Closed porosity Open porosity 30 0.71341 0.00209 0.71132 400 0.695537 0.003455 0.692082 1,050 0.612205 0.0627 0.549505 1,150 0.596698 0.07165 0.525048 1,250 0.601181 0.062901 0.53828 1,350 0.502 0.062901 0.439099
[8] Sarbandi, B. Finite Element Simulation of Ceramic Deformation During Sintering, PhD thesis, Université de Mines Paris Tech, 2011.
[9] Ertugrul, O.; Dalmis, R.; Akpinar, S.; Kusoglu, I. M.; Celik, E. Influence of Zircon Particle Size on Conven-tional and Microwave Assisted Reaction Sintering of In-Situ Mullite–Zirconia Composites. Ceram. Int. 2016, 46, 11104–11117.
[10] Gonzalez Ocampo, J. I.; Escobar Sierra, D. M.; Ossa Orozco, C. P. Porous Bodies of Hydroxyapatite Pro-duced by a Combination of the Gel-Casting and Polymer Sponge Methods. J. Adv. Res. 2016, 7, 297–304. [11] Croquesel, J.; Bouvard, D.; Chaix, J. M.; Carry, C. P.;
Saunier, S.; Marinel, S. Direct Microwave Sintering of Pure Alumina in a Single Mode Cavity: Grain Size and Phase Transformation Effects. Acta Mater. 2016, 116, 53–62.
[12] Kim, Y.; Kim, E. P.; Noh, J. W.; Lee, S. H.; Kwon, Y. S.; Oh, I. S. Fabrication and Mechanical Properties of Powder Metallurgy Tantalum Prepared by Hot Isostatic Pressing. Int. J. Refract. Hard Met. 2015, 48, 211–216.
[13] Chrétien, L.; Bonnet, L.; Boulesteix, R.; Maître, A.; Sallé, C.; Brenier, A. Influence of Hot Isostatic Pressing on Sintering Trajectory and Optical Properties of Trans-parent Nd: YAG Ceramics. J. Eur. Ceram. Soc. 2016, 36(8), 2035–2042.
[14] Hilger, I.; Boulnat, X.; Hoffmann, J.; Testani, C.; Bergner, F.; De Carlan, Y.; Ferraro, F.; Ulbricht, A. Fabrication and Characterization of Oxide Dispersion Strengthened (ODS) 14 Cr Steels Consolidated by Means of Hot Isostatic Pressing, Hot Extrusion and Spark Plasma Sintering. J. Nucl. Mater. 2016, 472, 206–214.
[15] Huang, B.; He, B.; Xiao, Y.; Ang, R.; Yang, J.; Liao, J.; Yang, Y.; Liu, N.; Pan, D.; Tang, J. Microstructure and Bubble Formation of Al-K-Si Doped Tungsten Prepared by Spark Plasma Sintering. Int. J. Refract. Hard Met. 2016, 54, 335–341.
[16] Huang, Y. H.; Wu, Y. J.; Qiu, W. J.; Li, J.; Chen, X. M. Enhanced Energy Storage Density of Ba0.4Sr0.6TiO3– MgO Composite Prepared by Spark Plasma Sintering. J. Eur. Ceram. Soc. 2015, 35(5), 1469–1476.
[17] Khalil, Y.; Kowalski, A.; Hopkinson, N. Influence of Energy Density on Flexural Properties of Laser-Sintered UHMWPE. Addit. Manuf. 2016, 10, 67–75.
[18] Mengucci, P.; Barucca, G.; Gatto, A.; Bassoli, E.; Denti, L.; Fiori, F.; Girardin, E.; Bastianoni, P.; Rutkowski, B.; Czyrska-Filemonowicz, A. Effects of Thermal Treat-ments on Microstructure and Mechanical Properties of a Co–Cr–Mo–W Biomedical Alloy Produced by Laser Sintering. J. Mech. Behav. Biomed. Mater. 2016, 60, 106–117.
[19] Sanad, M. M. S.; Rashad, M. M.; Abdel-Aal, E. A.; El-Shahat, M. F. Mechanical, Morphological and Dielectric Properties of Sintered Mullite Ceramics at Two Different Heating Rates Prepared from Alkaline Monophasic Salts. Ceram. Int. 2013, 39, 1547–1554. [20] Shang, H.; Mohanram, A.; Bordia, R. K. Densification
and Microstructural Evolution of Hierarchically Porous Ceramics During Sintering. J. Am. Ceram. Soc. 2015, 98(11), 3424–3430.
[21] Zou, Y.; Malzbender, J. Development and Optimization of Porosity Measurement Techniques. Ceram. Int. 2016, 42, 2861–2870.
[22] Falamaki, C.; Afarani, M. S.; Aghaie, A. Initial Sintering Stage Pore Growth Mechanism Applied to the Manufac-ture of Ceramic Membrane Supports. J. Eur. Ceram. Soc. 2004, 24, 2285–2292.
[23] Baber, J.; Klimera, A.; Raether, F. In Situ Measurement of Dimensional Changes and Temperature Fields During Sintering with a Novel Thermooptical Measuring Device. J. Eur. Ceram. Soc. 2007, 27, 701–705.
[24] Marinel, S.; Savary, E. In Situ Measurement of the Shrinkage During Microwave Sintering. J. Mater. Process. Technol. 2009, 209(10), 4784–4788.
[25] Marinel, S.; Savary, E.; Gomina, M. Sintering of CuO and ZnO in a Single Mode Microwave Cavity with Shrinkage Control. J. Microwave Power Electromagn. Energy 2010, 44(1), 57–63.
[26] Zymelka, D.; Saunier, S.; Molimard, J.; Goeuriot, D. Continuous and Contactless Method of Measuring Shrinkage and Temperature Distribution During Micro-wave Sintering. Proceedings of Advances in Modeling of Microwave Sintering, 12th Seminar Computer Modeling in Microwave Engineering & Applications, Grenoble, France, March 8–9, 2010; 38–42.
[27] Chemani, H. Corrélation entre microstructure, proces-sus de division, propriétés physiques dimensionnelles et surfaciques des poudres SnO2 élaborés par voie
chimi-que en vue de leurs applications dans des domaines diversifiés, PhD. thesis, Université M’hamed Bougara de Boumerdes, Algérie, 2007.
[28] Zymelka, D. Suivi par méthode optique du frittage micro-ondes d’oxydes céramiques, PhD. thesis, Université de Lyon, France, 2012.
[29] Chen, G.; Liss, K. D.; Cao, P. An In-Situ Study of Sintering Behavior and Phase Transformation Kinetics in NiTi Using Neutron Diffraction. Metall. Mater. Trans. A 2015, 46, 5887–5899.
[30] Xu, Z.; Hodgson, M. A.; Cao, P. A Comparative Study of Powder Metallurgical (PM) and Wrought Fe-Mn-Si Alloys. Mater. Sci. Eng. A 2015, 630, 116–124.
[31] Frenkel, J. Viscous Flow of Crystalline Bodies Under the Action of Surface Tension. J. Phys. 1945, 9, 385–391.
[32] Herring, C. Effect of Change of Scale on Sintering Phenomena. J. Appl. Phys. 1950, 21, 301–303.
[33] Coble, R. L. Diffusion Models for Hot Pressing with Surface Energy and Pressure Effects as Driving Forces. J. Appl. Phys. 1970, 41, 4798–4807.
[34] Holm, E. A.; Battaile, C. C. The Computer Simulation of Microstructural Evolution. J. Miner. Met. Mater. Soc. Overview Comput. Mater. 2001, 53(9), 20–23.
[35] Olevsky, E. A. Theory of Sintering: From Discrete to Continuum. Mater. Sci. Eng. 1988, R23, 41–100. [36] Bordia, R. K.; Scherer, G. W. On Constrained Sintering I,
Constitutive Model for a Sintering Body. Acta Metall. 1988, 36, 2393–2397.
[37] Kraft, H. R. Numerical Simulation of Solid State Sinter-ing; Model and Application. J. Eur. Ceram. Soc. 2004, 24, 345–361.
[38] Ou, H.; Sahli, M.; Gelin, J. C.; Barrière, T. Experimental Analysis and Finite Element Simulation of the
Co-Sintering of Bi-Material Components. Powder Technol. 2014, 268, 269–278.
[39] Maca, K.; Pouchly, V.; Boccaccini, A. R. Sintering Densification Curve-A Practical Approach for its Construction from Dilatometric Shrinkage Data. Sci. Sintering 2008, 40, 117–122.
[40] Maizza, G.; Grasso, S.; Sakka, Y.; Noda, T.; Ohashi, O. Relation between Microstructure, Properties and Spark Plasma Sintering (SPS) Parameters of Pure Ultrafine WC Powder. Sci. Technol. Adv. Mater. 2007, 8, 644–654. [41] Maizza, G.; Grasso, S.; Sakka, Y. Moving Finite-Element Mesh Model for Aiding Spark Plasma Sintering in Current Control Mode of Pure Ultrafine WC Powder. Mater. Sci. 2007, 44, 1219–1236.
[42] Li, W.; Porter, M. M.; Olevsky, E. A.; German, R. M.; McKittrick, J. Sintering of Bi-Porous Titanium Dioxide Scaffolds: Experimentation, Modeling and Simulation. Mater. Sci. Eng. A 2015, 636, 148–156.
[43] Wei, X.; Back, C.; Izhvanov, O.; Khasanov, O. L.; Haines, C. D.; Olevsky, E. A. Spark Plasma Sintering of Commercial Zirconium Carbide Powders: Densification Behavior and Mechanical Properties. Materials 2015, 8, 6043–6061.
[44] Madiouli, J.; Lecomte, D.; Nganya, T.; Chavez, S.; Sghaier, J.; Sammouda, H. A Method for Determination of Porosity Change from Shrinkage Curves of Deformable Materials. Drying Technol. 2007, 25, 621–628.
[45] Qiu, J.; Khalloufi, S.; Martynenko, A.; Van Dalen, G.; Schutyser, M.; Almeida-Rivera, C. Porosity, Bulk Den-sity, and Volume Reduction During Drying: Review of Measurement Methods and Coefficient Determinations. Drying Technol. 2015, 33(14), 1681–1699.
[46] Wang, D.; Martynenko, A. Estimation of Total, Open- and Close-pore Porosity of Apple Slices During Drying. Drying Technol. 2015, 34(8), 892–899.
[47] Wan Noor Aidawati, Wan Nadhari, Hashim, R.; Danish, M.; Sulaiman, O.; Hiziroglu, S. A Model of Drying Kinetics of Acacia mangium Wood at Different Temperatures. Drying Technol. 2014, 32(3), 361–370. [48] Martynenko, A. True, Particle and Bulk Density of
Shrinkable Biomaterials: Evaluation from Drying Experi-ments. Drying Technol. 2014, 32(11), 1319–1325. [49] Tsuruta, T.; Tanigawa, H.; Sashi, H. Study on Shrinkage
Deformation of Food in Microwave Vacuum Drying. Drying Technol. 2015, 33(15), 1830–1836.