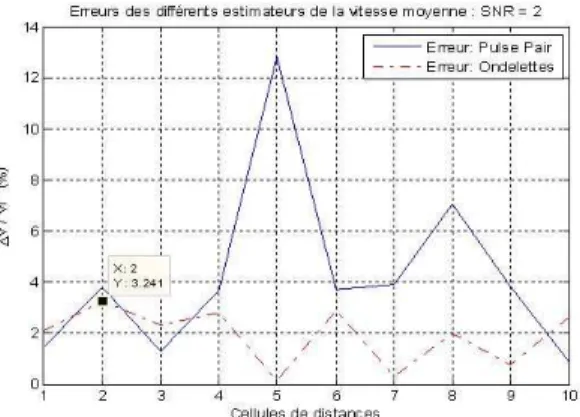
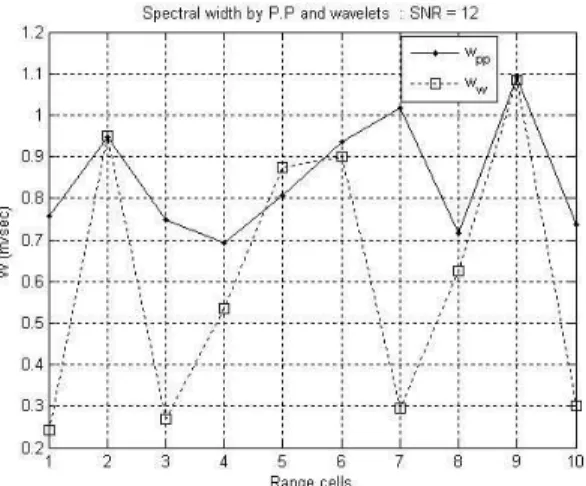
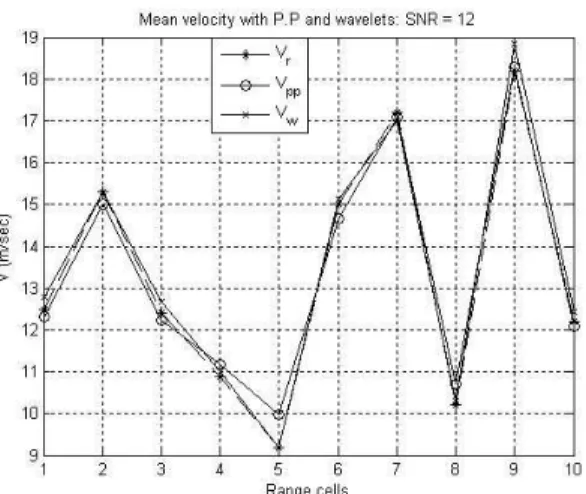
Performance comparison of pulse-pair and wavelets methods for the pulse Doppler weather radar spectrum
Texte intégral
Figure

Documents relatifs
Thermophilic species of turritellids have continued to the Recent and large, thick-shelled species still inhabit modern tropical platform environments. To observe such specimens in
Of course the peak corresponding to the 140 Ω discontinuity remains unchanged, while the peaks corresponding to the discontinuities behind the fault (from the source position)
As an alternative to the deterministic framework, we propose to handle the problem in the Bayesian framework which will provide a tight minimal bound over all the range of
We have discussed the generation of ultrashort pulse trains with very high repetition rates in the anomalous dispersion regime of a fibre, the generation of parabolic shaped pulses
This control technique of systematic gate bias pulses demonstrated a 10 dB improvement of amplitude P2P stabilities for this worst-case radar burst to meet the critical
The figure 10 shows an example of heart rate estimation using SSA scaled eigen value method and AM-FM demodulation, where we can see that the AM-FM estimation
The method is based on the use of an optically-carried radiofrequency (RF) signal in order to benefit from both the directivity of the optical beam (Lidar), and the accuracy of
Sur un graphique identique, représente, à partir du premier kilomètre, le relevé d'une voiture qui roulerait constamment à 100 km·h −1 après avoir parcouru ce premier
