Science Arts & Métiers (SAM)
is an open access repository that collects the work of Arts et Métiers Institute of
Technology researchers and makes it freely available over the web where possible.
This is an author-deposited version published in: https://sam.ensam.eu Handle ID: .http://hdl.handle.net/10985/8757
To cite this version :
Jingya YAN, Eric GUILBERT, Eric SAUX - An Ontology of the Submarine Relief for Analysis and Representation on Nautical Charts - The Cartographic Journal p.1-10 - 2013
Any correspondence concerning this service should be sent to the repository Administrator : archiveouverte@ensam.eu
An Ontology of the Submarine Relief for Analysis and
Representation on Nautical Charts
Jingya Yan
1,2, Eric Guilbert
2and Eric Saux
1 1Naval Academy Research Institute Lanve´oc-Poulmic, CC600, F-29240 Brest Cedex 9, France
2
Department of Land Surveying and Geo-Informatics, The Hong Kong Polytechnic University, Hung Hom, Kowloon, Hong Kong
Email: yjytt59@gmail.com
A nautical chart is a kind of map used to describe the seafloor morphology and shoreline of adjacent lands. One of its main purposes is to guaranty safety of navigation. As a consequence, construction of a nautical chart follows very specific rules. The cartographer has to select and highlight undersea features according to their relevance to navigation. In an automated process, the system must be able to identify and classify these features from the terrain model. This paper aims therefore at defining ontologies of the submarine relief and nautical chart that will be at the root of a model-oriented generalisation process. To the best of our knowledge, no ontology has been defined to formalize the geographical and cartographic objects for nautical chart representation. Thus, a bottom-up approach was developed to extract and model knowledge derived from standards established by the International Hydrographic Organization (IHO) and cartographers’ expertise. The submarine relief ontology formalizes undersea features describing the submarine relief. Four concepts (composition, morphometric class, shape value and depth value) are introduced to describe properties and relationships between undersea features. The cartographic representation ontology of nautical chart will define several concepts (chart, features, isobathymetric lines and soundings) for the representation of undersea features on the chart.
Keywords: ontology, nautical chart, submarine relief, representation, undersea features
INTRODUCTION
The main purpose of a nautical chart is to ensure safety and efficiency of navigation (Maxim, 1997). It provides a schematic representation of the seafloor emphasizing naviga-tion hazards and marking naviganaviga-tion channels, which assists navigators in positioning and planning their route. Indeed, as the seafloor is not visible from the vessel, danger cannot be assessed visually and navigators have to rely on the chart. As a consequence, seafloor representation on nautical charts follows different rules from terrain representation on topographic maps as the cartographer’s objective is not to represent the terrain as accurately as possible but to select and emphasize terrain features that are relevant to navigation. The seafloor being modelled by soundings and isobaths, submarine features are represented as sets of isobaths and soundings which are selected by the cartographer.
Automating the chart generalisation process requires the identification and classification of undersea features into categories relevant to navigators. Some generalisation operators specific to sounding selection (Oraas, 1975) or isobath smoothing (Guilbert and Saux, 2008) were defined, but submarine feature characteristics which can be defined
locally and globally are not considered. Extracting such knowledge can help developing techniques that mimic the cartographer’s work and automate the generalisation process but it requires first to define the characteristics to preserve and the methods to represent them.
Ontology allows the integration of information and the building of relationships primarily based on data meaning (Fonseca, 2001). In the geographical domain, ontology helps to organize geographical information and formalizes topology and mereology relations between geographical objects (Duce, 2009). The objective of this study is there-fore to define an ontology of undersea features with their geometric, topological and semantic characteristics at two levels. First, a domain ontology of the submarine relief is presented. This ontology introduces the different concepts required for the classification of features based on their spatial and semantic properties. Second, a representation ontology describing how bathymetric entities are portrayed on the map is presented. Both ontologies will be integrated together into an ontology conceptualizing the submarine relief elements and their representation to form the root of a larger ontology of the bathymetry and nautical chart generalisation process.
This paper is organized as follows: the second part in-troduces related work about terrain feature characterisation and geospatial ontologies. The third section defines the framework of this submarine relief ontology. Two ontolo-gies are presented: the domain ontology where concepts required for modeling undersea features are proposed and the phenomenological ontology describing concepts used to represent the features on the chart. Last section presents conclusions and direction for future works on extending the ontology to the generalisation process and deriving a model generalisation strategy from the ontologies are discussed.
LANDFORM CATEGORISATION
Feature representation and classification in the geographical domain
Landscape description is something that people can do easily, although they may have a different understanding influenced by their culture, language or experience, leading to a more complex and richer description: a feature belonging to the peak class (Figure 1) can be any kind of elevation from the ground such as a hill, a mountain or a plateau. This distinction is very relative (Straumann, 2009) as it depends on people’s knowledge. Different understandings make it difficult to achieve a formal definition. Establishing a universal list of features that persons can recognize is still an open problem. Terrain classification in that case is rather a problem of defining formal specifications that correspond to verbal descriptions for the purpose of communication within a community (Smith and Mark, 2003).
Existing work in this domain consists in the establish-ment of a core reference or a domain ontology collecting and formalizing knowledge gathered from experts. From the ontological perspective, terrain features are forms which are part of the terrain surface (Mark and Smith, 2001). The ontology can address either the characterisation of specific landforms such as valley (Straumann, 2009), bay (Feng and Bittner, 2010) and reef (Duce, 2009), or can define the concepts related to one domain in a core reference ontology. More general domain ontologies are defined by mapping agencies such as the IGN-E in Spain (Go´mez-Pe´rezet al., 2008) and the Ordnance Survey1 in the UK. Both ontologies rely on several ontologies including a
topographic ontology and a hydrologic ontology. Top level ontologies such as spatial ontologies are also included.
These ontologies do not extend to the maritime domain. In the hydrographic and maritime domain, the Inter-national Hydrographic Organization (IHO) is the interna-tional body engaged in defining standards in order to advance maritime safety. In order to build a common frame for the naming of undersea features, the IHO defined a terminology of undersea feature names (International Hydrographic Organization, 2008). The purpose of the document is to set a standard for communication purpose (the terminology is available in several languages) and for the denomination of undersea features (with a guideline for naming features). Although this document is only a ter-minology with definitions in natural language and no attempt of organising concepts, it defines a standard, classifies more terms and provides more precise definitions than the Geo-Wordnet2 database or USGS’s SDTS3. Therefore, the document is used as a base for the definition of the ontology of submarine relief.
Ontology framework in the geographical domain
In information science, ontology defines a set of concepts and their inter-relationships, providing a specification of a conceptualisation of a given domain which can be accepted and reused (Smith and Mark, 2001). Geospatial ontologies can deal with the totality of geospatial concepts, categories, relationships, processes, and with their interrelations at different resolutions (Mark et al., 2000). Guarino (1997) classified ontologies into four categories (top-level, domain, task and application ontologies) according to their proxi-mity to a specific task or point of view. Conceptualizing knowledge for a specific application is done by gathering specific knowledge from a domain and by integrating concepts from higher level ontologies.
In order to represent geographic objects from the real world to computer language, Fonseca (2001) introduced a five-universe paradigm. The physical and cognitive universes contain real-world phenomena and their representation in the human mind. The logical universe provides explicit ontolo-gies formalising the cognitive universe. The representation universe deals with the description of geographical elements from the logical universe and contains ontologies conceptua-lizing the elements according to the type of representation (e.g. field or object model). Finally, the implementation universe describes algorithms and data structures as imple-mented in the application.
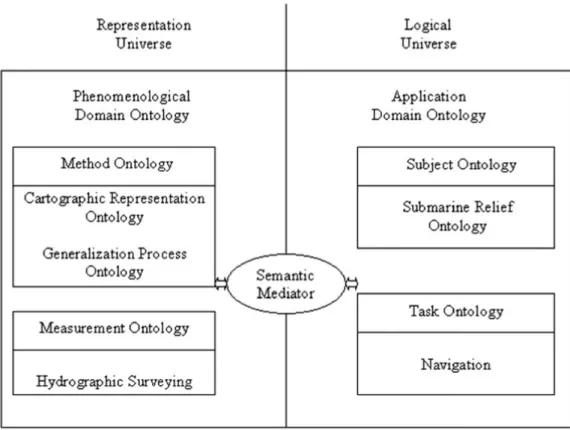
In order to organize information on geographic worlds into ontologies, Fonseca (2001) considered a multiple-ontology approach where knowledge is shared between the logical universe and the representation universe. Fonseca defined first the Application Domain Ontology (ADO), concerned with describing specific subjects and tasks, in the logical universe. It is composed of two kinds of ontology: a subject ontology describing the vocabulary related to a generic domain, and a task ontology describing a task or application within a specialisation domain. Second, the Phenomenological Domain Ontology (PDO) in the repre-sentation universe manages different properties of the geographical phenomena in the GIS. It is composed of method and measurement ontologies. A method ontology
Figure 1. Six classes of morphometric features (Wood, 1996)
COLOUR
FIGURE
defines a set of algorithms and data structures, and a measurement ontology describes the physical process of recording a geographical phenomenon. Both universes are defined separately. Different representations can be defined for one application or one representation used for different applications. The connection between both ontologies is made by semantic mediators.
AN ONTOLOGY OF SUBMARINE RELIEF
Organisation of the ontology
The conceptualisation of the bathymetry represented on nautical charts requires the definition of several ontologies. Following Fonseca’s framework, concepts describing the maritime domain are part of the logical universe (Figure 2). The subject ontology conceptualizes knowledge about sub-marine relief. It defines formally all the characteristics of undersea features in terms of properties and relationships. Nautical charts being mainly designed and used for navigation purpose, the task ontology describing specialized applications would logically be related to navigation and route planning.
The nautical chart provides a representation of the seafloor and concepts pertaining to the construction of the chart and its generalisation are in the representation universe. As mentioned before, the PDO is defined for a specific representation independently from the ADO. Therefore, the method ontology describes the concepts used for the representation on the chart. That includes among others the graphical elements displayed on the chart (isobaths, soundings) but also the generalisation operations (sounding
selection, isobath extraction) and operations matching features from the ADO with the PDO. The measurement ontology refers to data collection techniques (e.g. echo sounding, LIDAR).
In this paper, only the characterisation of undersea features and their representation on the chart are addressed. Task and measurement ontologies require knowledge about data acquisition or maritime navigation which are out of scope. Both ontologies are application ontologies and make use of higher level ontologies providing more general concepts such as spatial concepts, topology and mereology. Most knowl-edge was extracted from the IHO terminology (International Hydrographic Organization, 2008)4and from documents on the preparation of nautical charts from hydrographic services (SHOM, 1995; Maxim, 1997). The next sections present first the ADO subject ontology including different feature classes with their properties and relationships and second, the PDO method ontology is introduced.
The submarine relief ADO
Undersea features are parts of the seafloor that have measurable relief or are delimited by relief (International Hydrographic Organization, 2008). The IHO provides a terminology of 46 undersea features, each of them defined in natural language. Building the domain ontology is done in two steps. First, properties and relationships characterizing each of the 46 features are identified by analysing the definitions and extracting keywords corresponding to feature characteristics. Second, these characteristics are organized into different classes (composition, shape) and relationships. They correspond either to instances of different classes or to relationships (mereological, topological, taxonomic)
connecting features. At the end of the process, classes defining undersea features form a hierarchy of classes. Properties composing each feature are formally defined in separate classes by their instances. Figure 3 shows the structure of submarine relief ontology developed using Prote´ge´. Details of ontology definitions are introduced in the following parts.
Undersea feature concept definition
Undersea features are defined by qualitative properties relating mainly to the morphometry and their relative location on the seafloor but also to some semantic and topological properties. The objective is not to explicitly locate the beginning and ending of a feature, but to find out the presence of features corresponding to an end-user typology. The conceptual model of the domain ontology is presented in Figure 3.
Feature description is based on the assumption that the perception of a particular feature is dependent of the percep-tion of saliences described by properties of themorphometric class and shape value concepts. Morphometric classes (Wood, 1996) form a top level ontology. They provide a high level qualitative description of the landscape as people would semantically associate mountains and hills to peaks, and valleys to channels for example. A feature is composed of significant points, lines or areas. These significant compo-nents are identified from the description given in the IHO document. The shape of a feature can be characterized according to the 2D shape of its base, the kind of slope on its side and the shape at its salient point forming the summit or lowest point. Therefore, theshape value concept is specia-lized into four sub-concepts describing the type of slope and
the feature shape at its base. These concepts are further detailed in the section on ‘Shape value’.
The depth level concept is defined as a spatial property relating features with different parts of the seafloor. These parts have different geomorphological properties and are located at different levels of depth forming a partition of the seafloor which is described in the section on ‘Depth level’. Finally, several properties define semantic feature attri-butes. TheComposition concept describes the composition of the seafloor with possible values such as rock, sand, volcanic and so on. Theedge location refers to the position of special boundaries of features and includes bottom and top as values. The height describes the height of features, and the hazard indicates if a feature represents a risk for navigation. For example, a shoal and a bank are both eminences located in shallow depth, but the shoal is a navigation hazard, while the bank is deep enough for safe navigation.
Some of these concepts are defined in the top level ontology, while others are at the domain level. This work also includes existing concepts defining topological, mereological and spatial relationships such as the nine-intersection model (Egenhofer and Robert, 1991). All of them are used to record spatial relationships characterizing undersea features. For instance, a basin touches a continental margin and a mid-ocean ridge.
Each feature of the IHO document is associated to one class. Classes can differ in the number or type of properties they own or on the values taken by some properties. In order to provide a description of features at different levels of precision, less precise classes are built on top of classes sharing common properties in a bottom up approach. For
Figure 3. Conceptual model of the submarine relief5
example, a PeakFeature class is a feature whose morpho-metric class is set to Peak and other properties are not defined. All feature classes defining different kinds of peaks would inherit from the PeakFeature class. One class can inherit from one or several superclasses. This approach provides a taxonomy of the terrain in order to facilitate terrain classification and analysis, especially in the case some properties cannot be defined or are not required. At the end of the process, undersea features described in the IHO terminology are located at the bottom of the taxonomy and all features are connected together via taxonomic, mereo-logical and topomereo-logical relationships. In the following, the depth and shape value concepts are described in details.
Depth level
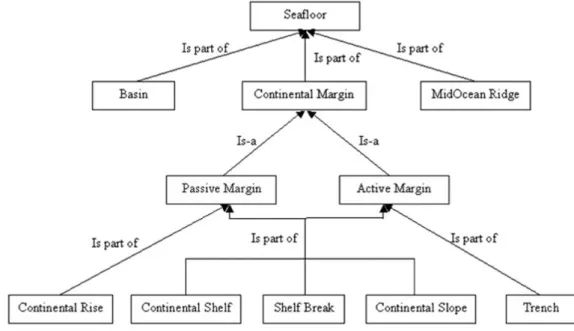
Each undersea feature is located in a specific part of the seafloor and can be classified accordingly. The seafloor can be divided into three main parts: continental margin, basin and mid-ocean ridge (Wright and Rothery, 1998) (Figure 4). The continental margin is the most important part of the seafloor, corresponding to the transition between the
continent and the deep ocean (Seibold, 1996). There are two kinds of continental margin: the passive margin and the active margin (Wright and Rothery, 1998). Both of these continental margins are divided into a continental shelf, a shelf break and a continental slope. In addition, many passive continental margins have a continental rise, a gentle slope of sediment that forms between the continental slope and the basin. Unlike passive continental margins, active continental margins lack a continental rise and the continental slope extends into an oceanic trench. Basin is one of the largest features of the seafloor. It is a deep depression of more or less circular or oval form (Stewart, 2003). Mid-ocean ridges are continuous submarine mountain chains separating ocean basins. These features form a partition of the seafloor (Figure 4) and are also defined in the IHO terminology. Therefore, they can be connected by spatial and mereological relationships as shown in Figure 5.
Shape value
Theshape value class is the super class of three specialized classes describing different parts of the feature. Each feature
Figure 4. Characterisation of the seafloor
can be decomposed into up to three parts: the base is described by itsHorizontal Profile and its Relative Spatial Extent, the side is defined by its Vertical Profile and the tip is described by itsTip Type.
The Relative Spatial Extent is defined by the ratio between the feature height and its spatial extent. It includes two values, large and small. Large (respectively small) means that the area of the object is large (respectively small) with regard to its height and correspond to a value lower (respectively, greater) than a given threshold.
The Horizontal Profile is defined by the ratio between the length and the width of the feature base. If close to 1, the feature is equidimensional; otherwise, it is elongated.
The Vertical Profile: Classifies undersea features with more details according to the slope and elevation of the feature with regard to its neighbourhood. The value is indeed related to the Morphometric Class. Four sub-concepts are used to describe the vertical profile:
N
theeminence feature is higher than its surrounding, such as a hill which is an isolated elevation;N
thedepression feature is lower than its surrounding, such as a trench which is an asymmetrical depression of the sea floor;N
theslope feature is an inclined plane, such as a shelf or a levee. Depending on the IHO document, slope values can be gentle or steep; andN
horizontal plane refers to a horizontal flat plane. The Tip Type concept describes the outline of eminence and depression features. Therefore, each type can describe either the summit of an eminence or the bottom of a depression.N
Point feature means the tip is a small pointed area with a small Relative Spatial Extent value. In this study, point features are extreme points of features. There are two classes of point feature: round and sharp (Figure 6). Slope variation around point feature is smooth (Figure 6, left), while slope variations around sharp point feature are large, showing a break of slope (Figure 6, right) will steep slope value;N
Line feature means that the salient part of the feature is directed along a linear axis. This axis can be a line of a ring. The vertical profile of the features is like a ‘V’ shape. Ring features are like a circle. Figure 7 illustrates the line features. The Horizontal Profile value of Line feature is normally elongated; andN
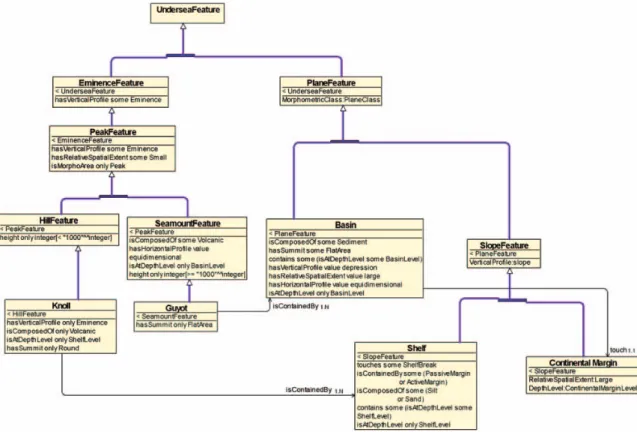
Area tip is a broad area at the top or bottom of an undersea feature. TheArea tip is usually equidimensional. It can be a tapered area of relatively small extent and the change of elevation with its surrounding area is steep. Flat area meansthat the area is large and flat with big change of slope on the borders as for a plateau. Round area means the transition between the area which is a curved surface and the side slopes is rather smooth. Table 1 models such area tip types. In summary, the undersea feature concept represents features from IHO document and characterizes them according to theircomposition, morphometric class, shape values and depth level. For instance, Seamount feature is a peak feature whose height is greater than 1000 m, its horizontal profile is equidimensional and its composition is volcanic. All feature concepts are gathered in a hierarchy where features at upper levels correspond to broad concepts from which several features sharing the same similarities can be derived. Figure 8 shows some examples of superclasses with their properties and relationships.
The whole submarine relief ontology is accessible on line6.
The seafloor representation PDO
The PDO ontology not only defines cartographic elements drawn on the map and cartographic constraints, it also describes how features are portrayed on the chart. It is built based on documents from the SHOM7and the NOAA8and with the SHOM cartographers’ expertise. In total, four main concepts – chart, isobath, sounding and feature – are defined together with their spatial relationships and data properties (e.g. density of soundings in a feature) (Figure 9).
Charts are produced at a large range of scales according to the purpose and area portrayed, from small scales from which the initial route is planned to very large scale for visual navigation along coastal areas and in harbours. Chart proper-ties include the scale, the location and the date and define metadata such as the isobath depth levels, the density of information from which generalisation constraints are derived. Isobaths are equal depth contour lines depicting sub-marine relief. On a chart, the vertical interval between two consecutive isobaths is not regular, the interval being shorter
Figure 6. Point features: round peak (left) and sharp peak (right)
Figure 7. Line tip type: (a) top and bottom line, (b) ring
Table 1. Area tip type
Area tip type Eminence Depression
Tapered Flat Round
COLOUR
FIGURE
COLOUR
FIGURE
6
in shallow areas where more information is required. Navigators identify dangerous areas and other relevant features on the nautical chart as groups of isobaths combined with soundings and forming specific patterns. In addition, topological relationships describe the relationships between isobaths, soundings and features.
Soundings are divided into three main classes: prime sounding, limiting depth sounding and background sound-ing (Zoraster and Bayer, 1993). Prime soundsound-ings tend to
be distributed irregularly over a nautical chart and reflect some significant undersea features in areas of high relief, such as shoal. Hence, prime soundings play an important role in navigation. Mostly, prime sounding present isolated features, which can be enclosed by an isobath. Limiting depth soundings show the least depth encountered when following the deepest part of a natural channel or river. They relate to some hazardous shallow areas. Background soundings describe regular areas on the nautical chart and
Figure 8. Examples of class diagram of undersea feature terms
Figure 9. Conceptual model of the seafloor representation
COLOUR
FIGURE
represent the largest part of the soundings. In order to distinguish more details in the nautical chart, background soundings are separated into three kinds: deep sounding, fill sounding and supportive sounding. Supportive soundings provide additional information about the shape of the seafloor and periodic identifiers for isobaths to show changes in bottom slope away from shoals or deeps (Maxim, 1997). Deep soundings are approximately 10– 20% deeper than their surroundings (Maxim, 1997) and are less important than prime soundings and limiting depth soundings. Fill soundings provide information about large, gradually sloping depressions that are not deep enough to be enclosed by an isobath (Maxim, 1997).
Feature is a concept defined in the cartographic repre-sentation ontology, which is deduced from the nautical chart and makes the relationship between the submarine relief and cartographic representation ontologies. Elements described in this concept are not protrayed on the chart like soundings and isobaths but can be perceived from the spatial structure. For example, an elevation is represented by a sounding higher than its surrounding or by a set of circular isobaths higher in the centre. It is divided into three subconcepts: critical lines, morphometric features and bottom features.
N
Critical lines connect critical points (saddles, maxima, minima) to identify some feature lines, which can be perpendicular to isobaths (Bajaj et al., 1998). Critical lines help to identify morphometric features and are the support to some specific features, such as canyon;N
A Morphometric Feature is composed of soundings, isobathymetric lines and/or critical lines, and represents a feature on the chart. Among these features, the depression class describes a region where all the inner contours are lower than the boundary contour, including channels and pits. Theeminence class represents a region where all the inner contours are higher than the boundary contour, including ridges and peaks. In the nautical chart, pit and peak are represented by at least one sounding most often enclosed by an isobath, ridge and channel are described by soundings marking the critical line and bordered by one or several isobaths. A pass describes a feature located in a lower (respectively higher) region joining two higher (respectively lower) regions. Aplane classifies features that are delineated by two boundary contours of different elevations where all the inner contour elevations are within the boundary elevations (Guilbert, 2013); andN
Morphometric Area classifies different types of bottom and provides knowledge for sounding selection. There are three different kinds of seafloor: smooth area, rough area and hazard area. Smooth areas are described as wide with gentle variations and so can be represented with a low density of soundings. Smooth areas mostly include plane features and are located in deep sea. Rough areas contain different undersea features with large depth and slope variations. Because there are some important undersea features in rough areas, more soundings will be selected. Moreover, supportive soundings are selected to reinforce the least depth as well as to define the zones between the shoals (Maxim, 1997). Hazard areas are shallow regions of the continental margin which can bedangerous for navigation. Usually, the density of soundings in these areas is high.
CONCLUSION AND DISCUSSION
This paper introduces an ontology of undersea features for their analysis and representation on nautical charts. The ontology is divided into two parts. A first ontology provides a formal description of each feature’s characteristics. Knowledge was built in a bottom-up approach from standards established by the IHO. The benefit of the hierarchical structure is that features can be described at different levels of detail according to application requirements. As a domain ontology, it can be used not only for nautical chart production but also for other applications related to oceanography or navigation for example. The second ontology is in the representation domain and describes the different elements portrayed on the chart, either directly drawn (soundings, isobaths) or interpreted from other elements (critical lines, features).
The ontology was developed in collaboration with carto-graphers. One first objective of the work is to enrich the knowledge stored in the bathymetric database by integrating the new concepts into the database schema. A second direction is to formalize the way features are represented on the chart to automatically identify which information should be preserved when generalizing the chart. Currently, the generalisation process is mostly done manually by cartogra-phers as, due to its specificities and safety requirement, terrain generalisation approaches for topographic maps do not apply to nautical charts. Furthermore, existing techniques are mostly relevant to cartographic generalisation and visualisation requirements. They do not take into account information about the features and the meaning carried by the final map. Much work deals with cartographic generalisation and not with model generalisation. The ontology presented here can be used as a base to enrich the generalisation process.
Automation also requires the definition of a generalisation ontology extending the PDO which formalizes cartographic rules, generalisation operations and evaluation methods. The PDO should also integrate practices and knowledge gained by experience from cartographers and so provide tools for model and cartographic generalisation. At the end, the ontology should have gathered enough knowledge to design a generalisation strategy that can be implemented.
BIOGRAPHICAL NOTES
Miss Jingya Yan is a PhD student of the Naval Aca-demy Research Institute (IRENav) in France, and co-supervised by Depart-ment of Land Surveying and Geo-Informatics (LSGI), The Hong Kong Polytech-nic University. She obtained her BSc degree from Hainan University, China in 2007 and MSc degree from The Hong Kong Polytechnic University in 2011.
COLOUR
FIGURE
NOTES 1 http://www.ordnancesurvey.co.uk/oswebsite/ontology/ 2 http://geowordnet.semanticmatching.org 3 http://mcmcweb.er.usgs.gov/sdts/ 4
http://www.iho.int/iho pubs/bathy/B-6 e4 EF Nov08. pdf
5http://sirs.scg.ulaval.ca/perceptory 6
www.dropbox.com/s/2hssg1cty1dvfji/undersea.owl 7
Hydrographic and Oceanographic Service of the French Navy.
8
National Oceanic and Atmospheric Administration.
ACKNOWLEDGEMENTS
We are grateful to the Service Hydrographique et Oce´no-graphique de la Marine (Brest, France) for their nautical documents and for their assistance and expertise in this study. This work was funded by the Research Grant Council of Hong Kong (grant PolyU 5172/08E), the Consulate General of France in Hong Kong and the Re´gion Bretagne in France under grant 0211/ARE 09011/00026102.
REFERENCES
Bajaj, C., Pascucci, V. and Schikore, D. (1998). ‘Visualization of scalar topology for structural enhancement’, in Conference on Visualization’98, pp. 51–58, Research Triangle Park, NC, Oct 18–23.
Duce, S. (2009). ‘Towards an ontology for reef islands’, Lecture Notes in Computer Science, 5892, pp. 175–187.
Egenhofer, M. and Robert, D. (1991). ‘Point-set topological spatial relations’,International Journal of Geographical Information System, 5, pp. 161–174.
Feng, C. and Bittner, T. (2010). ‘Ontology-based qualitative feature analysis: Bays as a case study’,Transactions in GIS, 14, pp. 547– 568.
Fonseca, F. (2001). Ontology-driven geographic information systems. PhD thesis. The University of Maine. Farmington, ME, USA. Go´mez-Pe´rez, A., Ramos, J., Rodrı´guez-Pascual, A. and
Vilches-Bla´zquez, L. (2008). ‘The IGN-E case: integrating through a hidden ontology’, in13th International Symposium on Spatial
Data Handling (SDH 2008), pp. 417–435, Montpellier, Jun 23– 25.
Guarino, N. (1997). ‘Semantic matching: formal ontological distinc-tions for information organization, extraction, and integration’, Lecture Notes in Computer Science, 1299, pp. 139–170. Guilbert, E. (2013). Multi-level representation of terrain features on a
contour map.GeoInformatica, 17, pp. 301–324.
Guilbert, E. and Saux, E. (2008). ‘Cartographic generalisation of lines based on a B-spline snake model’, International Journal of Geographical Information Science, 22, pp. 847–870.
International Hydrographic Organization. (2008). Standardization of Undersea Feature Names, 4th ed., International Hydrographic Bureau, Monaco.
Mark, D. and Smith, B. (2001). ‘A science of topography: bridging the qualitative-quantitative divide’, in Geographic Information Science and Mountain Geomorphology, pp. 75–100, Springer-Praxis, New York.
Mark, D., Egenhofer, M., Hirtle, S. and Smith, B. (2000). UCGIS emerging research theme: ontological foundations for geographic information science, http://www.ucgis.org/-priorities/research Maxim, L. D. (1997). Nautical chart user’s manual. Technical report.
US Department of Commerce, National Oceanic and Atmospheric Administration (NOAA), National Ocean Service. Silver Spring, MD, USA.
Oraas, S. (1975). ‘Automatic sounding selection’, International Hydrographic Review, 52, pp. 103–115.
Seibold, E. (1996). The Sea Floor: An Introduction to Marine Geology, Springer-Verlag, Berlin.
SHOM. (1995). Etude d’aides a` la pre´paration des cartes marines. Etude de faisabilite´e: Partie 2 conception de´taille´e des traitements. Technical report. Service Hydrographique et Ocanographique de la Marine (SHOM). Brest Cedex, France.
Smith, B. and Mark, D. (2001). ‘Geographical categories: an ontological investigation’,International Journal of Geographical Information Science, 15, pp. 591–612.
Smith, B. and Mark, D. (2003). ‘Do mountains exist? Towards an ontology of landforms’,Environment and Planning B, 30, pp. 411–428.
Stewart, R. (2003).Introduction to Physical Oceanography, Texas A&M University, College Station, TX.
Straumann, R. (2009). ‘Experiences in developing landform ontolo-gies’, inGeomorphometry 2009, pp. 17–21, Zurich, Aug 31–Sep 2.
Wood, J. (1996). The geomorphological characterisation of digital elevation models. PhD thesis. University of Leicester. Leicester, UK, p. 104.
Wright, J. and Rothery, D. (1998).The Ocean Basins: Their Structure and Evolution, Vol. 1, Butterworth-Heinemann, Oxford. Zoraster, S. and Bayer, S. (1993). ‘Automated cartographic sounding