HAL Id: hal-01787804
https://hal-mines-paristech.archives-ouvertes.fr/hal-01787804
Submitted on 7 May 2018HAL is a multi-disciplinary open access archive for the deposit and dissemination of sci-entific research documents, whether they are
pub-L’archive ouverte pluridisciplinaire HAL, est destinée au dépôt et à la diffusion de documents scientifiques de niveau recherche, publiés ou non,
Breakthrough studies of the adsorption of Cs from
freshwater using a mesoporous silica material containing
ferrocyanide
Caroline Michel, Yves Barré, Mehdi Guiza, Caroline de Dieuleveult, Laurent
de Windt, Agnès Grandjean
To cite this version:
Caroline Michel, Yves Barré, Mehdi Guiza, Caroline de Dieuleveult, Laurent de Windt, et al.. Breakthrough studies of the adsorption of Cs from freshwater using a mesoporous silica ma-terial containing ferrocyanide. Chemical Engineering Journal, Elsevier, 2018, 339, pp.288-295. �10.1016/j.cej.2018.01.101�. �hal-01787804�
Breakthrough studies of the adsorption of Cs from
freshwater using a mesoporous silica material containing
ferrocyanide
Caroline Michel1,2, †, Yves Barré1, Mehdi Ben Guiza1, Caroline de DieuLeveult2, Laurent De
Windt2, Agnès Grandjean1,*
1 CEA, DEN, DE2D, SEAD, Laboratoire des Procédés Supercritiques et de Décontamination, F-30207
Bagnols-sur-Ceze, France.
2 MINES ParisTech, PSL Research University, Centre de Géosciences, F-77300 Fontainebleau,
France.
* Corresponding Author
Agnes Grandjean : [email protected]
†Present Address
CEA, DEN, DE2D, SEVT, Laboratoire de Développement des Procédés de Vitrification, F-30207 Bagnols-sur-Ceze, France
Abstract
The selectivity and fast exchange kinetics of porous silica adsorbents containing Cu or K ferrocyanide make them ideal candidates for the column decontamination of 137Cs effluents. The exchange thermodynamics of the K+ ions in Sorbmatech® (S202, one such adsorbent) with the major cations present in natural (fresh or sea) water have recently been studied in competition with Cs+ sorption to properly model batch data. This article reports an evaluation of this material for continuous, column processes of freshwater decontamination. Experimental data show that its performance is excellent under these conditions, with a steep breakthrough curve of Cs at column exit. The sorption capacity of S202 is completely retained at high flow rates (up to 10 m·h−1 Darcy velocity) and its column behavior remains
dispersive flow through the bed coupled to ion diffusion and exchange inside the porous adsorbent grains accurately reproduces the experimental data.
Keywords
Cesium decontamination, column, modeling, ferrocyanide.
1
Introduction
The nuclear fuel cycle produces radioactive effluents, from different sources, that need to be treated specifically before they are released into the environment. An additional potential source of radioactive pollution are effluents from nuclear accidents such as contaminated (fresh and sea) water from the Fukushima disaster. There is therefore a substantial demand for effective yet inexpensive methods to decontaminate the radionuclide-contaminated water, and transfer the contamination into a sorbent easier to manage. 137Cs is
one of the most abundant and hazardous radionuclide because it is found in many types of waste and has a relatively long half-life (30 years). Its selective extraction from the effluent is therefore necessary, but the presence of naturally occurring alkali and alkaline earth ions makes this difficult in contaminated water. This is the context in which Sorbmatech® 202 (S202), a selective adsorbent for Cs, was developed. This material consists of potassium/copper ferrocyanide nanoparticles inserted inside mesoporous silica grains. Although pure ferrocyanide adsorbents can extract cesium rapidly and selectively, their small grain size means that they cannot be used in fixed-bed columns because of pressure loss and clogging. Their low adsorption kinetics in powder form is also problematic for column processes. One way to overcome these drawbacks is to insert selective ferrocyanide
processes: the porosity of the support and the high surface/volume ratio of the hexacyanoferrate particles inside the pores improves the adsorption rate. Numerous composite solids (organic or inorganic) loaded with hexacyanoferrate particles have thus been proposed for cesium removal in the past few years [1-14].
The fast Cs+ sorption kinetics measured for S202 [11] suggest that this material should
remain effective in column processes at high flow rates. Studies in batch processes with freshwater have shown that competitive effects involving naturally present cations should be taken into account however [11]. A model was also developed in this study that reproduced the experimental data points precisely, especially at low Cs+ concentrations. Freshwater was therefore chosen as the Cs-containing effluent in the present study of column processes. The conditions investigated here are thereby similar to those in which S202 would be used in practice.
The fixed-bed column behavior of this material was characterized at flow rates much lower that would be used in industrial applications. Therefore, to make our results transposable to higher scales, we investigated the effects of two important parameters—the Darcy (or linear flow) velocity and the geometric ratio of the height (H) of the bed over the diameter (D) of the column (H/D)—whose careful adjustment ensures optimal performance. The flow rate needs to be high to allow large volumes of effluent to be treated rapidly. However, the faster the Darcy velocity is, the more convective flow dominates over diffusion, meaning that the cations are adsorbed deeper in the bed or not at all. The maximum capacity of the material is not reached and leakage occurs prematurely from the column. This can be avoided by increasing the depth of the bed to ensure sufficient contact and guarantee that the column flow-through is balanced. Using low H/D ratios may reduce the decontamination efficacy of the column. However, if the H/D ratio is too high, this can lead to load loss at the top of the column, which could increase the cost of the process.
This article presents the experimental procedures and tests performed to optimize the operating parameters for column decontamination using S202. The hydrodynamic flow in the column and measurements of load loss and the distribution of dwell times are then used to model the set of breakthrough curves obtained. Finally, four of the breakthrough curves corresponding to different velocities and geometries are modeled using the reactive transport software Optipur [15].
2 Material and methods
2.1 Characteristics of the adsorbent and solution used
The synthesis and Cs adsorption properties of S202 in aqueous solutions have been described previously [11]. This material consists of a mesoporous silica matrix with pores around 8 nm in diameter, and grain size of 250–500 µm containing K2Cu(Fe(CN)6)
nanoparticles that selectively extract Cs. The grains have an irregular, roughly octahedral, shape. As reported previously [11], the material's specific surface area (SBET = 280 m2·g−1)
was obtained by measuring nitrogen adsorption-desorption isotherms and applying the BET model [16]. The mean pore diameter (dp = 7.9 nm) was calculated using the BJH model [17].
The total pore volume (Vp = 0.58 cm3·g−1) of the material was obtained from the point on the isotherm at which the relative pressure was equal to 1. The volumetric mass density of the material (ρ = 3.4 g.cm-3 ·mL−1) was measured by helium pycnometry. The porosity of the material (equal to 0.17, dimensionless) was then quantified by dividing the pore volume by the density of the material (Vp/ρ).
To account for competition effects and in view of using the process to decontaminate natural water, the Cs adsorption experiments were performed at room temperature in
are Ca2+ and Mg2+ whereas the concentration in solution of K+ (i.e. the exchangeable cation present in the solid S202) is low. Under these conditions, the adsorption capacity and distribution coefficient (Kd,Cs) of S202 for Cs were found to be 0.180 meq·g−1 and 330
mL·g−1, respectively. The concentration of ions in solution was measured by Atomic Absorption Spectroscopy for Cs and other ions were analyzed by ICP-AES.
Table 1
Average composition of the freshwater used for Cs adsorption tests.
Concentration (mol·L−1) Na+ 2.8×10⁻⁴ K+ 4.4×10⁻⁵ Mg2+ 1.1×10⁻³ Ca2+ 2.0×10⁻³ Cl− 1.9×10⁻⁴ SO42− 1.3×10⁻⁴ HCO3− 5.9×10⁻³ NO3− 6.0×10⁻⁵ SiO2 2.5×10⁻⁴ pH 8
2.2 Set-up used for measuring breakthrough curves
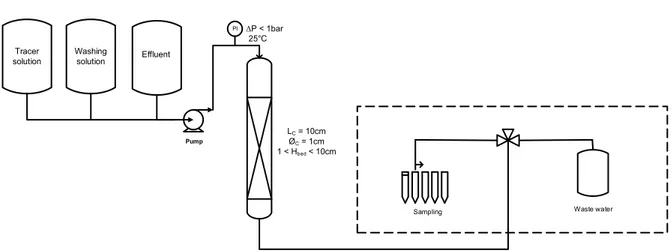
The setup used for the breakthrough curve experiments is shown in Fig. 1. The Cs-containing solution was placed in a 5 L Pyrex flask and pumped into the column using a peristaltic pump (Ismatec IP ISM942) for low flow rates or an HPLC pump (RHOS Prep Pump) for high flow rates. A manometer was placed at the column head to measure load loss. The column flow-through was gathered in an automatic fraction collector (Labomatic
Vario-4000) with a three-way valve. The pumps and fraction collector were connected to the column via screw connectors.
Fig. 1. Schematic diagram of the experimental set-up for the breakthrough experiments.
The operating parameters recorded for each breakthrough experiment were: i) the mass of adsorbent in the column (mads in g), ii) the column geometry and iii) the Darcy or
linear velocity U (m·h−1). The geometry of the column was characterized by the height and volume of the bed H (cm) and V (mL or L), the diameter and corresponding effective cross-sectional area of the column D (cm) and Ω (m2), as well as the dimensionless ratio H/D. The Darcy velocity was obtained by dividing the volumetric flow Qv (mL or L) by the effective
cross-sectional area of the column, U = Qv/Ω.
Two laboratory columns, 1 or 2.5 cm in diameter were used, with corresponding effective cross-sectional areas of 7.9×10⁻⁵ and 4.9×10⁻⁴ m2, respectively. The column
diameters are more than 10 times the grain size so edge effects can be ignored [18], provided the H/D ratio is above a certain threshold value. Below this, preferred paths appear and premature leakage occurs. The values chosen for the operating parameters for each breakthrough experiment are listed in Table 2.
Waste water ΔP < 1bar 25°C PI Pump LC = 10cm ØC = 1cm 1 < Hbed < 10cm Sampling Washing solution Effluent Tracer solution
Table 2
Operating parameters for the breakthrough curve experiments.
Test D (cm) H (cm) H/D V (mL) mads (g) U (m·h−1) T1 1 5 5 3.9 2.7 2.0 T2 1 5 5 3.9 2.7 10.0 T3 1 2 2 1.6 1.0 2.0 T4 1 2 2 1.6 1.0 10.0 T5 2.5 0.8 0.32 3.9 2.7 2.0 T6 2.5 5 2 24.5 16.2 2.0 T7 1 0.4 0.4 0.31 0.2 2.0
D, column diameter; H, bed height; V, bed volume; mads, mass of
adsorbent in the column; U, Darcy velocity.
2.3 Breakthrough curves
The breakthrough experiments involved measuring the Cs concentration C (mol.L-1) at the exit of the column as a function of time as the simulated effluent flowed through. A series of 5 mL samples of the flow-through were extracted at various times and analyzed. The breakthrough curves represent the evolution of this Cs concentration as a function of time or the flow-through volume V (L). The half-breakthrough time t1/2 (s) or volume V1/2 is the time
(volume) at which the Cs concentration at column exit is half the initial concentration of the effluent. The amount of Cs extracted per gram of adsorbent Q (mol.g-1) when a volume V
1
passed through the column was calculated using
𝑸(𝑽𝟏) =
𝑪𝟎𝑽𝟏− 𝑽𝟏𝑪 𝒅𝑽
𝟎
𝒎ads
(1)
where mads is the total mass of adsorbent (g), and C0 is the Cs concentration at the entry of the
Since, as shown on RTDs curve (§4.4), there is little axial dispersion in the column (due to hydrodynamic effects or the sorption kinetics), the plug flow reactor model can be used to calculate V1/2 from the adsorbent's Kd,Cs: V1/2 = Kd,Cs × mads.
Since ferrocyanides are known to be very selective for Cs [19, 20], the spread of these breakthrough curves depends mainly on the exchange kinetics and the operating conditions. 2.4 Flow hydrodynamics: residence-time distribution
Residence-time distributions (RTDs) were obtained by measuring the electrical conductivity of the flow-through as a function of time, using a conductimeter from Mettlet Toledo (FiveGoTM F3). A solution of NaNO3 with an initial conductivity of 45 mS·cm−1 was
injected using Dirac (< 3 s) pulses into the column, in which the S202 bed had been saturated in Cs to avoid chemical reactions occurring. Measurements were taken for a fixed bed height at various Darcy velocities in both columns (D = 1 or 2.5 cm).
3 Modeling
3.1 Column and grain models
The packed column was modeled as containing two separate porous media, zones I and II, corresponding respectively to the aqueous solution between the grains and the adsorbent grains themselves (Fig. 2). Zone I is strongly connected while in the grains, transport was assumed to be purely diffusive. Ion exchange reactions occurred in the grains only. The total porosity of the column (ε) is influenced by the porosity of the bed (εI) and of
the grains (εII = 0.17 for S202, as mentioned in section 2.1) as follows [21]:
Fig. 2. Schematic representation of a column packed with S202 grains with the two zones in which the fluid flows by convection (dashed blue arrow, zone I) or diffusion takes place only (solid red arrow, zone II).
To support the interpretation of the modeling results, the grains were assumed to be divided into two regions, an inner sphere and an outer shell (Fig. 3).
Fig. 3. Schematic representation of two diffusive regions in an adsorbent grains.
3.2 Column hydrodynamics
The hydrodynamics of a column can be characterized by its RTD, measured at column exit as described in section 2.4. The shape of the RTD reveals the presence (or not) of stagnation and/or preferential paths in the column. The RTD is the normalized output (Exit) concentration E(t):
𝐸 𝑡 = 𝐶(𝑡) 𝐶 𝑡 𝑑𝑡
!
! (3)
As this is a statistical distribution, the mean residence time 𝑡! (s) is equal to the first moment
of the RTD:
𝜇! = 𝑡!= 𝑡 !
! 𝐸 𝑡 𝑑𝑡 (4)
Assuming an axially-dispersed plug flow, the RTD can be expressed in terms of the dispersion Péclet number, Pe [22]:
𝐸 𝑡 = 1 2 𝑃𝑒 𝜋 𝜏 𝑡 𝑒𝑥𝑝 − 𝑃𝑒(𝜏 − 𝑡)² 4 𝜏 𝑡 (5)
where 𝜏 (s) is the ideal residence time under continuous flow:
𝜏 =𝑉 𝜀
𝑄! (6)
The more convective (diffusive) the flow is, the higher (lower) the Péclet number is and the more the reactor behaves like an ideal plug flow reactor. In practice, when Pe ≥ 100, dispersion can be neglected. The Péclet number and the total porosity of the column (ε) were obtained by fitting the experimental E(t) curves using Eq. 5. The values obtained were then used as inputs for Optipur calculations based on a general transport model.
3.3 Modeling reactive transport in a packed column
As depicted in Fig. 2, a packed column is characterized by two overlapping porous media (zone I and zone II). The transport model was adapted to this situation by assuming that exchange between the two media is purely diffusive.
Three different mechanisms contribute to transport in the column bed (zone I): convection, molecular diffusion and kinematic dispersion. Intra-grain (zone II) transport involves only a
𝝏𝜺𝑰 𝑪𝒊𝑰 𝝏𝒕 = 𝑳𝑰 𝑪𝒊𝑰 + 𝑱𝑪𝒊 𝝏𝜺𝑰𝑰 𝑪𝒊𝑰𝑰 𝝏𝒕 = − 𝝏𝜺𝑰𝑰 𝑪!𝑰𝑰 𝝏𝒕 − 𝑱𝑪𝒊 (7)
where 𝐶!! is the total concentration of an ion or chemical species i in solution (mol.L-1), and !!!! !!!!
!" is the source-term depending of the sorbed concentration 𝐶!!! of the ion inside the grain
(mol.L-1).
Transport in zone I is calculated according to
𝐿(𝑪𝒊𝑰) = ∇ · 𝐷 · ∇ 𝑪 𝒊 𝑰− 𝑈 𝑪
𝒊
𝑰 (8)
where 𝑈 is the Darcy (linear flow) velocity and D is the diffusion/dispersion coefficient,
𝐷 = 𝐷eI+ 𝛼 𝑈 (9)
with 𝐷eI (m2·s−1) being the effective diffusion coefficient, and α (m) the dispersivity
coefficient of the medium. The axial dispersivity coefficient of the zone I is the ratio of the height of the column and the dispersion Péclet number:
𝛼 =𝐻
𝑃! (10)
The diffusive term between zone I and zone II is expressed as a simple transfer of mass,
𝐽!! = 𝑘! 𝑎! 1 − 𝜀! ( 𝑪𝒊𝑰− 𝑪𝒊𝑰𝑰) (11)
where 𝑘! is the mass transfer coefficient (m·s−1) and 𝑎! (m2·m−3) is the specific exchange
surface between the two zones, in this case, the volumetric specific surface of an adsorbent grain. The mass transfer coefficient depends on the effective diffusion coefficient in zone II (the grains):
𝑘! =
𝐷!!!
where δ (m) is the characteristic distance between the surface of the grain and the sorption sites.
The reactive transport code Optipur [15] solves this system of equations sequentially and iteratively. There is a partial decoupling of the chemistry and transport equations. Within a single time-step, there is a cycle of iterations between transport and chemistry until convergence is reached. Optipur can handle two interfaces or populations of grains, and a diffusion term 𝐽!! was calculated for each. The spherical core model of the grain given in Fig.
3 is not explicitly implemented in the code, but it is modeled as two interfaces or populations of grains.
All chemical reactions (including cation exchange) were calculated at thermodynamic equilibrium without any kinetics using the EQ3/6 thermodynamic database [23]. That is to say kinetics of exchange was introduced through the diffusive term 𝐽!! only. The full ion exchange
mechanisms in S202 (Na-K-Cs-Ca-Mg) and the corresponding dataset of exchange coefficients were then taken into account thanks to the previous results detailed elsewhere [11]. The most important exchange reaction in this system was the exchange of a cesium ion from the solution with a potassium ion from the ferrocyanate:
𝐶𝑠!+ 𝐾! → 𝐶𝑠!+ 𝐾! (13)
but the competitive effect of Ca2+ and Mg2+ present in the freshwater were also considered in this database, and then in the present modeling.
4 Results and discussion
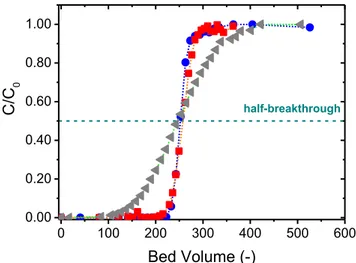
4.1 Influence of the bed height
very close to the theoretical value. This means that although the bed is quite shallow, diffusion in the material is fast enough that the maximum efficiency of the column is achieved. The amount of Cs extracted by the bed (0.183 meq·g−1, the integrated area above the breakthrough curve) is within the experimental uncertainty of the maximum extraction capacity of the S202 material in freshwater (0.180 meq·g−1) [11]. With a 2 cm bed height,
breakthrough begins well before reaching the half-breakthrough volume. Nonetheless, the breakthrough curve intersects the one obtained with a 5 cm bed height at C/C0 = 0.50,
indicating that the material extracts the same amount of Cs+. When the bed height is reduced to 0.39 cm, the curve becomes more spread out and breakthrough begins at just 50 times the bed volume. Still however, the breakthrough curve intersects the two others at C/C0 = 0.50,
which means that the material still reaches its maximum Cs adsorption batch capacity (0.180 meq·g−1).
Fig. 4. Breakthrough curves obtained for Sorbmatech® 202 with a 1 cm diameter column, with a Darcy velocity of 2 m·h−1 and bed heights of 5 cm (blue circles, T1), 2 cm (magenta triangles, T3) or
0.39 cm (grey squares, T7). 0 100 200 300 400 500 600 0.00 0.20 0.40 0.60 0.80 1.00 C/C 0 Bed Volume (-) half-breakthrough V1/2 exp theoritical V1/2
4.2 Influence of the Darcy velocity
Fig. 5 shows the breakthrough curves obtained for the four experiments T1 - T4 (Table 2). While the performance of the column is poorer at U = 10 m·h−1 than U = 2 m·h−1 for both
H/D ratios, this decrease is only slight for H/D = 2. Even at the higher Darcy velocity
moreover, breakthrough only begins at 200 times the bed volume and the slope of the curve remains steep, which is satisfactory in view of industrial applications. Indeed, these results show that the material retains its maximal adsorption capacity even at high flow rates.
Fig. 5. Breakthrough curves obtained for Sorbmatech® 202 with a 1 cm diameter column, with an H/D ratio of either 5 (blue circles, T1&T2) or 2 (red squares, T3&T4) and a Darcy velocity of 2 m·h−1
(filled symbols T1&T3) or 10 m·h−1 (empty, T2 & T4).
4.3 Influence of the column diameter
Wider columns have better hydrodynamics because edge effects become negligible. Fig. 6 shows the breakthrough curves obtained for experiments T1, T5 and T6 (Table 2). Decreasing the diameter of the column from 2.5 to 1 cm has almost no effect on the corresponding breakthrough curves when the bed height and Darcy velocity are kept fixed at 5 cm and 2 cm·h−1, respectively (T6 and T1). This confirms that edge effects are negligible for D = 1 cm and, because there is no evidence of any preferential paths, that the distribution
0 100 200 300 400 500 600 0.00 0.20 0.40 0.60 0.80 1.00 Bed Volume (-) C/C 0 half-breakthrough
column is increased but the bed volume is conserved (T5, bed height 0.8 cm instead of 5 cm to obtained the same bed volume of 3.9 mL), breakthrough occurs much sooner, indicating that an H/D ratio of 0.32 is too low to ensure balanced exchange throughout the column.
Fig. 6. Breakthrough curves obtained for Sorbmatech® 202 with a Darcy velocity of 2 m·h−1 for different bed heights (H) and column diameters (D): blue circles, D = 1 cm, H = 5 cm (T1); red squares, D = 2.5 cm, H = 5 cm (T6); grey triangles, D = 2.5 cm, H = 0.8 cm (T5) (same bed volume as
D = 1 cm, H = 5 cm).
4.4 RTD experiments and modeling
Fig. 7 shows the RTDs measured for this system, plotted as a function of reduced time (𝑡! =!!), alongside the best-fit models of these data obtained as described in section 3.2. These
fits yield values for the Péclet number and the total porosity of the column as a function of the Darcy velocity (Table 3).
0 100 200 300 400 500 600 0.00 0.20 0.40 0.60 0.80 1.00 C/C 0 Bed Volume (-) half-breakthrough
0 5 10 15 20 0.000 0.025 0.050 0.075 0.100 0.125 Exp Equation 2 m/h 10 m/h D=2.5 cm, 2 m/h E(t) reduced time
Fig. 7. Residence time distributions plotted as a function of reduced time, i.e. the actual time divided by the ideal residence time under continuous flow τ, for columns (1 cm in diameter D unless specified) packed with Sorbmatech® 202 at the Darcy velocities of 2 and 10 m/h. The dashed lines are the best fits to the experimental data obtained with the model described in section 3.2 (Eq. 5).
The mean residence times calculated using Eq. 4 are roughly 10 % longer than the ideal residence time under continuous flow 𝜏. This is probably related to some delay of the RTD tracer due to diffusion inside the grains, process not explicitly taken into account by Eq. (5). Nonetheless, this difference of 10 % was deemed negligible and 𝑡!was taken to be equal to 𝜏.
Table 3
Parameters obtained by adjusting the hydrodynamic model of the system so that it reproduced the experimental residence time distributions.
Tests 𝒕𝒔 (s) 𝝉 (s) ε Pe α (m)
T1 60 54 0.60 25 2.0 × 10⁻³
T2 11 7 0.40 10 5.0 × 10⁻³
T6 95 73 0.60 15 3.3 × 10⁻³
𝒕𝒔, mean residence time; 𝜏, ideal residence time under continuous flow; ε, total porosity of the column; Pe,
number with respect to Darcy velocities between 2 and 10 m/h (the fitting procedure was not highly accurate due to the rather reduced set of experimental data). The axial dispersivity coefficient slightly varies with the Darcy velocity but remains close to 10−3 m.
4.5 Modeling reactive transport in the column
4.5.1 Measured and fitted input parameters
Tables 4 and 5 list the parameters that were used as inputs for the model. Most of the parameters of Table 4 were measured directly, except dispersivity and bed porosity that were fitted from the RTDs (section 4.4).
Table 4
Fixed parameters in the model used to reproduce the breakthrough curves measured in experiments T1, T2 and T4 (Table 2). H/D = 2 H/D = 5 Source Experiment (Table 2) T4 T1 T2 U (m·h−1) 10 2 10 Experiments, Table 2 α (m) 2×10⁻³ 1×10⁻³ 2×10⁻³ Fits of RTDs, section 4.4(*) 𝐷!!(m2·s−1) 2×10⁻⁹ 2×10⁻⁹ 2×10⁻⁹ Ref. [24]
Bed porosity 𝜀I 0.40 0.60 0.40 Fits of RTDs, section 4.4(*)
Grain porosity 𝜀!! 0.17 0.17 0.17 Ref. [11]
U, Darcy velocity; α, dispersivity coefficient; 𝐷!!, effective diffusion coefficient in zone I (the bed);
RTD, retention time distribution. (*) T4 parameters assumed to be identical to the fitted T2 ones, both tests having the same Darcy velocity.
The effective diffusion coefficient in zone I, 𝐷eI, for inter-grain diffusion, was set to the mean of the diffusion coefficients of Cs+ and K+ in water, namely 2×10⁻⁹ m2·s−1. The adjustable parameters listed in Table 5 were obtained so that the simulated breakthrough
curve matched the one measured for experiment T4 (Table 2). These parameters were then kept fixed to calculate the curves corresponding to experiments T1 and T2.
Two sets of adjustable parameters in the model were derived from the breakthrough curve of Cs. The first set was the volumetric specific surface area of the grains and the relative proportions of the two populations (Table 5). Relying upon the conceptual model depicted in Fig. 3, these parameters correspond to a spherical particle with a diameter of 83 µm (𝑎! = !!
!), distributed in an inner sphere of 58 µm in diameter (35 % of the total volume)
and an outer shell of 24 µm thick (65 %). The overall diameter of the sphere is rather low compared to average size of the S202 grains. This is partly explained by the fact that the grain shape is roughly octahedral with narrower peaks and that the sorption sites are probably more localized at the periphery of the grains than in the core (whereas the model assumes a homogeneous distribution within the grain).
The second set is the mass transfer coefficients reported in Table 5. The outer shell is linked to a transfer (km = 6×10⁻⁵m.s-1) one order of magnitude higher than the inner sphere (km =
4×10⁻⁶ m.s-1). The effective diffusive coefficient 𝐷!!! was not directly used as a model parameter but could be calculated from Eq. 12 for checking the physical consistency of the parameters of Table 5. The adsorption sites of the outer shell are situated 12 µm from the surface on average, leading to a 𝐷!!! value of 5×10⁻¹⁰ m2.s-1. The 𝐷
!!! value of the inner sphere is about 1×10⁻¹⁰ m2.s-1. Both coefficients are in the upper range reported elsewhere for ion exchange materials, close to material showing fast diffusion/exchange properties as some zeolites [25] and smectites [26].
Table 5
Proportion of adsorption sites (%) 35 65
as (m2.m-3) 7.25×10⁴ 7.25×10⁴
𝒌𝒎 (m·s−1) 4×10⁻⁶ 6×10⁻⁵
as, the volumetric specific area, km mass transfer coefficient.
4.5.2 Modeling of breakthrough curves
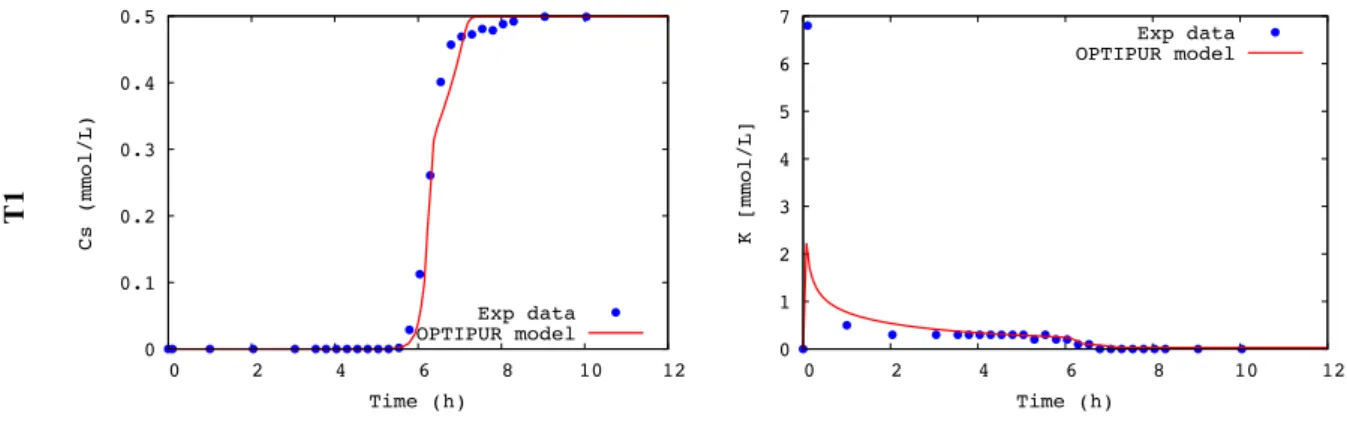
Fig. 8 shows that the breakthrough curves obtained using this model are in good agreement with those measured experimentally for Cs+ and K+, particularly for experiment T4, which was used to adjust the model parameters. Without using diffusive transfer between the zone I and II (black line of T4 in Fig. 8), the calculated breakthrough is very straight and fails to simulate the slight leakage before the front as well as the retardation after the front. The stepwise shape indicates that hydrodynamic dispersion has no effect on the Cs breakthrough curve contrarily to the breakthrough curve of an unreactive species that presents a sigmoidal shape (not shown here). The stiffness is due to the strong sorption (affinity) of Cs on S202. Using a model with an inner sphere and an outer shell allows to closely account for different features of the breakthrough curves. Indeed, the outer shell reproduces the initial part of the breakthrough curve, which is rather straight for T1. This behavior is consistent with the very high rate of sorption kinetics measured in a batch test with S202 grains [11]. The open porosity of S202 grains allows fast diffusion of Cs inside the solid support on the one hand, and the nanosize of the KCuFC particles inserted into this porosity leads to fast diffusion inside the adsorbent on the other hand. However, as correctly simulated by the model, the breakthrough curves are more curved when the Darcy velocity increases (i.e. Cs is no more fully sorbed in the T2 and T4 tests). The inner sphere reproduces the last spreading (retardation) of Cs breakthrough, experimentally observed for all tests. In this model, this is explained by a diffusion becoming slower, the greater the depth is inside the grains.
agreement with the experimental data. The spherical two-zones approach remains a reasonable conceptual model but other explanations may explain the retardation in the breakthrough curves.
Fig. 8 also shows the breakthrough curve of K+ for each experiment. In good agreement with the experimental data, modeling gives an early pulse that results from the competitive exchange of K+ by Ca2+ and Mg2+ cations, the latter being at a relatively high concentration in freshwater compared to the former (Table 1). An intermediate steady-state of aqueous concentration is progressively reached. Eventually, the arrival of the Cs+ breakthrough corresponds to a second steady state where the exchanger is fully occupied by Cs+, and K+ remains at the low freshwater input concentration.
Fig. 9 shows the calculated and measured variations of the Cs+ decontamination factor as a function of time for experiment T4. No signs of premature leakage are observed, even on a logarithmic scale. The model accurately reproduces the initial (high) values of the decontamination factor as well as the gradual decrease of the decontamination efficiency of the column. A correct modeling of the Kd and isotherms of Cs in natural waters had already been obtained with the present chemical dataset [11].
T1 0 0.1 0.2 0.3 0.4 0.5 0 2 4 6 8 10 12 Cs (mmol/L) Time (h) Exp data OPTIPUR model 0 1 2 3 4 5 6 7 0 2 4 6 8 10 12 K [mmol/L] Time (h) Exp data OPTIPUR model
T2
T4
Fig. 8. Comparison of the breakthrough curves for Cs+ (left) and K+ (right) measured in experiments
T1 (H = 5 cm, U = 2 m·h−1), T2 (H = 5 cm, U = 10 m·h−1) and T4 (H = 2 cm, U = 10 m·h−1) for
Sorbmatech® 202 and calculated using the software Optipur based on the model depicted in Figs. 2 and 3.
Fig. 9. Comparison of the decontamination factors measured in experiment T4 (H = 2 cm, U = 10 m·h−1) for Sorbmatech® 202 and calculated using the software Optipur based on the model depicted in Figs. 2 and 3. 0 0.1 0.2 0.3 0.4 0.5 0 1 2 3 Cs (mmol/L) Time (h) Exp data OPTIPUR model 0 1 2 3 4 5 6 7 0 1 2 3 K [mmol/L] Time (h) Exp data OPTIPUR model 0 0.1 0.2 0.3 0.4 0.5 0 1 2 3 Cs (mmol/L) Time (h) Exp data OPTIPUR model no grain diffusion 0 1 2 3 4 5 6 7 0 1 2 3 K [mmol/L] Time (h) Exp data OPTIPUR model no grain diffusion
5 Conclusions
This study shows that Sorbmatech® 202 performs very well as an adsorbent for the column decontamination of Cs-containing effluents. Ideal breakthrough curves were measured with a sharp saturation front on column exit. Even at high Darcy velocities (10 m·h−1), no diffusion front was observed as shown by a saturation front still sharp. Regarding the H/D ratio of the column, the lower limit for good sorption throughout the bed was found to be 2. For H/D = 5, near-identical sharp saturation fronts were observed at Darcy velocities of 2 and 10 m·h−1, indicating that the material retains its maximum adsorption capacity at high flow rates. No premature leakage occurred, which means that all the adsorption capacity of Sorbmatech® 202 is exploitable. The open porosity of S202 grains allows a fast diffusion of Cs inside the grains whereas the nanosize of the KCuFC particles inserted into this porosity leads to fast diffusion inside the adsorbent. The decontamination process was found to be very selective for Cs+ in freshwater with respect to competing cations.
In the mixed bed model used to calculate breakthrough curves using the Optipur code, the S202 grains were represented by an inner sphere and an outer shell. The number of adsorption sites and the diffusion coefficients in these two regions was adjusted by assigning a specific mass transfer coefficient to each one. This improved the modeling of Cs diffusion within the grains and the agreement between the experimental and simulated breakthrough curves. Since these experiments were performed with Cs+ concentrations far higher than those typically found in radioactive effluents, the good agreement between the measured and simulated decontamination factors will have to be confirmed for experiments with 137 Cs-doped freshwater.
open-environment). This behavior and the accuracy of the model developed in this study remain to be confirmed on a pilot scale.
Acknowledgments
The authors are grateful for funding from the French “Programme d’Investissements d’Avenir” (ANR-11-RSNR-0005- DEMETERRES project) and AREVA, and acknowledge their colleague Jérémy Mascarade (CEA) for useful discussions on the RTD and breakthrough curves.
References
[1] C. Loos-Neskovic, M. Fedoroff, Fixation mechanims of cesium on Nickel and Zinc Ferrocyanides, Solvent Extraction and Ion Exchange 7 (1989) 131-158.
[2] P.A. Haas, A Review of Information on Ferrocyanide Solids for Removal of Cesium from Solutions, Separation Science and Technology 28 (1993) 2479-2506.
[3] Y. Qing, J. Li, B. Kang, S. Chang, Y. Dai, Q. Long, C. Yuan, Selective sorption mechanism of Cs+ on potassium nickel hexacyanoferrate(II) compounds, Journal of Radioanalytical and Nuclear Chemistry 304 (2015) 527-533.
[4] C. Delchet, A. Tokarev, X. Dumail, G. Toquer, Y. Barre, Y. Guari, C. Guerin, J. Larionova, A. Grandjean, Extraction of radioactive cesium using innovative functionalized porous materials, RSC Advances 2 (2012) 5707-5716.
[5] K. Kawatake, N. Shigemoto, Preparation of potassium iron(III) hexacyanoferrate(II) supported on activated carbon and Cs uptake performance of the adsorbent, Journal of Nuclear Science and Technology 49 (2012) 1048-1056.
[6] R. Turgis, G. Arrachart, C. Delchet, C. Rey, Y. Barré, S. Pellet-Rostaing, Y. Guari, J. Larionova, A. Grandjean, An Original “Click and Bind” Approach for Immobilizing Copper Hexacyanoferrate Nanoparticles on Mesoporous Silica, Chemistry of Materials 25 (2013) 4447-4453.
[7] C. Vincent, A. Hertz, T. Vincent, Y. Barré, E. Guibal, Immobilization of inorganic ion-exchanger into biopolymer foams – Application to cesium sorption, Chemical Engineering Journal 236 (2014) 202-211.
[8] A. Egorin, E. Tokar, L. Zemskova, Chitosan-ferrocyanide sorbent for Cs-137 removal from mineralized alkaline media, Radiochimica Acta 104 (2016) 657-661.
[9] H.K. Lee, D.S. Yang, W. Oh, S.J. Choi, Copper Ferrocyanide Functionalized Core-Shell Magnetic Silica Composites for the Selective Removal of Cesium Ions from Radioactive Liquid Waste, J. Nanosci. Nanotechnol. 16 (2016) 6223-6230.
[10] A. Sommer-Marquez, C. Mansas, N. Talha, C. Rey, J. Causse, Reinforced silica monoliths functionalised with metal hexacyanoferrates for cesium decontamination: a combination of a one-pot procedure and skeleton calcination, RSC Advances 6 (2016) 73475-73484.
[11] C. Michel, Y. Barré, L. De Windt, C. de Dieuleveult, E. Brackx, A. Grandjean, Ion exchange and structural properties of a new cyanoferrate mesoporous silica material for Cs removal from natural saline waters, Journal of Environmental Chemical Engineering 5 (2017) 810-817.
[12] C. Michel, Y. Barre, C. de Dieuleveult, A. Grandjean, L. De Windt, Cs ion exchange by a potassium nickel hexacyanoferrate loaded on a granular support, Chemical Engineering Science 137 (2015) 904-913.
[13] Z. Chen, Y. Wu, Y. Wei, H. Mimura, Preparation of silica-based titanate adsorbents and application for strontium removal from radioactive contaminated wastewater, Journal of Radioanalytical and Nuclear Chemistry 307 (2016) 931-940.
[14] Y. Wu, X.X. Zhang, Y.Z. Wei, H. Mimura, Development of adsorption and solidification process for decontamination of Cs-contaminated radioactive water in Fukushima through silica-based AMP hybrid adsorbent, Separation and Purification Technology 181 (2017) 76-84.
[15] M. Bachet, L. Jauberty, L. De Windt, E. Tevissen, C. de Dieuleveult, H. Schneider, Comparison of Mass Transfer Coefficient Approach and Nernst–Planck Formulation in the Reactive Transport Modeling of Co, Ni, and Ag Removal by Mixed-Bed Ion-Exchange Resins, Industrial & Engineering
[16] S. Brunauer, P.H. Emmett, E. Teller, Adsorption of Gases in Multimolecular Layers, Journal of the American Chemical Society 60 (1938) 309-319.
[17] E.P. Barrett, L.G. Joyner, P.P. Halenda, The Determination of Pore Volume and Area Distributions in Porous Substances. I. Computations from Nitrogen Isotherms, Journal of the American Chemical Society 73 (1951) 373-380.
[18] A.M. Ribeiro, P. Neto, C. Pinho, Mean Porosity and Pressure Drop Measurements in Packed Beds of Monosized Spheres: Side Wall Effects, International Review of Chemical Engineering - Rapid Communicati;Jan2010, Vol. 2 Issue 1, p40 2 (2010) 40.
[19] S. Ayrault, B. Jimenez, E. Garnier, M. Fedoroff, D. J. Jones, C. Loos-Neskovic, Sorption mechanisms of cesium on CuII2FeII(CN)6 and CuII3[FeIII(CN)6]2 hexacyanoferrates and their relation to the crystalline structure, J. Solid State Chem. 141 (1998) 475.
[20] A. Grandjean, C. Delchet, J. Causse, Y. Barre, Y. Guari, J. Larionova, Effect of the chemical nature of different transition metal ferrocyanides to entrap Cs, Journal of Radioanalytical and Nuclear Chemistry 307 (2016) 427-436.
[21] T. Vermeulen, M.D. LeVan, N.K. Hiester, G. Klein, Adsorption and Ion Exchange, in: McGraw-Hill (Ed.) Perry's Chemical Engineers' Handbook - Sixth Edition1984.
[22] O. Levenspiel, Chemical reaction engineering, 2 ed., John Wiley & Sons, Oregon State University, 1972.
[23] T.J. Wolery, EQ3/6: A Sof tware Package for Geochemical Modeling of Aqueous Systems: Package Overview and Installation Guide (version 7.0), UCRL-MA-110662 PT I, Lawrence Livermore National Laboratory, CA, 1992.
[24] S. Nakashima, Diffusivity of ions in pore water as a quantitative basis for rock deformation rate estimates, Tectonophysics 245 (1995) 185-203.
[25] J. Mon, Y. Deng, M. Flury, J.B. Harsh, Cesium incorporation and diffusion in cancrinite, sodalite, zeolite, and allophane, Microporous and Mesoporous Materials 86 (2005) 277-286.
[26] Y. Tachi, K. Yotsuji, Diffusion and sorption of Cs+, Na+, I− and HTO in compacted sodium montmorillonite as a function of porewater salinity: Integrated sorption and diffusion model,