Science Arts & Métiers (SAM)
is an open access repository that collects the work of Arts et Métiers Institute of
Technology researchers and makes it freely available over the web where possible.
This is an author-deposited version published in: https://sam.ensam.eu Handle ID: .http://hdl.handle.net/10985/12237
To cite this version :
Guillaume MALVAULT, Azita AHMADI-SENICHAULT, Aziz OMARI - Numerical Simulation of Yield Stress Fluid Flow in Capillary Bundles: Influence of the Form and the Axial Variation in the Cross Section - Transport in porous media - Vol. 120, n°2, p.255-270 - 2017
Any correspondence concerning this service should be sent to the repository Administrator : archiveouverte@ensam.eu
Science Arts & Métiers (SAM)
is an open access repository that collects the work of Arts et Métiers ParisTech
researchers and makes it freely available over the web where possible.
This is an author-deposited version published in: http://sam.ensam.eu Handle ID: .http://hdl.handle.net/null
To cite this version :
Guillaume MALVAULT, Azita AHMADI, Abdelaziz OMARI - Numerical Simulation of Yield Stress Fluid Flow in Capillary Bundles: Influence of the Form and the Axial Variation in the Cross Section - Transpo p.16p - 2017
Any correspondence concerning this service should be sent to the repository Administrator : archiveouverte@ensam.eu
Numerical Simulation of Yield Stress Fluid Flow in
Capillary Bundles: Influence of the Form and the Axial
Variation in the Cross Section
G. Malvault1 · A. Ahmadi1 · A. Omari1,2
Abstract In this paper, we investigate possible improvements that can be made to the bundle
of capillaries model in order to better represent the flow of yield stress fluids through porous media. This was examined by performing extensive and progressive numerical simulations and by introducing the non-circularity of channels’ cross section and/or its variability along the channels’ axis. It is shown that if only the non-circularity of channels’ cross section is taken into account, a moderate influence is observed on both critical pressure gradient for the flow onset and the flow rate/pressure gradient Q(∇ P) relationship. However, the axial variation in capillaries’ cross section has proved to be more impacting the computed flow rate/pressure gradient data. We show hence that when available pore throat and pore body size distributions are used to construct the bundle of axially varying capillaries, the obtained Q(∇ P) data do fit well experimental results corresponding to the flow of a Bingham-like fluid through a bed of randomly packed mono-sized spheres.
Keywords Numerical simulation · Yield stress fluid · Bundle of capillaries · Flow onset ·
Non-circular cross section · Axially varying cross section
1 Introduction
Many industrial processes involve flows of yield stress fluids (YSF) such as paints, polymers and drilling muds. In some situations, such yield stress fluid flow in complex geometries like porous media for which additional complexity arises from the pore geometry, pore connectivity and flow pathway tortuosity.
B
A. Ahmadia.ahmadi@i2m.u-bordeaux1.fr
1 I2M-TREFLE UMR CNRS, Arts et Métiers Paris-Tech, Esplanade des Arts et Métiers, 33405 Talence Cedex, France
2 I2M-TREFLE UMR CNRS, Bordeaux-INP, Esplanade des Arts et Métiers, 33405 Talence Cedex, France
0
Various “core flood” in silico unidirectional flow experiments of YSF in porous media show that the flow process at low pressure drop does begin by fluid flow through isolated paths having a mean direction parallel to the macroscopic flow. At higher pressure drops, additional new paths of the same type are incorporated to the overall flow before connection between them occurs at high flow rates (Talon and Bauer 2013; Chevalier and Talon 2015a, b). Therefore, to model fluid displacement in such complex geometries, porous media have initially been greatly simplified and represented as a bundle of capillaries of circular cross section of the same radius (Scheidegger 1974). By solving creeping flow of a Newtonian fluid in this crude model and matching the Darcy’s law and the Poiseuille relationship in the bundle, the permeability, K , the porosity, ε, and the capillary radius, R, are then found to be linked through K = R2ε/8.
This model was later improved by assigning a probability density function p(r ) of a given form to every pore radius r . In that case, the relationship here above becomes K = (M4/M2)(ε/8), where Mi =
( ∞
r i p(r )dr (Scheidegger 1974; Dullien 1992). When the capillaries are randomly oriented, to take into account the tortuosity, this relationship is conserved and only a prefactor appears (Saffman 1959). In any way and as the analytic solution of creeping flow of YSF in a capillary of circular cross section exists, one can derive a formula that relates the flow rate and the pressure gradient along the porous medium in one-dimensional configuration (see Eq. 4 below). It has been shown that one can therefore obtain a representative pore radius distribution of a given porous medium from experimental data relating flow rate to pressure gradient Q(∇ P) (Ambari et al. 1990). The experimental feasibility of this method (called yield stress method or YSM) was investigated by several authors using various YSF and porous media (Malvault 2013; Rodriguez de Castro et al. 2014; Oukhlef et al. 2014; Rodriguez de Castro et al. 2016). Moreover, the bundle of cap- illaries model is often used to exploit data coming from capillary pressure measurements using mercury injection experiments. However, Rodriguez de Castro et al. (2014, 2016) have shown that pore radius distributions obtained from Q(∇ P) measurements for YSF flow and those deduced from mercury injection experiments do not rigorously coincide. Although the different physical mechanisms involved were considered as the main cause of these dis- crepancies, the classical bundle of capillaries model itself was also considered as a drawback of the YSM method. For a better description of the actual topology of the pore space, some improvements have been proposed in the literature.
The first kind of improvement consisted in considering other forms of pore cross section rather than a circular one. Huilgol (2006) studied the YSF flow in pipes of various cross- sectional geometries by focusing on the onset of the flow on the basis of the pioneering work of Mosolov and Miasnikov (1965) who were the first to theoretically consider such a problem. They showed that both the form and the extent of dead zones where no flow occurs are dependent on the yield stress value and the exact form of the cross section. Their results were also shown to be in quantitative accordance with direct numerical simulation results of
Saramito and Roquet (2001). More recently, Letelier et al. (2017) have reconsidered such a problem by solving the equation of motion in straight tubes with any cross-sectional form by using a new analytical method they called the shape factor method. On the other hand and as no analytic solution of creeping flow of YSF in a capillary of non-circular cross section exists, Liu and Hong (1988) have proposed empirical flow rate/pressure gradient q (∇ P) relationships for a YSF obeying the Herschel–Bulkley (H–B) law flowing in a single pipe by fitting numerical simulation results obtained for square, triangle, tear drop and slit cross sections. It should be noted that throughout the text, small letter q refers to flow rate in a single capillary while the capital letter Q stands for flow rate through a whole bundle.
To go further and as besides the form of the cross section, pore constrictions are expected to play an important role in transport phenomena through natural porous media; alternating pore body–pore throat sections were considered by several authors (Burgos and Alexandrou 1999;
Jay et al. 2002; Roustaei and Frigaard 2013). Roustaei and Frigaard (2013) solved numerically the motion equations for a Bingham fluid flowing through “wavy walled,” “rectangularly walled” and “triangularly walled” capillaries with circular cross section. Their work was restricted to the study the onset and the extent of dead zones depending on the geometrical characteristics and the Bingham number value. As no experimental data were available, no comparison was performed and their discussions were only qualitative.
In the last decades, other research efforts were devoted to describe the flow of YSF through complex geometries that are believed to closely mimic real porous media taking advantage of growing computer facilities and decreasing calculation cost. Talon and Bauer
(2013) have considered the flow of Bingham fluids in 2D porous media that are stochastically generated and where the flow was obtained by solving Stokes equation using a particular lattice Boltzmann method. This allowed them to obtain a generalized Darcy’s law. For a similar purpose, other authors have considered 2D model porous medium of a diamond-like structure with a random distribution of pore throats (Chevalier and Talon 2015a, b). Beside the generalized Darcy law, more attention was paid to the evolution of characteristic sizes of non-flowing zones versus the applied macroscopic pressure gradient. These zones were found somehow self-similar with scaling parameters that seem to be universal. More or less sophisticated network models are therefore now extensively used in that respect. In these models, pore bodies are connected through straight pore throats with a specified value of the coordination number forming a 3D network while supposing that the pressure drop in porous media is solely due to pore throats (Dullien 1992).
Sochi and Blunt (2008) used X-ray tomography to extract 3D images of a sand pack. Representative forms (circular, triangular and square) of pore throat cross section were then recognized, counted and measured as well as the pore connectivity. The flow of Newtonian fluids was then solved in each pore throat, and a specific conductance to which corresponds a hydraulic radius is obtained. So they finally consider a network of circular pore throats of such various hydraulic radii connected via pore bodies. Experiments were then performed using polymethylcellulose solutions whose rheology was shown to be well described by the H–B law. These polymer solutions were injected in the original sand pack and the overall pressure drop as a function of the flow rate was measured and the obtained results were then compared with simulation results. They found that the experimentally observed pressure gradient needed to start the flow is greater than predicted even if the general form of the Q (∇ P) curves is conserved. The authors attributed the observed discrepancies to physical phenomena such as polymer adsorption and precipitation. However, in our opinion, this may also be attributed to the modeling procedure itself mainly through the passage from complex cross-sectional shapes to a circular one.
Similarly, Balhoff and Thompson (2004) have considered a porous medium of randomly packed glass spheres. As before, the pore connectivity and pore throat sizes and lengths were obtained from 3D images extracted from stochastically generated porous media. The pore throats were approached by constricted capillaries of circular cross section, and the cross section was submitted to a homothetic transformation whose ratio varies axially. The variation in such a ratio function was a rectangular function, half an ellipse or half a circle. Their simulation results were compared to experimental data of Chase and Dachavijit (2003) who had performed YSF flow experiments through an analogous porous medium. The yield stress fluid used in these experiments was carbopol whose rheology was shown to be roughly approached by a Bingham law. Despite the qualitative agreement between experimental
2
results and numerical simulations, a shift of the minimal pressure gradient characterizing the flow onset was again observed. Arguments put forward to explain the observed discrepancies were the same as previously claimed by Sochi and Blunt (2008).
In the present paper, simulations of YSF flow in the bundle of capillaries are reconsidered by taking into account the non-circularity of the cross section as well as its axial variation. So in the next part more details on the principal approaches considered above will be given, before exposing our simulation method. The part 3 is devoted to the presentation and discussion of our results and their confrontation with available numerical results obtained by other authors. Simulation results expressed in terms of Q (∇ P) or Darcy’s velocity will also be compared to both other numerical simulations and those coming from laboratory experiments. The paper will end with some concluding remarks.
2 Simulation Method
In this part, we will present our simulation setup and its validation. However, before doing so, some noteworthy results of the literature are to be highlighted. The rheological behavior of YSF is commonly described using the empirical Herschel–Bulkley law relating the stress tensor τ¯ to the rate of deformation tensor D¯ as
n−1 τ0 l ¯ τ¯ = 2k I ID + √ I ID D¯ → if I Iτ > τ0 (1) D¯ = 0 → if I Iτ ≤ τ0
where I Iτ and I ID are, respectively, the second invariant of τ¯ and the symmetrical part of the
velocity gradient tensor: D¯ = 1 U + T ∇U , τ
0 is the yield stress, k is the consistency
2 ∇ � �
and n is the fluidity index. Obviously, this model encompasses the Bingham model for n = 1.
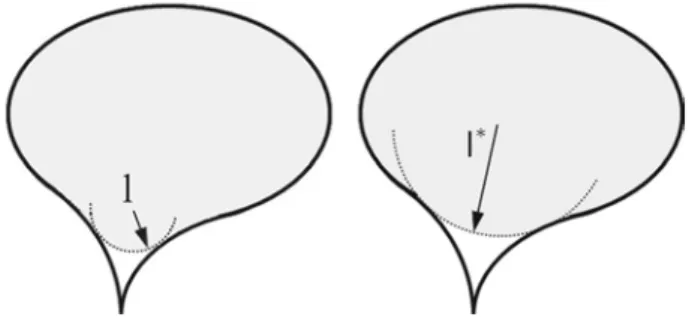
Mosolov and Miasnikov (1965, 1967) have considered in an early pioneering work the onset of the flow of a YSF in a capillary of constant cross section of arbitrary form. For that purpose, they solved an energy balance equation for an imposed external pressure gradient ∇ P. They showed that the flow zones are such that their curvature radii are everywhere greater than a threshold value l∗ that depends only on the contour of the involved cross section and is given by
l∗ = sup (
A(l) \
P (l) (2)
where A(l) and P(l) are, respectively, the area and the perimeter of the largest enclosed region whose contour has a minimal curvature radius of l (Fig. 1), l being the radius of curvature of the concave zone toward the no-flowing zone. Therefore, the flow will take place when the following requirement is satisfied:
∇ P > τ0/ l∗ (3)
Therefore, there exist a central flow zone composed of an inner plug region and a sheared zone. For angular cross sections, this flow zone is connected to the solid wall through a no- flowing zone. Instead of this theoretical approach, Saramito and Roquet (2001) have solved the equations of motion for a Bingham fluid in a square cross section using a finite element method. They showed how the radius of curvature l depends on the applied pressure gradient and they then numerically deduced the value of l∗. Huilgol (2006) has taken over the original work of Mosolov and Miasnikov (1965) and applied it for cross sections having at least one symmetry axis. Their results are summarized in Table 1, where l∗ is given for the cases of
Fig. 1 Thresholding the contour by the curvature l, defining A(l), in gray, and its contour P(l). The flow
zone contour at the onset is given by the maximum value of A(l)/ P(l)
Table 1 Characteristic length of flows for different shapes of cross section (Mosolov and Miasnikov 1965;
Huilgol 2006)
square and equilateral triangle cross sections having the same hydraulic diameter and where l∗ for a circular cross section is also given for comparison.
Moreover, knowing the geometrical characteristics of no-flowing region, it is possible to determine the fluid flow rate under a specified pressure gradient through a capillary of a given cross section. However, it is worth noting that no analytical relationship is yet available in these cases and only calculation for a circular cross section is easily tractable and numerical simulations are otherwise needed. For validation purposes, we recall that the q (∇ P) analytic relationship for a H–B fluid flowing in a pipe of circular cross section of radius r is given by (Skelland 1967): r for ∇ P > 2 τ0 → n π (r ∇ P − 2τ 0)1+ n l (r ∇ P −2 τ0 ) 4 0 ) τ 0 (r ∇ P −2 τ (2 τ 0 ) l q (∇ P) = r ∇ P3 (2k)1/n 1 2 3n+1 + 2n+1 + n+12 for ∇ P ≤ 2τ0/r → 0 (4)
min
2.1 Numerical Setup
The following Stokes equation for creeping flow expressed in terms of stress is solved within the considered geometry:
∇.τ¯ − ∇ p = 0 (5)
where p is the absolute pressure at the local scale. The fluid is considered incompressible satisfying
∇.U� = 0 (6)
U� being the velocity vector. In Eq. 5, the stress tensor is related to the deformation rate tensor through the H–B law given by Eq. 1.
A no-slip boundary condition is imposed at the solid wall of the channel (U� = O� ), and the inlet and outlet velocities are assumed to be normal to the cross sections of the computation domain U · n� = 0 . For simulating the flow in a channel with periodic
∇ �
constrictions, two different types of boundary conditions (periodic and non-periodic) are considered and compared over one period denoted λ . The non-periodic conditions correspond to imposing a uniform pressure at the entry (z = 0) and the exit (z = λ) sections. For the periodic boundary conditions, the pressure is replaced by the sum of an average pressure and a deviation. Periodic boundary conditions are imposed on the pressure deviation and on the velocity, and the gradient of the average pressure is considered as a source term. Moreover, for the sake of decreasing computation time, another option is to consider uniform pressure boundary conditions for a simulation on a domain corresponding to half of a period. Under the condition of creeping flow imposed in this work, the three options were found to give identical results. Therefore, the last option has been adopted.
To solve the equations above, the numerical scheme PARDISO (Schenk and Gartner 2004) is adopted using the commercial Comsol ® (version 4.3) software and each calculation was stopped when the relative variation in the velocity field between two successive iterations of refinement was less than 10−6. Whatever the cross section considered, the size of the domain is such that the inscribed circle (or hydraulic diameter 2a in Table 1) is taken as unity and calculation was restricted to the smallest possible part of the domain owing to its symmetry. For axisymmetric cases, the 2D grids are triangular or rectangular, while for the 3D cases tetrahedral cells are used. Different mesh sizes were tested, and the obtained numerical solutions were shown to become insensitive to the mesh size when cell size reaches a(z)/50, z being the axial position. Moreover, a cell refinement was performed in the vicinity of maximal ∇√I ID , i.e., between dead zones and plug flow zones. In our model, the
modified biviscous law has been used to define the viscosity of the fluid: μ = kγ˙ n−1 +
(
τ0 − kγ˙ n
)
max (γ˙ , γ˙min)
where γ˙ is the locally computed strain rate and γ˙min is a fixed value of strain rate to avoid
divergence. After a sensitivity analysis, the value of 10−8 has been adopted for our simula-tions.
In a first step, the creeping flow of a YSF in straight channels with constant non-circular cross sections, namely square or triangular, is considered.
2.2 Validation of the Simulation Method
As the analytic solution is well known in case of the flow of a Bingham fluid in a capillary of constant circular cross section, simulation results are compared with such analytic solutions.
k
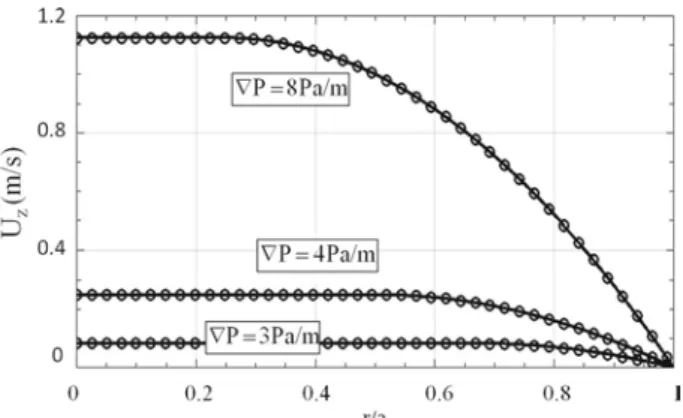
Fig. 2 Velocity profiles for a Bingham fluid (τ0 = 1 Pa, k = 1 Pa s) in a circular capillary of constant cross
section at various pressure gradients (line analytic, symbols simulation)
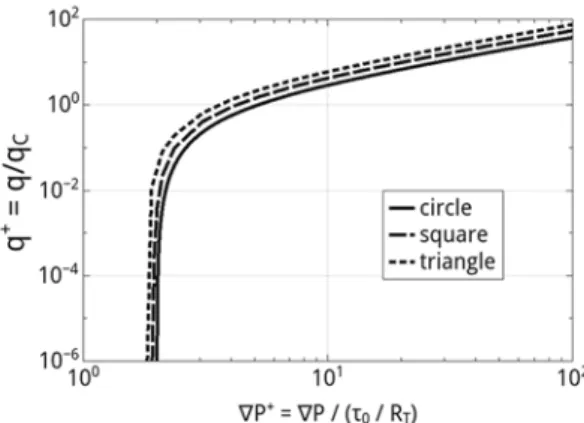
Fig. 3 Comparison with the literature: dimensionless flow rate versus dimensionless pressure gradient in
capillaries of constant cross section for fluids with different rheological behaviors
In Fig. 2, the obtained velocity profiles are plotted together with the analytical ones, showing an excellent accordance between them with a relative error less than 10−3.
Moreover, from both velocity and shear stress fields, the characteristic length of the dead zone is determined in case of square and triangular cross sections following Saramito and Roquet (2001) and is found to be the same with at most 2% of error as those theoretically predicted and is listed in Table 1. Moreover, the flow rate/pressure gradient relationship is depicted in Fig. 3, where numerical data from Liu and Hong (1988) (H–B fluid with n = 0.9, k = 1 Pa s0.9 and τ0 = 1 Pa) and Saramito and Roquet (2001) (Bingham fluid with
k = 1 Pa s and τ0 = 1 Pa) are also plotted for comparison. In this figure, q+ represents the
dimensionless flow rate q+ = q/qC with qC = a3
( τ
0 )1/n and ∇ P+ = ∇ P/ (τ
0/a) is the
dimensionless pressure gradient and a good agreement between our results and some data available in the literature is noticed.
Following the definition of Burgos and Alexandrou (1999), the Bingham number ranges here from 2 × 10⁻² to 50 typically.
These results validate the ability of our simulation method to describe the flow of YSF through capillaries of constant non-circular cross sections. Based on this, we performed numerical simulations of flow of YSF through capillaries of cross sections of different forms,
∇
but whose area does vary along the mean flow axis. Both representative onset characteristic length l∗ and the variation of q+ versus ∇ P+are examined. It should be noted that in the discussions, the dimensionless onset characteristic length given by l+ = l∗/RT will be used.
Furthermore, as the main scope of this paper is to examine how a bundle of capillaries of such complex shapes can be well representative of real porous media, the flow of YSF through a bundle of capillaries whose characteristic sizes follow a given distribution will be considered in the next section. Obtained results will be then compared to experimental data available in the literature and discussed.
3 Results and Discussions
In this part, results for isolated straight capillaries with varying cross sections along the mean flow axis are first presented. In each case, the flow onset characteristic length l∗ and the dependency of q+versus ∇ P+ are evaluated. This will be performed for a Bingham fluid. Then, a bundle of each sort of the capillaries will be considered in order to model a real porous medium. The obtained results will be compared in a first step to some available results of the literature, and in a second step they will be compared to results coming from experiments performed on actual porous media using a given yield stress fluid.
3.1 Yield Stress Fluid Flows in Single Straight Capillaries
3.1.1 Capillaries of Constant Cross Section
In this subsection, first efforts are focused on the investigation of the possible changes of the flow behavior induced by a modification of the cross-sectional form in comparison with the case of circular cross section. In these calculations, the inscribed circle was the same in each case, fluid characteristics were τ0 = 1 Pa, n = 1 and k = 1 Pa s, and the data are presented
in terms of q+ versus ∇ P+. The obtained results are depicted in Fig. 4 in which RT should
be, for the moment, considered equal to a.
The shape of the q+ ( P+) curves remains similar relative to the circular case, and the non-circularity impacts mainly the absolute values. In each case, the curves approach a vertical asymptotic behavior at low ∇ P+, toward the onset pressure gradient. Taking such a threshold pressure gradient to correspond to q+ = 10−6 yields the value of ∇ P+ corresponding to the onset of the flow which will be denoted ∇ P∗. For triangular, square, and circular cross
Fig. 4 Dimensionless flow rate
versus dimensionless pressure gradient for a Bingham fluid flow in capillaries of constant cross section (τ0 = 1 Pa, k = 1 Pa s)
l+ (theoretical) 0.5000 0.5302 0.5626
l+ (present work) 0.4902 0.5208 0.5525
Relative difference (%) 2.0 1.8 0.8
∇
∇
Table 2 Dimensionless onset Cross section Circular Square Triangle
characteristic lengths l+for different cross sections
sections, ∇ P∗ is equal to 1.81, 1.92 and 2.04, respectively, showing a smooth decrease from circular to triangular cross sections in accordance with the literature (Huilgol 2006). Related results in terms of the dimensionless onset characteristic length l+ are gathered in Table 2
where relative errors are also indicated.
From Fig. 4, we can see that in the low ∇ P+ regime, the produced flow rate is noticeably different depending on the considered cross-sectional form. For example, at ∇ P+= 2.5, q+ for square and triangular cross sections is, respectively, 3.4 and 11 times the q+ obtained for the circular cross section. At high pressure drop regime, however, such ratios are reduced. For example, at ∇ P+= 25, the ratios of q+ reduce to only 1.7 and 2.7, respectively. It is also interesting to note that for high ∇ P+ regime, q+ is shown to follow a linear law of ∇ P+. This is in agreement with the fact that one expects the data to behave as ( P+)1/n for a power law fluid. Finally, it should be mentioned here that for a given cross-sectional form, the change of τ0 does not affect the shape of these curves, provided that data are plotted in
terms of q+versus ∇ P+. However, as the size and the shape of the flow domain change with the pressure gradient in the case of non-circular cross sections, it is not possible to find a normalization that would exactly merge the three curves into a single one.
3.1.2 Rectilinear Capillaries with Variable Cross Section
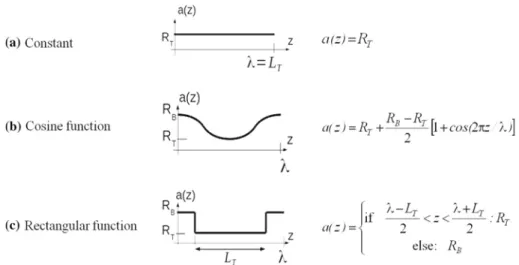
As mentioned above, the exact form of the transverse cross section affects the macroscopic flow characteristic, q+ ( P+). In this paragraph, the influence of the variation in the cross section along the capillary axis is considered and is represented through the variation in the radius of the inscribed circle, a (z) (Fig. 5). For that purpose, both cosine (or wavy) and rectangular functions are studied, and the obtained results are compared to previous ones corresponding to constant a (z). It must be noted that the minimum value of a (z) is denoted RT (throat radius) and will be used for defining dimensionless quantities.
The precise geometrical characteristics are based on the work of Bhattad et al. (2011). These authors, after performing an X-ray tomography analysis of a porous medium made of randomly packed mono-sized spheres, have estimated the size and number density of existing pore bodies and pore throats. For that purpose, they used the technique of enclosed maximum spheres (for pore bodies) and cylinders (for pore throats) to map the pore space. Then, they obtain the pore throat size distribution pT (RT) and the pore body size distribution pB (RB) as
two independent functions as well as pore throat lengths, finding that the most probable ratio h = RB/RT is 1.5. In the case of a variation in the cross section according to a rectangular
function, the pore bodies’ lengths have to be constrained to λ − LT = 2RB because pore
bodies are spherical. The pattern length λ (pore body to pore body distance) was fixed. In the case of the wavy cosine variation in the cross section, λ is set to LT.
In order to determine the value of l∗ for every shape and constriction type, the equation of motion was solved over a geometrical pattern at successively decreasing pressure gradients. Then, the pressure gradient at the onset ∇ P∗ was determined from extrapolation of data to q+ ∼= 0, giving l∗ such that l∗ = τ0/∇ P∗. The corresponding values of the dimensionless
=
∇
Fig. 5 Constriction shapes and their associated function a(z), radius of the largest inscribed circle
Table 3 Dimensionless onset characteristic lengths l+ for different cross sections and constriction shapes (a
none, b cosine function, c rectangular function) Cross-sectional
constriction function
Circular Square Triangle
a b c a b c a b c
l+ (theoretical) 1/2 – – 0.5302 – – 0.5626 – –
l+ (present work) 0.4902 0.4998 0.4896 0.5208 0.5714 0.5770 0.5525 0.5922 0.5885
Relative difference (%) 2.0 0.04 2.1 1.8 7.8 8.8 1.8 5.3 4.6
Theoretical values are used for the calculation of the relative difference. Results are given here for h RB RT 1.5
onset characteristic length l+ = l∗/RT are presented in columns (b) and (c) in Table 3. It is
seen that the constriction ratio of 1.5 has no effect on the onset characteristic length l+ for capillaries of circular cross section, while it increases the characteristic length in the order of 5–10% in the case of the non-circular cross sections. In fact, the shift of the characteristic length does occur also for circular cross section, but for higher values of h as it will be seen below. It is to be noticed that there is no significant change in the characteristic length between the two constriction types for a same form of cross section. This fact can be explained by the presence of dead zones at the edge of the pore body, which give a similar form of the flow zone whatever the constriction type, as it has also been observed by Roustaei and Frigaard
(2013).
For the particular value h = 1.5, the flow rate was calculated as a function of the applied pressure gradient and the obtained results are shown in Fig. 6 in terms of q+(∇ P+). From this figure, it is observed that whatever the form of the axial variation in the cross section, the pressure gradient characterizing the flow onset is again only weakly impacted. Moreover, for every cross-sectional form, the rectangular function shows a greater impact on the q+ (
P+) curve than the wavy function and such an impact is more pronounced in case of the square cross section while it is very weak in case of circular cross section. However, and as it will be
+ (
Fig. 6 Dimensionless flow rate versus dimensionless pressure gradient for a Bingham fluid in capillaries
of variable cross section, a circular cross section, b square cross section, c triangular cross section, (τ0 = 1 Pa, k = 1 Pa s)
seen below, when h is large, more differences are likely to be observed owing to the induced change in l∗.
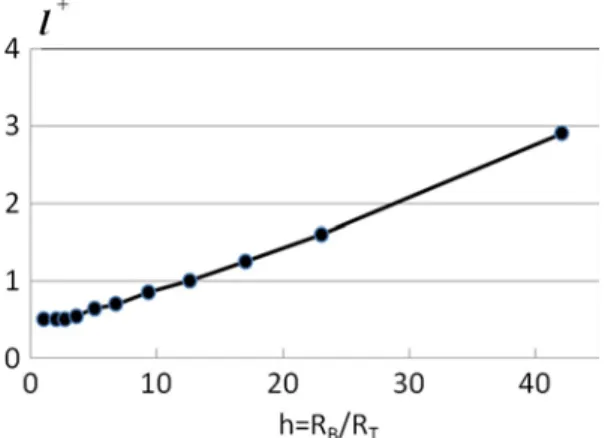
Further computations have allowed to investigate the variation in the dimensionless onset characteristic length, l+, as a function of the aspect ratio h = RB/RT. The dependence of l+
on h for a Bingham fluid flowing in a capillary of circular cross section varying according to rectangular or cosine functions has been considered. As an example, Fig. 7 shows the results relative to the rectangular shape where l+ is almost constant for h ≤ 5 and increases for higher values of h.
Therefore, it may be concluded that if cylinders of non-circular and axially varying cross section are used rather than straight ones of constant circular cross section, obtained
∇ P+)curves may be greatly impacted and especially for high h values. This should be
of importance as porous media will be modeled as a bundle of capillaries of this type with various h values.
3.2 Flow Rate in a Bundle of Capillaries of Constant Cross Section
A bundle of straight capillaries of constant cross section is built by assigning the throat size distribution determined by Bhattad et al. (2011) to the inscribed circle for each form of studied cross sections. In order to compare bundles of constant porosities, one has to take into account the actual average cross section area corresponding to each bundle, ( A):
r ∞ ( A) =
0
Fig. 7 Dimensionless
characteristic length of the flow onset l+ versus constriction ratio h = RB/RT for a capillary of circular cross section varying according to a rectangular function
A (RT) is the cross section of the capillary of inscribed circle radius RT (which coincides here
with a), and pT (RT) is the probability density function. Hence, the number of capillaries per
unit transverse area of the sample is Ncap = ε/ A, ε being the porosity of the medium.
The total flow rate through the bundle for a given ∇ P is therefore
Q (∇ P) = Ncap
r ∞ τ0
∇ P×l+
q (RT, ∇ P) pT (RT) dRT (8)
where q (RT, ∇ P) is the flow rate in a single capillary of radius RT as computed in the
previous section and the value of l+ = l∗/a is deduced from Table 1. It must be recalled here that when circular cross section is involved, the lower bound of the integral reduces to the well-known limit 2τ0/∇ P. So, knowing both q (RT, ∇ P) and pT (RT), the Q (∇ P) curves
may be then computed.
From experimental point of view, Chase and Dachavijit (2003) have injected carbopol solutions of various concentrations through a bed of randomly packed mono-sized glass spheres of 2.11 mm in diameter. For a carbopol concentration of 0.6%, the fluid’s rheological behavior was well represented by a Bingham law with τ0 = 7.22 Pa and k = 71.3 mPa s.
Their experimental results are replotted in semilog scale in Fig. 8 together with our simulation results for the same fluid for a bundle of capillaries with triangular, square and circular cross sections.
The relative position of the computed curves is the same as those seen for single capillaries in Fig. 4, since they only represent a sum of ordered quantities. By taking into account the actual area of the capillaries, the gap between the curves is even slightly damped. One has also to remark again that at high values of ∇ P, Q (∇ P) is a linear function of ∇ P as expected. In any case, whatever the form of the cross section, the bundle of capillaries of constant cross section is clearly seen to overestimate experimental results. In other words, it seems necessary to take into account the converging/diverging character of the channels to be more representative of actual porous media since axial variation in the cross section should be determinant in predicting the flow resistance as for viscoelastic fluids flowing through porous media (Zhang and Yue 2007). Therefore, the bundle above has been improved by introducing a variation in the cross section along capillaries’ axis.
Fig. 8 Total flow rate of carbopol (τ0 = 7.22 Pa, n = 1 and k = 71.3 mPa s) through bundles of capillaries of constant cross sections of various shapes compared to experimental results of Chase and Dachavijit (2003)
3.3 Flow Rate in a Bundle of Capillaries of Variable Cross Section
Similarly to the work of Zhang and Yue (2007), a stochastic bundle is built using pore body and pore throat distributions of Bhattad et al. (2011) (Fig. 9). The distributions obtained using the grain-based approach (GB1 in their article) are directly used in their discrete form. In order to reduce very long and costly computations and on the basis of results of the literature for unconsolidated porous media (Jerauld and Salter 1990; Lindquist et al. 2000), the ratio LT/RT is kept constant and equal to 1.5, and for the sake of simplicity and to reduce additional
complications of the simulations, a pattern is made with one shape of cross section, one kind of axial variation in the cross section, one set of radii (RT, RB) and is periodically duplicated
along the capillary axis. The pattern is unique for each capillary, and each pore throat radius may be associated with any pore body radius with probability densities pT (RT) and pB (RB)
extracted from the work of Bhattad et al. (2011).
Fig. 9 A schematic illustration
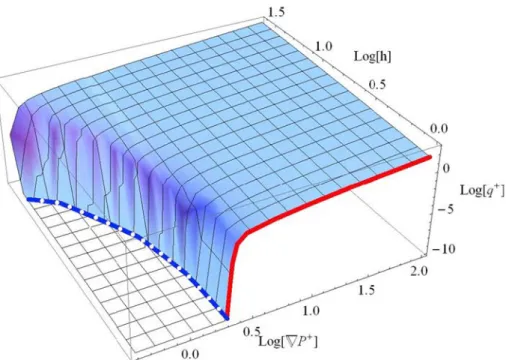
Fig. 10 q+(h, ∇ P+) for a capillary of circular cross section varying according to a rectangular function.
Continuous red line is for h = 1 (constant cross section), and dotted blue line represents the onset pressure
gradient ∇ P+(h) in Fig. 7
Here again, one has to compare bundles of constant porosities. The actual average cross- sectional area of each bundle is now ( A) :
r ∞ r ∞ 1 r A
A = [a (RT, RB, z)] dz pT (RT) pB (RB) dRTd RB (9)
0 0 λ 0
The total flow rate through this kind of bundle is derived in the same manner as previously, giving Q (∇ P) = Ncap r ∞ τ0 ∇ P×l+ r ∞ q (RT, h, ∇ P) pT (RT) pB (RB) dRBdRT (10) 0
where ∇ P is taken at the scale of a pattern. q (RT, h, ∇ P) is the flow rate across a single
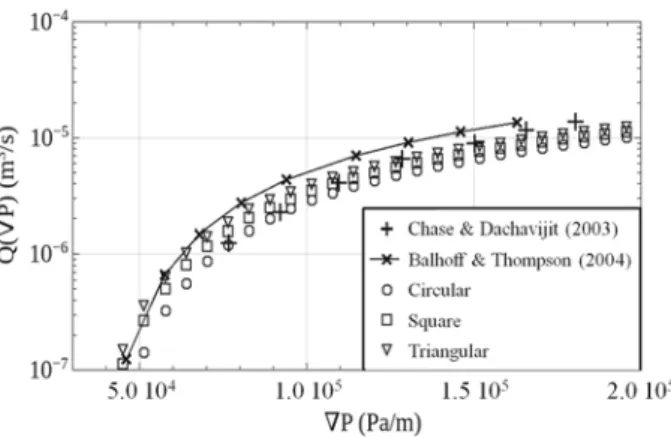
capillary and is given in Fig. 6 for the particular value, h = 1.5. Here l+ is a function of h, and the form and the axial variation type of the cross section and computations have been done for 1 < h < 40. An example of obtained results is given in Fig. 10 for a circular cross section varying as a rectangular function. The obtained data are shown in Fig. 11 together with experimental results of Chase and Dachavijit (2003) for the same value of the porosity.
Our simulation data are clearly in good agreement with experimental results over the entire scanned ∇ P range for each cross-sectional form, demonstrating hence the necessity to take into account the change of cross section along flow channels. Moreover and on the basis of Fig. 6, it is expected to obtain similar results for a cross section varying according to a cosine function. It is to be highlighted that, in this particular case, this somehow simple bundle modeling seems more efficient in predicting experimental results than a more complex pore network model (Balhoff and Thompson 2004). However, one can still ask which form of the cross section is more capable of describing experimental data for various porous medium
Fig. 11 Total flow rate of carbopol through bundles of cross section of various shapes and axially varying
according to a rectangular function, compared to experimental results of Chase and Dachavijit (2003) and a pore network prediction of Balhoff and Thompson (2004)
characteristics. Obviously, the form of the precursor grains leading to the formation of the porous medium could give an indication on the approached form of the transverse cross section of the pore. Indeed, it is well known that the exact form of grains does appreciably impact petrophysical properties of porous media (Torskaya et al. 2014) and therefore would be a clue parameter for building the right model depending on the type of considered porous medium.
4 Concluding Remarks
The central objective of this work was to investigate whether a “simple” bundle of capillaries model could be capable of describing the flow of a YSF through a porous medium. We mainly focused on the impact of the non-circularity of the cross section and the axial variations in such cross section as well. It has been found that in the case of a Bingham fluid, the onset is only weakly affected by the form of the cross section. Moreover, when pore channels are of constant cross section, the capillaries’ bundle model was shown to be unable to predict experimental data obtained by injection of carbopol through a random pack of mono-sized spheres. However, a bundle of constricted capillaries was able to represent such a flow over the whole range of ∇ P. Nevertheless, as some available experiments are carried out with YSF obeying Herschel–Bulkley law with n < 1, it would be helpful to carry out numerical simulations with such fluids in order to assess our findings. This is planned to be done in a future work.
References
Ambari, A., Benhamou, M., Roux, S., Guyon, E.: Distribution des tailles de pores d’un milieu poreux déter- minées par l’écoulement d’un fluide à seuil. C. R. Acad. Sci. 311, 1291 (1990)
Balhoff, M.T., Thompson, K.E.: Modeling the steady state flow of yield-stress fluids in packed beds. AIChE J. 50, 3024 (2004)
Bhattad, P., Willson, C.S., Thompson, K.E.: Effect of network structure on characterization and flow modeling using X-ray-tomography images of granular and fibrous porous media. Transp. Porous Media 90, 363– 391 (2011)
Burgos, G.R., Alexandrou, A.N.: Flow development of Herschel–Bulkley fluids in a sudden three-dimensional square expansion. J. Rheol. 43(3), 485–498 (1999)
Chase, G.G., Dachavijit, P.: Incompressible cake filtration of a yield stress fluid. Sep. Sci. Technol. 34, 745 (2003)
Chevalier, T., Talon, L.: Moving Line model and avalanche statistics of Bingham fluid flow in porous media. Eur. Phys. J. E 91, 023011 (2015a)
Chevalier, T., Talon, L. Generalization of Darcy’s law for Bingham fluids in porous media: from flow-field statistics to flow-rate regimes. Phys. Rev. E 91, 023011 (2015b)
Dullien, F.: Porous Media—Fluid Transport and Pore Structure, 2nd edn. Academic Press, New York (1992) Huilgol, R.R.: A systematic procedure to determine the minimum pressure gradient required for flow of viscoplastic fluids in pipes of symetric cross-section. J. Non Newton. Fluid Mech. 136, 140–146 (2006) Jay, P., Magnin, A., Piau, J.-M.: Numerical simulation of viscoplastic fluid flows through an axisymmetric
contraction. Trans. ASME 124, 700–705 (2002)
Jerauld, G.R., Salter, S.J.: The effect of pore-structure on hysteresis in relative permeability and capillary pressure: pore-level modeling. Transp. Porous Media 5, 103 (1990)
Letelier, M.F., Siginer, D.A., Hinijosa, C.B.: On the physics of viscoplastic fluid flow in non-circular tubes. Int. J. Non Newton. Mech. 88, 1–10 (2017)
Lindquist, W.B., Venkatarangan, A., Dunsmuir, J., Wong, T.: Pore and throat size distributions measured from synchrotron X-ray tomographic images of Fontainebleau sandstones. J. Geophys. Res. 105(B9), 21509–21527 (2000)
Liu, T.-J., Hong, C.-N.: The pressure drop/flow rate equation for non-Newtonian flow in channels of irregular cross-section. Polymer Eng. Sci. 28(23), 1559–1564 (1988)
Malvault, G. Determination experimentale de la distribution de taille des pores par injection d’un fluide a seuil ou analyse harmonique. Ph.D. thesis, Arts et Metiers ParisTech (2013)
Mosolov, P.P., Miasnikov, V.P.: Variational methods in the theory of the fluidity of a viscous-plastic medium. J. Appl. Math. Mech. 29(3), 468–492 (1965)
Mosolov, P.P., Miasnikov, V.P.: On qualitative singularities of the flow of a viscoplastic medium in pipes. J. Appl. Math. Mech. (PMM) 31(3), 581–585 (1967)
Oukhlef, A., Champmartin, S., Ambari, A.: Yield stress fluids method to determine the pore size distribution of a porous medium. J. Non Newton. Fluid Mech. 204, 87–93 (2014)
Rodriguez de Castro, A., Omari, A., Ahmadi-Senichault, A., Bruneau, D.: Toward a new method of porosime- try: principles and experiments. Transp. Porous Med 101, 349–364 (2014)
Rodriguez de Castro, A., Omari, A., Ahmadi-Senichault, A., Savin, S., Madariaga, L.F.: Characterizing porous media with the yield stress fluids. Transp. Porous Med 114, 213–233 (2016)
Roustaei, A., Frigaard, I.A.: The occurence of fooling layers in the flow of a yield stress fluid along a wavy- walled channel. J. Non Newton. Fluid Mech. 198, 109–124 (2013)
Saffman, P.G.: A theory of dispersion in a porous medium. J. Fluid Mech. 6(3), 321 (1959)
Saramito, P., Roquet, N.: An adaptive finite element method for viscoelastic fluid flows in pipes. Comput. Methods Appl. Mech. Eng. 190, 5391–5412 (2001)
Scheidegger, A.E.: The Physics of Flow Through Porous Media, 3rd edn. University of Toronto Press, Buffalo (1974)
Schenk, O., Gartner, K.: Solving unsymmetric sparse systems of linear equations with PARDISO. Future Gener. Comput. Syst. 20(3), 475–487 (2004)
Skelland, A.: Non-Newtonian Flow and Heat Transfer. Wiley, New York (1967)
Sochi, T., Blunt, J.: Pore-scale network modeling of Ellis and Herschel–Bulkley fluids. J. Petrol. Sci. Eng. 60, 105–124 (2008)
Torskaya, T., Shabro, V., Torres-Verdín, C., Salazar-Tio, R., Revil, A.: Grain shape effects on permeability. Formation factor, and capillary pressure from pore-scale modeling. Transp. Porous Med. 102, 71–90 (2014)
Talon, L., Bauer, D.: On the determination of a generalized Darcy equation for yield-stress fluid in porous media using a Lattice–Boltzmann TRT Scheme. Eur. Phys. J. E 36, 139 (2013)
Zhang, L.J., Yue, X-a: Mechanism for viscoelastic polymer solution percolating through porous media. J. Hydrodyn. B 19(2), 241–248 (2007)