CIRPÉE
Centre interuniversitaire sur le risque, les politiques économiques et l’emploi
Cahier de recherche/Working Paper 06-18
Democratic Voting and Social Exclusion
Sylvain Dessy Flaubert Mbiekop
Mai/May 2006
_______________________
Dessy: Department of Economics and CIRPÉE, Université Laval, 2176 DeSève, Québec, QC Canada G1K 7P4
Mbiekop: CIRPÉE and Université du Québec à Montréal
Abstract:
This paper explores the political determinants of societies’ tolerance for social exclusion on the basis of ethnicity, religion, or race. We develop a political-economic model of social exclusion with three main features. First, each individual living in this society must submit a political proposal regarding the extent to which society must tolerate social exclusion. Second, depending on the realized degree of society’s tolerance for social exclusion, each population group comprising the society must decide on how much resources to expend in order to exclude rival groups from, or include its members in, the public allocation of education resources. Third, allocation of resources to participation in the exclusion contest trades off private investment in child’s human capital. To the extent that population size is, at least initially, the only source of asymmetry between rival groups, our analysis suggests that the introduction of democratic voting may not be sufficient to save small, but visible, minorities from social exclusion. Only where this asymmetry is moderate, can the introduction of democratic voting suffice to eliminate social exclusion.
Keywords: Democratic voting, social exclusion, political equilibrium JEL Classification: D72, J15, P16
I. Introduction
In public discussions of the role of institutions in the process of development, the intro-duction of democratic voting is often seen as a panacea—a cure for all social ills. Social exclusion1, however, is a problem faced by democracies and dictatorships alike (William
Easterly and Ross Levine [1997]; Alberto Alesina, William Easterly, and Reza Baqir [1999], Mark Gradstein and Moshe Justman [2002]). Consider a heterogenous society, where pop-ulation groups are polarized along ethnic, religious or racial lines. Whether individuals comprising such a society will have equal access to the constituents of welfare, regardless of their population group of affiliation, may therefore depend on whether social exclusion is tolerated. A necessary condition for social exclusion to be tolerated is that politicians have ethnic, racial, or religious-based constituencies, which may lead to the exclusion of the politically dominated population groups from the constituents of welfare. It is not there-fore surprising that such exclusion has been shown to have a negative effect on economic growth (William Easterly and Ross Levine [1997]; Mark Gradstein and Moshe Justman [2002]), and to lead to an unequal distribution of wealth across population groups (Mark Gradstein and Maurice Schiff [2006]). Why is this phenomenon tolerated in some soci-eties? More importantly, if population groups comprising a heterogenous society were to vote democratically on the extent to which their society must tolerate exclusion on the basis of ethnicity, religion, or race, what would be the outcome of this vote and why?2 Under what conditions does democratic voting eliminate social exclusion? These are the questions we address in this paper.
Basic economic theory of social exclusion or marginalization reveals that participating in the exclusion contest entails costs, not just benefits, to the participants (Mark Grad-1In this paper social exclusion refers to the exclusion of rival social groups from the constituents of welfare on the basis of race, religion, or ethnicity, for example. Indicators of social exclusion relate to economic activity, employment, housing, health, and other factors.
2Observe that voting on the extent of social exclusion may, in reality, take the form of a referendum whereby citizens of a heterogenous society must choose between two political systems: a proportional representation system that is highly inclusive, and a majoritarian system that favors exclusion (see, for example, Marta Reynal-Querol [2004]).
stein [2003]; Jose G. Montalvoa, and Marta Reynal-Querol [2005]). By backward induction, therefore, one would expect a population group to support tolerance of social marginaliza-tion of rival groups only if, for members of that group, the benefits of socially marginalizing others outweigh its costs. The costs of marginalizing others may take the form of resources (time and/or money) members of a population group must expend in order to block ri-val groups’ access to publicly provided resources such as health services, education (e.g., Mark Gradstein [2003]), or to public goods (e.g., Alberto Alesina, William Easterly, and Reza Baqir [1999]). The benefits may be measured, for instance, in terms of the share of existing public resources this group can capture for the exclusive use of its members (e.g., Mark Gradstein [2003]). In this paper, we develop a political-economic model of population groups competition for education resources with three main features. First, each individual living in this society must submit a political proposal regarding the extent to which society must tolerate social exclusion. Second, depending on the realized degree of society’s tolerance for social exclusion, each population group comprising the society must decide on how much resources to expend in order to exclude rival groups from public allocation of education resources. Third, allocation of resources to participation in the exclusion contest trades off private investment in child’s human capital.
Within each population group, members correctly anticipate that, if selected, their political proposal on the extent of society’s tolerance for social exclusion will have an effect on the intensity of the exclusion contest. Therefore, we first characterize the outcome of the exclusion contest as a Nash-Equilibrium of a non-cooperative game between rival groups, given the realized degree of tolerance for social exclusion. Depending upon his population group of affiliation, and depending upon the outcome of the exclusion contest, each individual then receives a payoff from living in a society with degree of tolerance, say δ, for social exclusion. In a political equilibrium with democratic voting over the level of δ, each individual then chooses the political proposal, δ, that maximizes this payoff.
We use this political-economic framework to argue that in a context where individuals are allowed to vote democratically on the extent of society’s tolerance for social exclusion,
if population groups are either symmetric in exclusion power–or, when they are asymmet-ric, the degree of inter-group asymmetry in exclusion power is relatively moderate–, then no population group gains from supporting tolerance of social exclusion. Only in societies where the inter-group asymmetry in exclusion power is sufficiently large, would the more powerful group gain from supporting tolerance of social exclusion. The analysis therefore suggests that democratization in socially heterogenous countries, with relatively low level of population group asymmetry in exclusion power, can be sufficient to eliminate social exclusion or marginalization. However, in societies where such asymmetry is sufficiently large, the introduction of democratic voting may not be sufficient. In that context, a nec-essary and sufficient condition for social exclusion to be eliminated is that the introduction of democratic voting be combined with an appropriately designed immigration policy that reduces the relative exclusion power of the majority group.
There is an extensive economics literature focusing on the effects of social heterogene-ity on the basis of race (e.g., Alberto Alesina, Reza Baqir and William Easterly [1999]), ethnicity and religion (e.g., William Easterly and Ross Levine [1997]; Mark Gradstein and Moshe Justman [2002]; Mark Gradstein [2003]; Jose G. Montalvoa, and Marta Reynal-Querol [2005]). Alesina, Baqir and Easterly [1999] show that racial heterogeneity has a negative effect on the provision of public goods in the United States. Easterly and Levine [1997] show that ethnic divisions have a negative impact on the economic growth of African countries, because of their association with low educational attainments. Gradstein and Justman [2002] find that decentralized and segregated education in which different popula-tion groups3 separately run uncoordinated school systems has a negative effect on growth. In an empirical study of ethnolinguistic diversity, Montalvoa and Reynal-Querol [2005] argue that ethnic (religious) polarization has a large, negative, effect on economic devel-opment, because it reduces investment while increasing government consumption and the probability of a civil conflict.
The common point of contributions in the above literature is that they all focus on 3In their case, ethnicity and religion are candidate sources of population heterogeneity.
the effects of social marginalization, and not on its political determinants. A notable exception is Mark Gradstein [2003] and most recently Mark Gradstein and Maurice Schiff [2006]. Gradstein [2003] studies the political determinants of social exclusion in the case of multiple groups differentiated by race, religion, or ethnicity. He finds that in the presence of within-group human capital spillovers, social exclusion may win the majority’s support. It is important to note that in Mark Gradstein [2003], households do not explicitly have the option to supplement public education resources with private resources, so that if parental altruism is sufficiently high, the benefits of exclusion–which include human capital spillovers between members of the majority–will always outweigh its costs. In our model, social exclusion can obtain as a political outcome, even in the absence of human capital spillovers, as long as investment in a child’s human capital has both a public as well as a private component–which is well documented (e.g., Edward L. Glaeser [1994]).4
Therefore, while Gradstein [2003] emphasizes the presence of within-group human capital externalities as an important determinant of political support for social exclusion in a democracy, we, in contrast, emphasize the trade off between the cost of excluding rival population groups and household private investment in offspring’s human capital formation. The distinguishing feature of our model is that each household has the option to supplement public education resources with a private investment in his offspring human capital, so that private resources allocated to the exclusion contest trade off parental investment in human capital. This feature of our model formalizes the degree of inter-group asymmetry in exclusion power (as measured, for example, by the degree of asymmetry in population size) as an important determining factor of the positive association between democratic voting and political support for social exclusion. Indeed, for each population group, the per capita cost of exclusion is increasing in the relative size of the rival group. We show that in that environment, social exclusion can still obtain as a political outcome.
Our research is more closely related to a recently published work by Mark Gradstein 4When there is public investment in child’s human capital, private, parental investment may include the purchase of home-based learning devices such as computers, or the financing of private tutoring for the child.
and Maurice Schiff [2006]. Gradstein and Schiff [2006] build a model in which exclusion of the minority is the preferred strategy for the majority, and study conditions under which society can gradually progress towards social inclusion of the minority. Two main features distinguish our model from Gradstein and Schiff [2006]. First, in their model only members of the minority, excluded from sharing in on publicly financed education resources, privately invest in their offspring’s human capital formation. This implies that for the majority, public education completely crowds out parental private contribution to a child’s human capital formation. We relax this assumption in our model. Indeed, in our model, both the majority and the minority have the option to supplement public education with private investment in their offspring’s human capital formation. Relaxing this assumption allows us to endogenize the threat of rebellion or secession by the minority. Second, in Gradstein and Schiff [2006], the credibility of the threat of rebellion by the minority is exogenously given. When this threat is sufficiently credible, the majority withdraws its support for social exclusion, and inclusion of the minority takes place. Only when this threat is incredible can social exclusion obtain and persist as a political outcome. In Gradstein and Schiff [2006], no explicit consideration is given to the determinants of the credibility of this threat. Suppose as in Gradstein and Schiff that the minority can threaten to secede if their offspring are not included in the public allocation of education resources. On one hand, one would expect the minority to take a collective action aimed at establishing the credibility of their threat of secession. For example, they can expend their own resources in order to gain international legitimacy for their secession project; or they may invest in gathering legal resources necessary to justify their right to self-determination.5 This, in turn, will raise the credibility of their threat of secession in the
eyes of the majority group. On the other hand, anticipating such action by the minority, the majority group may, in response, undertake a collective action aimed at undermining the legitimacy of the minority’s secession project. They may, for example, finance diplomatic missions abroad aimed at exposing the flaws of the minority’s secession project, which, in 5This may include exposing internationally the human injustice or exploitation they face in the larger multi-ethnic, or multi-religious state.
turn, may reduce the threat of secession by the minority. This action and reaction process is best described, as we show in this paper, as a non-cooperative secession or rebellion game. In such an environment, exclusion of the minority will obtain political support only if the majority has enough resources to undermine the credibility of rebellion or secession by the minority. Otherwise, social inclusion will take place. Unlike in Gradstein and Schiff [2006], therefore, we demonstrate (and do not simply assume) that the majority needs to be sufficiently dominant in order to succeed in undermining the credibility of the minority’s threat of secession. We model the economic gains from supporting social exclusion as the level of welfare attained by an individual living in a society that has a degree, δ, of tolerance for social exclusion. We show that whether or not the majority gains economically by excluding the minority depends upon the extent of the majority’s exclusion power—including its ability to undermine the threat of rebellion by the minority. To the extent that population size is, at least initially, the only source of asymmetry between rival groups, our analysis suggests that the introduction of democratic voting may not be sufficient to save small, but visible, minorities from social exclusion. This is because for very small minorities, the threat of secession or rebellion is not credible.
Marta Reynal-Querol [2004] also develops a model that has the potential to inform the debate on the determinants of society’s tolerance social exclusion. Her model implies that where social exclusion is tolerated, it must be that the prevailing political system is a majoritarian democracy, which tends to foster social exclusion in societies where politicians have social group-based constituencies. A move toward social inclusion may therefore involve, in such societies, a change from a political system based on majority ruling, to one based on proportional representation, which favors a high degree of inclusiveness. While she focuses on the comparative performance of each of the two political systems in preempting civil wars, we, in contrast, focus on the determinants of the society’s choice for either system.
The remainder of this paper is structured as follows. Section 2 presents the model. This model is solved in section 3. Finally section 4 provides concluding remarks.
II. Model
Consider an economy in which individuals differ primarily with respect to their ethnicity, or race, or religion. The economy lasts for two periods. Citizens of this economy are divided into N population groups, indexed by j, where j = 1, ..., N , (N ≥ 2). We denote as nj ∈ (0, 1) the relative size of population group j, with n1 + n2 + .... + nN = 1.
Groups can be ethnic, religious, or racial-based, and we attach no particular attention to any of the three possible interpretations. Individuals are homogenous within each group. Decisionmakers are altruistic parents, who each have custody of a single child, who makes no decision. Parental altruism is limited to the extent to which a parent cares about her child’s education, or human capital level.
We denote as h1
j, the human capital level of an adult member of population group j.
We take this human capital level as a proxy for her labor income. A child’s only activity is to accumulate human capital, the level of which depends on the quality of education received. Investment in child’s education has two sources: a private source and a public source. The level of parental investment in child’s education is denoted as eij, while the
level of public investment in a child’s human capital is denoted as θij. Thus, the human
capital level of a child whose parent i (i ∈ [0, nj]) belongs to population group j is given
by:
h2ij = Deij + θij, D∈ (0, 1) (II.1)
where D denotes the exogenously given relative productivity of parental investment in child’s education.6 Observe that since public investment in education substitutes for
parental investment, such investment will not be socially desirable unless D < 1, i.e., the productivity of parental investment in child’s education is lower than that of public investment in education. We motivate public investment in this environment by the as-6The assumption of perfect substitution between the private and the public component of human capital investment is made without loss of generality. Imperfect substitution (a la Cobb Douglas) further complicates the exposition without any new qualitative insight. Furthermore, the assumption of perfect substitution between human capital inputs is not restricted to our analysis. A similar assumption is made by Gary S Becker, Kevin Murphy, and Robert Tamura [1990].
sumption that D ∈ (0, 1), so that public investment in education has the potential to enhance economic growth.7
Public funds, θ, allocated to public investment in education are financed by an exoge-nously given income tax levied on all parents, at a proportional rate t ∈ [0, 1). Assuming balanced government budget, the level of public funds allocated to public investment in education is given by θ = t N X j=1 njh1j ≡ t¯h1. (II.2)
Again to keep the focus on social exclusion of rival population groups, let us normal-ize household consumption to 0, so that each household’s essential decision is restricted to investment in child education, so as to maximize the child’s human capital. Assume population groups compete against one another for a larger share of public investment in education. Thus, following Mark Gradstein [2003], each population group j expends an amount xj to finance a group-specific collective effort to exclude rival population groups
from, or including members of of the group in, the allocation of public education resources. In the case where there are only two population groups, say, a majority group (M ) and a minority group (m), one can think of xm for example, as resource expended by the
mi-nority in order to increase the credibility of their of rebellion if they are excluded by the majority (Mark Gradstein and Maurice Schiff [2006]). And one can think of xM as the
level of resource expended by the majority in order to undermine the credibility of the minority’s threat of rebellion. The more resources the minority expend for this purpose, the more credible their threat of rebellion will be, and, therefore, the higher the share of public resources its members will be able to control. We therefore denote as
αj =
(xj) δ
nj
R , (II.3)
7This assumption is particularly relevant when one includes respect for the rule of law and for national institutions as a constituent of human capital. Marc Gradstein and Moshe Justman [2002] argue that public investment in education is better than private investment in enhancing the accumulation of these important constituents of individual human capital.
the share of public education resources secured by members of population group j, when, as a group, they allocate an amount xj to exclude (respectively, include) their rivals
(respec-tively, their members) from (respec(respec-tively, in) the allocation of publicly provided education resources, where δ ∈ [0, 1] is an endogenous measure of the degree of competition between population groups comprising the society and
R =
N
X
j=1
(xj)δnj. (II.4)
As in Esteban and Ray [1999], R is interpreted here as a measure of the intensity of the intensity of the exclusion contest. Given αj, the share of total public resources secured by
population group j for its members’ use is
θj = αjθ, (II.5)
so that public education resources received by a child i born of a parent who belongs to population group j are given by
θij =
αjθ
nj
, (II.6)
all i ∈ [0, nj], and all j (j = 1, ...., N ). In a society where population groups are segregated,
for example, by place of residence, the share, θij, may be interpreted as the relative quality
of public schools attended by children whose parents belong to population group j.
Assume no free-riding within members of the same population group, so that total lobbying expenditures by ethnic j are equally shared by all group members. Thus, the budget constraint faced by the representative member of population group j is given by the following inequality:
eij + (nj)−1xj ≤ (1 − t) h1j, (II.7)
all i and all j.
Given the amount, (nj)−1xj, contributed to collective action by population group j to
of each parent i, member of population group j, is to choose eij so as to solve the following
problem:
max
eij
h2ij
subject to (II.1), (II.6), and (II.7). Since parents are homogenous within each population group j, it is clear that they will all choose the same level of parental investment in child’s education, so that eij = ej, all i. Therefore, since a child’s human capital level
is strictly increasing in the amount of public education resources received, clearly the budget constraint will be satisfied with equality. Consequently, for each population group j, participation in the exclusion contest is characterized by the following equation
xj = (1− t) njh1j − ejnj, (II.8)
all j. Hence the trade off in each child’s human capital between the cost, xj, of excluding
rival population groups’ children and parental investment in own offspring’s human capital. Thus, the representative parent’s choice of ej determines the extent to which population
group j participates in the exclusion contest. We characterize the determinants of this participation below.
III. Winners and Losers in the Exclusion Contest
In this subsection we characterize the exclusion contest involving the representative mem-bers of each of the N population groups comprising the society. In the spirit of Gradstein and Schiff [2006], and assuming N = 2, on can think of this exclusion contest as a rebel-lion game between the majority and the minority, in which the minority’s must choose a level of action aimed at establishing the credibility of its threat of rebellion if excluded from sharing in on public education resources, given the action taken by the majority to attempt to undermine this credibility. Since there is no free-riding between same-group individuals, the exclusion contest will essentially pit the representative members of each of the population groups comprising the society. In what follows, we study the outcome
of this contest as a Nash-equilibrium of a non-cooperative game between the respective representative members.
Denote as player j, the representative member of population group j (with j = 1, ....N ). Let Ej ⊂ <+, denotes the strategy set of player j, with generic element ej. Let E ≡
E1× E2× ... × EN denotes the space of all feasible strategy profiles, with generic element
e. Define a real-valued function Vj : E
→ < by ωj = Vj(e), where ωj denotes the payoff
to player j when the strategy profile e = (ej, e−j) is played, and e−j denotes the strategy
profile chosen by the aggregate all players other than player j. From equation (II.1), substituting in (II.3)-(II.6), and (II.8), rearranging terms, yields player j’s payoff function as follows: Vj(ej) = Dej + (wj − ej)δ(nj)1+δ PN l=1(wl− el) δ (nl)1+δ θ nj , (III.1) all j, where wj = (1− t) h1j, (III.2)
and θ is as defined in (II.2). Given e−j, player j0s best response satisfies the following
equation D = (wj− ej)δ−1(nj)1+δ P l6=j(wj − el) δ (nl) 1+δ hPN l=1(wj − el) δ (nl) 1+δi2 δθ nj . (III.3)
To solve for the Nash equilibria of this game, we consider two cases: a benchmark case where all population groups are symmetric and another one where this assumption is relaxed.
A. Exclusion Contest with Symmetric Exclusion/Inclusion Power
In this subsection, we begin by characterizing the growth effect of social exclusion by solving a benchmark model where all population groups have equal size (i.e., nj = n all
j) and equal initial wealth (i.e., h1j = h1, all j). This implies that all population groups
have identical exclusion power. We then investigate, in that context, whether democratic voting can generate social exclusion on the basis of ethnicity as a political outcome. The assumption of ethnic symmetry allows us to take full advantage of the computational
simplicity of symmetric non-cooperative games. Hence the following proposition:
Proposition 1. Suppose nj = n and h1j = h1, all j. Then, the Nash-equilibrium profile,
e∗ = (e∗ 1, ..., e∗N), is given by e∗j = ∙ (1− t) − (N − 1) δ DN t ¸ h1, all j.
Proof. A symmetric Nash equilibrium is one where ej = el, all l 6= j. From (III.3),
substituting ej = el rearranging terms, we can rewrite the first order condition as follows:
D = (N − 1) δθ
N [(1− t) h1− e j]
,
where θ = th1. Hence the result. QED
As an implication of the above proposition, the equilibrium income of a child when adult can be rewritten as follows:
h2j = (1− t) Dh1+ ∙ N − (N − 1) δ N ¸ th1, all j. Let ¯hτ = PN j=1njh τ
j denotes the τ − generation’s average wealth level, τ ∈ {1, 2} .
Using the assumption of population group symmetry, the gross rate of economic growth in this economy with social exclusion is thus given by
g = ¯h 2 ¯ h1 = (1− t) D + ∙ N − (N − 1) δ N ¸ t (III.4)
since, by symmetry, ¯hτ = hτ all τ = 1, 2.
A number of observations can be derived from the growth rate expression (III.4). First, social heterogeneity (i.e., N > 1) has a negative effect on the economic growth of a society that tolerates social exclusion (i.e., a society where δ > 0). Hence the following proposition:
Proposition 2. Suppose nj = n and h1j = h1, all j. Then, in an ethnically diverse
economy (i.e., N > 1), growth is smaller, the higher the degree, δ, of society’s tolerance for social exclusion.
Second, if δ is sufficiently high, then an increase in the level of the tax rate financing public investment in education can actually reduce the growth rate of the economy. Hence the following proposition:
Proposition 3. Let nj = n and h1j = h1, all j, and suppose the triplet (δ, D, N ) satisfies
(1− D) N
N− 1 < δ ≤ 1, (III.5)
then, public investment in education hinders economic growth. Proof. It suffices to show that
∂g ∂t < 0,
whenever condition (III.5) holds. This result is obtained by simply differentiating expres-sion (III.4) with respect to t. QED
Since D ∈ (0, 1), condition (III.5) can easily obtain in sufficiently heterogenous societies. In particular, as N → ∞, this condition converges to 1 − D < δ ≤ 1, with D ∈ (0, 1). The result in Proposition 3 reflects the substitutability between public and private investment in a child’s human capital. The results of propositions 2 and 3 together suggest that tolerating social exclusion can be costly to a society. First, tolerance of social exclusion slows down growth (Proposition 2). Second, if such tolerance is sufficiently high, it can even cause public investment in education to become unproductive in a society with a high degree of heterogeneity (Proposition 3). If so, why would ethnically diverse societies tolerate it?
Observe that in this benchmark economy studied above, the equilibrium payoff to par-ticipating in the exclusion contest is identical across population groups, and given by
¯ Vj(δ) = (1− t) Dh1+ ∙ N − (N − 1) δ N ¸ th1
all j. Therefore, in a political equilibrium with democratic voting over the level of δ, it is clear that social exclusion will be rejected in favor of social cohesion, since for all j,
0 = arg max
δ
¯ Vj(δ) .
In this benchmark case, all population groups understand that there will be no winner in the exclusion contest, as in a democracy they all have equal lobbying strength reflected by equal size and equal economic power. In what follows, we ask whether these results extent to the case of asymmetric population groups.
B. Asymmetry in Exclusion Power
In this subsection, we relax the assumption of symmetry in exclusion power as captured by the group size, and attempt to solve for Nash-equilibria of the social exclusion game. The goal of this exercise is to identify the sources (if any) of political tolerance for social exclusion. In the interest of simplicity we restrict attention to two population groups, denoted group M (i.e., the majority group) and group m (i.e., the minority), respectively, with nm < nM. In other words, N = 2. For simplicity, we let h1 = hj, all j, so that
differences in group size also captures difference in lobbying power. In that context, using (III.1), it can be shown that a Nash-equlibrium profile satisfies the following system of two equations in two unknown (em, eM):
m : (w− em) δ (nm)1+δ(w− eM) δ (nM)1+δ h (w− em) δ (nm) 1+δ + (w− eM) δ (nM) 1+δi2 δθ D = (w− em) nm (III.6) M : (w− em) δ (nm)1+δ(w− eM)δ(nM)1+δ h (w− em) δ (nm) 1+δ + (w− eM) δ (nM) 1+δi2 δθ D = (w− eM) nM (III.7)
where w is as defined in (III.2), θ is as defined in (II.2), and nm+ nM = 1. Combining the
above first order conditions yields the following arbitrage condition:
Observe that a direct implication of Eq. (III.8) is that as long as population groups have different sizes, i.e. nm 6= nM, all Nash-equilibria are asymmetric in players’ strategies:
ej 6= e−j, all j. hence the following Lemma:
Lemma 1. The unique Nash-equilibrium of this exclusion game is given by
e∗j = w− n−jδθ/D, (III.9)
for all j = m, M .
Proof. Equation (III.8) implies that
(w− em) = (w− eM)
nM
nm
.
Substituting this back into (III.7), rearranging terms then yields the result. QED
Consider expression (II.8). Substituting in (III.9) yields, for a typical member of popu-lation group j, her per capita investment, κ∗
j = x∗j/nj, in the exclusion contest as follows:
κ∗j = n−jδθ/D. (III.10)
Then, observe that in comparison to the ethnic majority, members of the ethnic minority invest more resources per capita in the exclusion contest:
κm∗ > κM∗ ,
due to the asymmetry in exclusion power (i.e., nM > nm). In other words, to avoid being
totally excluded from the allocation of public education resources, members of the ethnic minority must allocate relatively more resources per capita in the exclusion contest. As a result, they end up each diverting more resources away from private investment in their offspring’s human capital:
This result is a direct implication of the power asymmetry (i.e., nM > nm) between the two
population groups comprising the society. We have just proved the following Proposition: Proposition 4. Tolerance of social exclusion in a context of population group asymmetry in exclusion power forces members of the ethnic minority to waste relatively more resources, at the expense of their offspring’s human capital.
How wasteful tolerance of social exclusion will force members of the ethnic minority to be, depends on the extent of the asymmetry in exclusion power between the two population groups. We distinguish two cases: (i) nM < wD/δθ; (ii) nM > wD/δθ. In the first case,
the asymmetry in exclusion power is moderate, in the sense that each member of the minority group can still privately invest in his offspring’s education despite participation in the exclusion contest: em > 0. In the second case, the asymmetry in exclusion power is
sufficiently large, in the sense that participation in the exclusion contest precludes private investment in education for members of ethnic minority: em = 0.
B.1. Case 1: nM < wD/δθ
In this subsection, we address the issue of who gains from supporting social exclusion when the inter-group asymmetry in exclusion power is not too large: nM < wD/δθ. We
first characterize population groups’ equilibrium payoffs from participating in the exclusion contest.
Lemma 2. Let h1
M = h1m. Suppose nM < wD/δθ. Then, the equilibrium payoff accrued
to the representative member of ethnic j is given by:
ˆ
Vj(δ) = Dw + [1− n−jδ] θ, (III.11)
all j = m, M.
Proof. Under the condition nM < wD/δθ, it can be shown that both population groups
education resources. Thus, from (III.1) substituting in (III.9), rearranging terms yields the result. QED
A number of observations can be derived from Eq. (III.11). First, the majority group is the contest winner:
for all δ, VˆM(δ) > ˆVm(δ). The second observation is summarized by the following proposition.
Proposition 5. Suppose 1/2 < nM < wD/δθ. Then neither the minority group nor the
majority benefit from supporting tolerance for social exclusion. Proof. It suffices to show that for all j = m, M ,
0 = arg max
δ
ˆ Vj(δ) .
This can be done by observing from (III.11) that the function ˆVj(.) is strictly decreasing
for all j = m, M . Hence the result. QED
That this result hold for the ethnic minority is straightforward because tolerance of so-cial exclusion causes members of that group to become relatively more resource-wasteful, which, by backward induction, leads them to propose a zero-tolerance policy for this phe-nomenon. For this result to hold for the contest winner as well is less straightforward. Yet, the reason the majority group also rejects social exclusion is quite intuitive. Ex-cluding the minority group from sharing in on public resources entails both costs (wasted resources) and benefits measured by the share of resources captured by the group. When the inter-group asymmetry is moderate in the sense that 1/2 < nM < wD/δθ, this reduces
the benefit the majority derives from excluding the minority from the allocation of public education resources. For example when the exclusion contest takes the form of a rebel-lion game between the majority and the minority, condition 1/2 < nM < wD/δθ implies
that the majority is not large enough to be able to undermine the the minority’s threat of rebellion, in the sense that the per capita cost of undermining the credibility of this
threat exceeds its per capita benefits. Hence, the majority’s lack of support for social ex-clusion. The above Proposition implies that in societies where the inter-group asymmetry in exclusion/inclusion power is moderate enough, the introduction of democratic voting is sufficient to eliminate social exclusion.
B.2. Case 2: nM ≥ wD/δθ > 1/2
In this subsection, we revisit the issue of who gains from supporting social exclusion in the case where the inter-group asymmetry in exclusion power is relatively large: nM ≥ wD/δθ.
In that case, the asymmetry in exclusion power is such that participating in the exclusion contest forces the minority group to give up on supplementing public resources with private investment in child’s human capital. In other words, em = 0, while eM > 0. We begin with
the following lemma. Lemma 3. Let h1
M = h1m. Suppose
nM ≥ wD/δθ > nm. (III.12)
Then, the equilibrium payoff accrued to each member of ethnic j is given by:
V∗j(δ) = ⎧ ⎨ ⎩ θ/ [nm+ φ (δ) nM] for j = m Dw + ψ (δ) θ for j = M , (III.13) where φ (δ) = ∙ δtnM (1− t) D ¸δ , (III.14) ψ (δ) = 1 nM + [φ (δ)]−1nm − nmδ. (III.15)
Proof. The result simply follows from substituting expressions (III.9) into (III.1), using condition (III.12), and rearranging terms. QED
Expression (III.13) characterizes each population group’s payoff from living in a society that has a degree, δ, of tolerance for social exclusion. In order to understand who gains and who loses from supporting social exclusion, we again ask each individual to make a proposal on the level that δ should take in the society. Our results are summarized by the following Proposition:
Proposition 6. Let h1
M = h1m. Suppose nM ≥ wD/δθ > nm. Then, only the majority
group gains from supporting social exclusion.
Proof. It suffices to show that the function V∗m(.) is strictly decreasing in δ, while
V∗M(.)is strictly increasing in δ.
Claim 1. V∗m(.)is a strictly decreasing function
Proof of Claim 1. To show that V∗m(.) is a strictly decreasing function, it suffices
to show that φ (.) is a strictly increasing function, i.e., φ0(δ) > 0. To see this, let ϕ (δ) = log φ (δ),where φ (δ) is as defined in (III.14). Then, it can be shown that
ϕ0(δ) = 1 + log ∙ δtnM (1− t) D ¸ > 0, since nM ≥ wD/δθ.
Hence φ0(δ) = ϕ0(δ) φ (δ) > 0. This completes the proof.
Claim 2. V∗M(.) is a strictly increasing function
Proof of Claim 2. The proof follows in two steps. First, we establish analytically that V∗M(.) is at least non-decreasing in δ. Then we show numerically that V∗M(.) is
indeed strictly increasing in δ.
Differentiate (III.15) with respect to δ to get
ψ0(δ) = φ
0(δ) n m
[φ (δ) nM + nm]
2 − nm.
Next, to show that ψ0(δ) > 0, it suffices to establish that
Since by construction φ0(δ) = ϕ0(δ) φ (δ) , the above inequality reduces to ∙ 1 +1 δ log φ (δ) ¸ φ (δ)≥ [φ (δ) nM + nm] 2 . (III.16)
Now, suppose by way of contradiction that inequality (III.16) does not hold for nM ≥
wD/δθ. Then, observe that as nM → wD/δθ, it is clear that φ (δ) → 1, so that [φ (δ) nM + nm] 2 → 1, since nM + nm = 1, and ∙ 1 +1 δlog φ (δ) ¸ φ (δ)→ 1, which is clearly a contradiction.
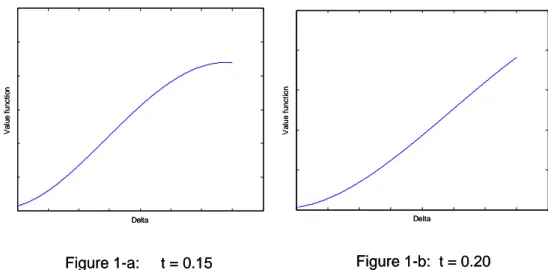
Next, we solve two numerical examples to illustrate that V∗M(.) is strictly increasing
in δ. Delta V a lu e f u nc ti o n Delta Va lu e f u n c ti o n
Figure 1-a: t = 0.15 Figure 1-b: t = 0.20 Delta V a lu e f u nc ti o n Delta Va lu e f u n c ti o n
Figure 1-a: t = 0.15 Figure 1-b: t = 0.20
In Figure 1-a, the tax rate is chosen at t = .15, which set nM = .90, in order for
condition (III.12) to be satisfied. In Figure 1-b, the tax rate is raised at t = .20, which set nM = .75 in order for condition (III.12) to hold. In both cases, the value function V∗M(.)
is strictly increasing for values of δ chosen in the interval [.65, 1]. Values of δ < .65 are inconsistent with condition (III.12). Hence the result. QED
Condition (III.12) states that the majority group’s relative population size is sufficiently large. It implies that for the majority, the benefits of excluding the rival group exceed its
costs, while the reverse is true for the minority group. As a result, only the former gains from supporting society’s tolerance for social exclusion. In such a society, therefore, one would expect political candidates to have ethnic, religious or racial-based constituencies, and social exclusion will thrive under democratic voting. Our analysis replicates Grad-stein’s [2003] result only in cases where inter-group asymmetry in exclusion power is suffi-ciently large. So when population groups have equal size, or when the asymmetry in sizes is not too large, democratic voting can eliminate social exclusion on the basis of ethnicity, religion, or race. This is because in that case, all population groups anticipate that the intensity of exclusion contest will be too high, so that the costs of excluding rival popu-lation groups will exceed its benefits. However, when the inter-group size asymmetry is sufficiently large, then democratic voting can yield political support for social exclusion. This is because for members of the majority, the per capita cost of excluding the minority group is smaller, the smaller the relative population size of the minority. In order words, the higher (respectively, the smaller) the size of the majority (respectively, the minority), the more able (respectively, less able) will each of its members be to supplement public investment by private investment. For members of the majority, this will raise the benefits of exclusion, while lowering its costs. Hence the majority’s political support for society’s tolerance of social exclusion, in a democratic environment.
IV. Concluding Remarks
This paper seeks to contribute to the understanding of the political determinants of soci-eties tolerance for social exclusion on the basis of ethnicity, religion, or race. We developed a political-economic model where society’s degree of tolerance for social exclusion obtains as a political equilibrium under democratic voting. Echoing the existing economics literature on the effects of social exclusion, we find that indeed social exclusion is harmful to growth. On the issue of whether democratic voting can support the emergence of social exclusion as a political equilibrium, we find two types of answers depending on the context. More specifically, we find that in a context where ethnic, religious, or racial groups are either
symmetric in exclusion power–or, when they are asymmetric, the degree of inter-group asymmetry in exclusion power is relatively moderate–, then no group gains from support-ing tolerance of social exclusion. Only in societies where the inter-group asymmetry in exclusion power is sufficiently large, would the more powerful group gain from supporting tolerance of social exclusion. Our analysis therefore suggests that while democratic vot-ing in ethnically diverse societies with relatively low level of population group asymmetry in exclusion power can be sufficient to eliminate social exclusion, it may, in contrast, ac-tually generate social exclusion as a political outcome in societies where the inter-group asymmetry in exclusion power is sufficiently large.
Another important result of this paper is that the majority’s political support for social exclusion is increasing in its exclusion power. This exclusion power, in turn, is determined by the relative size of the minority, as the latter affects the cost to the majority of excluding the minority. Our analysis therefore suggests that an immigration policy aimed at reducing the majority’s exclusion power combines with the introduction of democratic voting to represent an effective weapon against social exclusion.
These results where obtained in a framework where investment in child’s human capital has two perfectly substitutable components: a private component controlled by the parent and a public component controlled by a government endowed with the power of taxation. This double sourcing of human capital inputs was the distinguishing feature of our model. With respect to Mark Gradstein [2003], this double sourcing allowed us to obtain persis-tence of social exclusion without appealing to within group human capital spillovers. With respect to Mark Gradstein and Maurice Schiff [2006], this double sourcing allowed us to endogenize the credibility of the threat of rebellion by the minority. Because of our focus on endogenizing the costs and benefits of social exclusion, we restricted attention to a case where the exclusion power of the majority is determined solely by its size. Consideration of income or wealth asymmetry either as an alternative source of exclusion power or as an important component of that power, in our opinion, would add no new qualitative insights to the analysis.
References
[1] Alesina, A., R. Baqir, and Easterly, W. (1999). “Public Goods and ethnic Divisions”. Quarterly Journal of Economics 114 (4), 1243-1284.
[2] Gary S. Becker, Kevin Murphy, and Robert Tamura (1990), “Human Capital, Fertility and Economic Growth”. Journal of Political Economy 98 (5), Part 2, S12-S37. [3] Easterly, W., and R. Levine. 1997. “Africa’s growth tragedy: Policies and ethnic
divisions.” Quarterly Journal of Economics 112: 1203—50.
[4] Esteban J., and Debraj Ray (1999). “Conflict and distribution”. Journal of Economic Theory 87, 379—415.
[5] Gradstein, Mark (2003). “The Political Economy of Public Spending on Education, Inequality, and Growth”. World Bank Policy Research Working Paper 3162.
[6] Glaeser, Edward L. (1994). “Why Does Schooling Generate Economic Growth?”. Eco-nomics Letters 44: 333-337.
[7] Gradstein, M. and Maurice Schiff (2006). “The Political Economy of Social Exclu-sion, with Implications for Immigration Policy”. Forthcoming, Journal of Political Economy.
[8] Gradstein M. and Moshe Justman (2002). “Education, Social Cohesion and Economic Growth”. American Economic Review 92 (4), 1192-1204.
[9] Montalvoa, Jose G, and Marta Reynal-Querol (2005). “Ethnic diversity and economic development”. Journal of Development Economics 76: 293— 323.
[10] Reynal-Querol, Marta (2004). “Does Democracy Preempt Civil War?”, European Journal of Political Economy. 21: 445-465.