Why are some children left out?
Why are some children left out?
Why are some children left out?
Factors preventing children from
Factors preventing children from
participating in extra
participating in extra--curricular activitiescurricular activities
Li Xu and Anne H. Gauthier June 2008
Why a study on
extra-curricular activities?
• a protective effect against deviant behaviour & early school dropout
• promotes positive outcomes in children and adolescents
• Complex pattern of effect: low SES or high risk children benefit more from extracurricular participation (McNeal
1998; Simpkins et al. 2005; Offord et al. 1998 )
• Low SES children have lower participating rate (Barsh and Kleiman, 2002; Bening
2007; Fredericks and Eccles 2006; Mahoney and Cairns 1997)
Findings about
Limitations in previous study of
children’s extracurricular
participation
• Focus on adolescents, little research on younger children
• Focus on outcomes, little research on factors
• Factors pointed out by previous studies to influence participation
– Child gender (individual child level) – Ethnicity/Race (individual child level) – Parent SES (family level)
– Neighborhood characteristics (Neighborhood level)
– Studies rarely include factors at all three levels into analysis
Analytical model
Parent’s time availability (e.g. mother’s employment status, number of children, single-mother)
Financial resources Parent’s human capital
Neighbourhood environment (e.g. available infrastructure, safety and peer influence, playmates)
Participation in extra-curricular activities
Child characteristics
Age, gender and ethnicity
Ethno-culture (immigrants)
DATA: National Longitudinal
Survey of Children and Youth
(NLSCY)
• Started in 1994-5 with 22,831
children 0-11 years old followed
every two years
• Questions regarding children were
collected from the PMK (Person Most
Knowledgeable about the Child. In
Sample of this study
• Cycle 2-4 (1996/7 - 2000/01)
• longitudinal children of 4-5 years old in cycle 2 (N=2,289) 6-7 in cycle 3 and 8-9 in cycle 4
(randomly selected one child per household & PMK same)
• Sample attrition
– Cycle 2: 2,289 – Cycle 3: 2,090 – Cycle 4: 1,797
• Weights: longitudinal weights at cycle 2
A few facts about
extra-curricular activities in Canada…
69 70
68 At least one of above
organized activities 24 29 20 Clubs/community 18 23 14 Art/music 28 33 23 Dance/gym 63 59 67 Unorganized sport 48 43 53 Organized sport Total (%) Girls(%) Boys(%) Activity
Prevalence of regular participation
Analytical model
• Generalized estimation equation
(GEE)
– Takes into account of correlation of repeated measurements of outcomes – Allows both invariant and
Dependent variables
• “In the past 12 months, outside of school hours, how often has [child]…”
– taken part in sports (except dance or gymnastics) with a coach or instructor?
– taken lessons or instruction in other organized physical activities with a coach or instructor such as dance,
gymnastics or martial arts?
– taken part in unorganized sports or physical activities without a coach or instructor?
– taken lessons or instruction in music, art or other non-sport activities?
– taken part in any clubs, groups or community programs with leadership, such as Beavers, Sparks or church groups? (4-5 years old) Brownies, Cubs or church groups? (6-9 years old)
Dependent variable
categories
Original 1. Most days: 2. A few times a week3. About once a week 4. About once a month 5. Almost never In our model: regular participation =1 Rare or never participation =0
Independent variables: family level
Parent time availability
– PMK employment status (full-time (ref)/part-time/did not work)
– Family structure: two parents intact (ref)/two parents other/single parent – Number of children (1, 2, 3, 4+) (ref: 1) – PMK depression scale (0-36)
• Financial resources
– Household income adequacy (4 categories; ref: lowest and low)
Independent variables: family
level
• Parents education and cultural values – PMK education: less than secondary
(ref), secondary school graduation, beyond high school and college or university degree
– PMK immigrant (non-immigrant (ref)/immigrant)
Independent variables:
Neighborhood level
• Available infrastructure and
available play mates
- dwelling types: house (ref)/duplex & apartment/other
- rural/urban residence (re: urban)
• Safe environment and peer influence
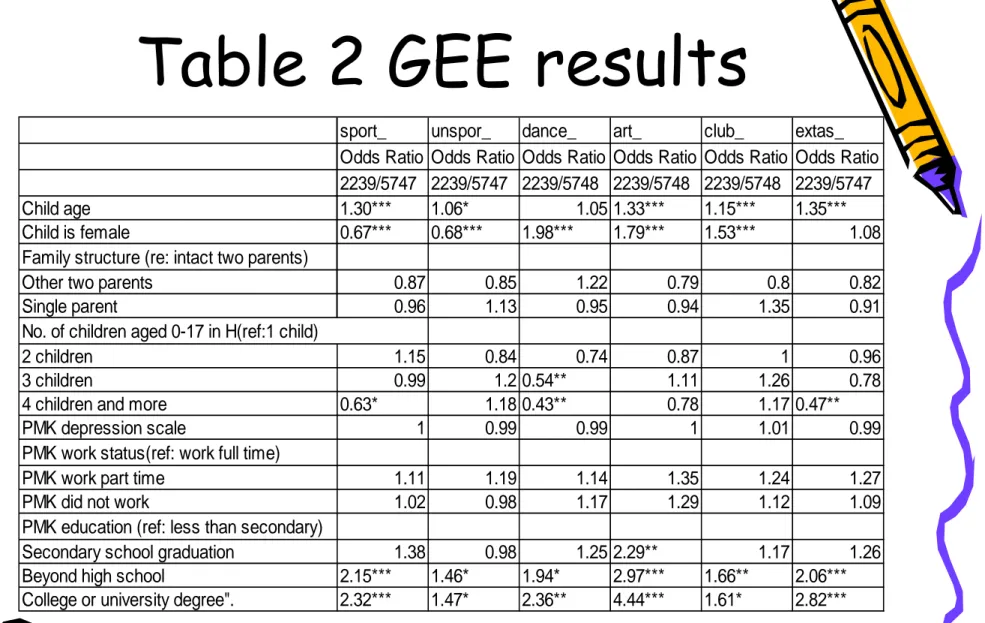
Table 2 GEE results
sport_ unspor_ dance_ art_ club_ extas_ Odds Ratio Odds Ratio Odds Ratio Odds Ratio Odds Ratio Odds Ratio 2239/5747 2239/5747 2239/5748 2239/5748 2239/5748 2239/5747 Child age 1.30*** 1.06* 1.05 1.33*** 1.15*** 1.35*** Child is female 0.67*** 0.68*** 1.98*** 1.79*** 1.53*** 1.08 Family structure (re: intact two parents)
Other two parents 0.87 0.85 1.22 0.79 0.8 0.82 Single parent 0.96 1.13 0.95 0.94 1.35 0.91 2 children 1.15 0.84 0.74 0.87 1 0.96 3 children 0.99 1.2 0.54** 1.11 1.26 0.78 4 children and more 0.63* 1.18 0.43** 0.78 1.17 0.47** PMK depression scale 1 0.99 0.99 1 1.01 0.99 PMK work status(ref: work full time)
PMK work part time 1.11 1.19 1.14 1.35 1.24 1.27 PMK did not work 1.02 0.98 1.17 1.29 1.12 1.09 PMK education (ref: less than secondary)
Secondary school graduation 1.38 0.98 1.25 2.29** 1.17 1.26 Beyond high school 2.15*** 1.46* 1.94* 2.97*** 1.66** 2.06*** College or university degree". 2.32*** 1.47* 2.36** 4.44*** 1.61* 2.82*** No. of children aged 0-17 in H(ref:1 child)
sport_ unspor_ dance_ art_ club_ extas_ Odds Ratio Odds Ratio Odds Ratio Odds Ratio Odds Ratio Odds Ratio Household Income adequacy (ref: lowest)
Middle: 1.74* 1.23 1.58* 2.06** 1.42 1.83** Upper middle 2.29*** 1.31 2.27*** 3.27*** 1.38 2.95*** Highest 4.16*** 1.4 2.79*** 3.89*** 1.67* 5.45*** Dwelling types (ref: houses)
Duplex and apartment 0.8 0.8 0.74 0.9 0.60* 0.84 Other types 0.45** 1.14 0.56 0.49 0.87 0.38*** Rural residence (ref:urban) 0.83 1 0.73* 0.86 0.81 0.83 Province (ref: Quebec)
Atlantic 1.19 0.89 0.7 1.24 10.00*** 0.96 Ontario 1.52* 1.07 0.98 1.33 5.26*** 1.45* Prairie 1.54** 1.15 1.06 1.7** 6.27*** 1.55* British Columbia 1.98*** 1.53* 1.52 1.49 8.02*** 2.00** Non-white child 1.05 0.57* 0.7 2.05* 0.53* 0.84 PMK immigrant 0.53** 0.68 1.48 0.71 0.73 0.96 *p < .05. **p < .01. ***p < .001.
Summary of the results
• Financial resources (Income adequacy): children from poorest families are most disadvantaged
– organized sport: (+) strong: OR: 1.7, 2.3, 4.2 – dance/gym (+) strong
– art/music (+) strong
– clubs/community (+) week
Summary of the results
• PMK education: (+) large positive effect for categories starting with “some post secondary” for all activities
• Education: largest for “art and organized sport”, smaller for unorganized sport and clubs/community
Summary of the results
• Time availability
– PMK employment: not significant – Family structure: not significant
– Number of children: (-) for 3 or more and 4 or more children for organized sport and dance/gym
Summary of the results
• Child ethnicity: non-white
– (-) unorganized sport (OR 0.57) – (-) club/community (OR 0.53) – (+) for art (OR 2.05)
• PMK immigration status: immigrant
Summary of the results
• Rural residence: (-) for dance/gym • Dwelling types:
– Organized sport: Other types (-)
– Club/community: Duplex & apartment (-)
• Province/region:
– In general QC has lower likelihood of participation of most activities,
– Club/community: participation in QC is lower than all other regions
Supplement model:
add average neighbourhood
household income
• Effect of average family income of the neighbourhood (EA)
– Significant positive effect for organized sport (+)
– Effect of family income does not chane
– Possible mechanism: peer influence, safety concern, availability of infrastructure
– Caution: there might be “artificial” changes of EA
Discussions
• Socio-economic division manifests in
child after-school activities
• Income barriers are important:
implication for the Fitness Tax
Credit program:
• Independent effect of parent
education
• Immigration status and ethnic origin:
on some activities
Limitations
• extracurricular activities include both school-based and non-school based
• community/club activities include wide range of activities
• Insufficient cases for more detailed analysis of ethno-cultural differences
• No variables directly capture the values and attitudes towards extracurricular activities
Descriptive statistics at cycle 2
(weighted) (total unweighted cases: 2289)
variables Categories Cycle 2 Organized sport almost never & about once a month 67.88
at least once a week 32.12 Unorganized sport almost never & about once a month 41.95 at least once a week 58.05 Dance/gym almost never & about once a month 73.85 at least once a week 26.15 Art/music almost never & about once a month 91.12 at least once a week 8.88 Club/community almost never & about once a month 82.27 at least once a week 17.73 At least one (sport+dance+art) Did not participated any 53.15 Participated at least one 46.85 Child sex male 49.54 female 50.46 Child race none white 8.75 white 91.25 PMK immigration status not immigrant 85.38 immigrant 14.62 Province/regions Atlantic 7.95 Qu ec 24.41 Ontario 37.16 Prairie 18.72 British Columbia 11.76
Table 1 (cont’d)
variables Categories Cycle 2 Household income adequacy lowest and lower 20.53
middle 29.27 upper middle 33.89 highest 16.31 Family structure intact family 73.83 not intact but couple census family 7.76 other-single parent family 18.4 Dwelling types single, semi-detached, garden house 81.51 duplex,low-rise apt.,high-rise apt. 15.87 other 2.63 Rural/urban non-rural 87.3 rural 12.7 PMK depression scale 0-10 4.78 Children 0-17 in household 1 18.81 2 46.94 3 22.97 4 11.28 PMK work status worked full time 45.84 worked part time 23.06 did not work 31.1 PMK education less than secondary 11.47 secondary school 18.5 beyond high school 28.79 college or university degree 41.24