HAL Id: hal-00526281
https://hal.archives-ouvertes.fr/hal-00526281
Preprint submitted on 15 Oct 2010
HAL is a multi-disciplinary open access archive for the deposit and dissemination of sci-entific research documents, whether they are pub-lished or not. The documents may come from teaching and research institutions in France or abroad, or from public or private research centers.
L’archive ouverte pluridisciplinaire HAL, est destinée au dépôt et à la diffusion de documents scientifiques de niveau recherche, publiés ou non, émanant des établissements d’enseignement et de recherche français ou étrangers, des laboratoires publics ou privés.
Véronique Flambard, Nicolas Gérard Vaillant, François-Charles Wolff
To cite this version:
Véronique Flambard, Nicolas Gérard Vaillant, François-Charles Wolff. Dating as leisure. 2010. �hal-00526281�
EA 4272
Dating as leisure
Véronique Flambard (*)
Nicolas Vaillant (*)
François-Charles Wolff (**)
2010/24
(*) LEM – FLSEG – Université Catholique de Lille (**) LEMNA – CNAV – INED – Université de Nantes
Laboratoire d’Economie et de Management Nantes-Atlantique Université de Nantes
Chemin de la Censive du Tertre – BP 52231 44322 Nantes cedex 3 – France www.univ-nantes.fr/iemn-iae/recherche Tél. +33 (0)2 40 14 17 17 – Fax +33 (0)2 40 14 17 49
D
o
cu
m
en
t
d
e
T
ra
va
il
W
o
rk
in
g
P
ap
er
DATING AS LEISURE
Véronique FLAMBARD
LEM (UMR 8179 CNRS) and Université Catholique de Lille (FLSEG) 60 bd Vauban, BP109, 59016 Lille Cedex, France.
E-mail : [email protected]
Nicolas VAILLANT
LEM (UMR 8179 CNRS) and Université Catholique de Lille (FLSEG) 60 bd Vauban, BP109, 59016 Lille Cedex, France.
E-mail : [email protected] http://ngvaillant.e-monsite.com/
François-Charles WOLFF
LEMNA, Université de Nantes; CNAV and INED
BP52231 Chemin de la Censive du Tertre, 44322 Nantes Cedex, France.
Introduction
Becker’s analysis of marriage (1973, 1974) is built on the hypothesis that the social process by which men and women meet is a market phenomenon, implying both material and psychological gains for (potential) partners. This market, frequently referred to the “marriage market”, can be analyzed by defining social relationships as a special case of consumer behavior. Levy and Zaltman (1975) have termed exchanges on this market “intimate marketing”. One of the most cited papers on this issue is that of Hirschman (1987), who analyzed the behavior of advertisers using “lonely hearts” columns. Hirschman’s analysis of dating advert users explores the role of consumption in human courtship and the idea of “marital exchange” through the developments of the theory of resource exchange (Foa, 1976). Hirschman deals with the demand for partners in terms of the Lancaster’s economic theory of consumer behavior (1966). Each potential partner is treated as a bundle of characteristics, including age, level of education, physical appearance and intelligence among others. Consumption of these characteristics during the dating process will, to some extent, be a form of leisure.
Becker’s seminal analysis of marriage (see Grossbard-Shechtman, 1995, 2003) has been followed by a number of works looking at the economics of the partner selection process more generally. There is empirical work on personal advertisements by Cameron and Collins (1997, 1999, 2000a, 2000b) and on marriage bureaux- Le Guirriec and Vaillant (2005), Cameron and Vaillant (2006). Using data from a speed-dating experiment, where random matching of subjects were generated, Fisman et al. (2006) show that women put greater weight on the intelligence and race of partners, while men respond more to physical attractiveness. Moreover, men do not value women's intelligence or ambition when it exceeds their own and women exhibit a preference for men who grew up in affluent neighborhoods. Finally, male selectivity is invariant to group size, contrary to female selectivity. In another
contribution, Fisman et al. (2008) extend their findings by examining racial preferences in dating. Gender, but also subjects’ backgrounds, age and physical appearance seem to affect racial preferences.
Partner selection occurs naturally and informally, but it may also be organized through commercial intermediaries facilitating mating and dating (Quah, 1990, Vaillant, 2004a). According to Ahuvia and Adelman (1992), people who use commercial intermediaries do so in exchange for three services: i) searching, i.e. defining who are potential mates; ii) matching, i.e. obtaining information about the potential right partners; and iii) interaction, i.e. interacting in order to form or reject a relationship. Matchmaking agencies, personal advertisements and online dating services allow individuals to reduce the extensive costs of mate search, by locating easily potential partners (Vaillant, 2004b). Therefore, weighting costs and benefits, individuals with a relatively high income level experience substantial opportunity costs by searching for the right mate (Gronau, 1977). They are more likely to use commercial intermediaries to reduce them, except if their high opportunity cost is more than compensated by a rich social life. Indeed, networks increase their pool of potential partners, especially when they seek partners with similar professional characteristics (Batabyal, 2001).
Furthermore, people who are characterized by features of low market value, or people who are picky about their prospective partners are more likely to buy matchmaking services of one sort or another. Speed-dating drastically reduces searching and matching costs, by eliminating a large amount of leisure interaction per date. Moreover, it greatly increases the number of dates per unit of effort. It might then be aimed at increasing the efficiency of dating leisure by attempting to increase matching.
Recent institutional, technical and social changes have altered the pool of individuals looking for dates, at all ages and at different moments in their lives (Stevenson and Wolfers, 2007). In particular, the rise in household appliances over the last century have made leisure
and consumption complementarities more important drivers of couple matching than the production capabilities emphasized by Becker (1981). Gould and Paserman (2003) argue that rising wage inequalities have increased the return of a partner search and decreased the value of remaining unmarried. Caucutt et al. (2002) claim that rising returns to labor market experience raise the incentive for highly educated women to develop stronger prospects in both the labor and marriage markets.
With the increasing value of the search of a partner, online dating becomes more and more attractive. David Evans, an online dating consultant, estimates at 30 million the number of persons that will log on in 2009 to one of the 1500 estimated online dating services in the United States. European Internet users are far more engaged in online dating than those in North America. According to ComScore World Metrix, 18 percent of European Internet users (38.2 millions) visit online personals sites each month (in 2006). France, Germany and England represent the largest market shares. According to JupiterResearch, online dating services are the third largest attractor in Internet users for paid content, after music and games, earning ten percent of the online audience in 2007. Online search offers a larger set of potential partners and anonymity than offline search. Those facing difficulties meeting potential mates are more likely to use Internet. Online search also allows for the selection of partners with similar leisure preferences (for example, with the use of conditions “must love travel”).
Clearly, people using online services may be distinguished according to at least two categories: candidates for marriage who are involved in mating rather than dating on the one hand, i.e. people who are trying to “invest” in marriage; individuals who have short-run intentions on the other hand, i.e. people trying to “consume” human relationships. Thus, the continued existence of online dating services simply reaffirms that it meets the needs of individuals of both categories.
From an economic viewpoint, time devoted to dating can be analyzed either as a cost for individuals who are searching to marry, or reciprocally as a consumption good for dating consumers, insofar as this activity provides in itself satisfaction. In the first case, the cost can be both explicit, subscriptions to an online site or restaurant expenses for example, and implicit (since time spent on dating cannot be devoted to paid work (it is leisure time). In the second case, dating is consumption good, a form of leisure. Of course, other activities can serve as substitute or complement to dating activities (such as social networks, hotline, sex toys, porn movies…), but their impact on dating is not discussed here.
In this chapter, we specifically consider individuals who express a demand for dates. The remainder of our text is organized as follows. In the next Section, we present a theoretical model of dating behavior explaining why improved economic conditions may have ambiguous effects on dating. We turn to an empirical analysis in Section 2. Using a vector error correction model and original French time series data, we investigate the relationship between online dating, the economic sentiment (a proxy for economic wealth and people confidence in the future) and decrease in dating opportunities (measured by the lagged fertility rate). Concluding comments are in Section 3.
1. The economics of dating
To explain optimal investment in dating activities by individuals, we turn to the expected utility theory and consider a simple microeconomic model of time allocation à la Gronau (1977). Dating is viewed as an additional possible time use, which extends the usual tradeoff between leisure and working activities. The model could be modified to consider not only the implicit cost of dating (time), but also the associated expenses. Here, instead the latter are pulled with private consumption without allowing any distinction on marginal utility for different expenses. For example, one euro spent on a movie or visit to the theatre may (or
may not) bring the same marginal utility than one euro spent in a bar, but here the marginal utility is treated as identical.
1.1. The model
We assume that there are only two states of the world in our model: either the representative agent is successful in meeting singles (state s), or he/she is unsuccessful (state
u). Let q be the probability of the « bad » outcome, so that 1 q is the probability associated to s. Whatever the outcome, the individual level of utility U is expected to depend on his/her level of private consumption C , on leisure l and on the number of potential partners met (D or u s
D ). We denote respectively Us(C,l,Ds) and Uu(C,l,Du)the individual utility functions in both states1. The individual’s expected level of utility EU may be expressed as: ) , , ( . ) , , ( . ) 1 ( q Us C l Ds q Uu C l Du EU (1)
We assume that the numbers of meetings in successful and unsuccessful situations (respectively D and s D ) are affected by time spent in dating activity. We rely on the u
following parametric specification:
Ds n0 N(d) (2)
D
un
0 (3)where n0 is an exogenous variable reflecting the number of random meetings, independently on the effort of the agent.
1
With more time spent in dating (denoted by d ), the individual is expected to meet more potential partners. We rely in the sequel on decreasing returns for these dating activities, i.e. the dating technology is concave (N' 0 and N '' 0).
Let us now turn to the individual resources constraints. First, the total amount of time
T is devoted to hours of work h , leisure l and dating activities d , so that T h l d. Second, there is the standard budget constraint such that the individual devotes his/her income to private consumption C (prices being normalized to one). There are two sources of earnings: labor income w.h, with w the hourly wage rate, and an exogenous non-labor income Y (including bequests or public transfers for instance)2. From the corresponding constraint C w.h y and using the time constraint, we get the following full-budget constraint: y T w d w l w C . . . (4)
The maximum attainable level of income is given by w.T y Y. From (4), it is clear that the opportunity cost of one hour spent in dating activities and the opportunity cost of leisure are similar, given by the wage rate.
The problem for the consumer is hence to maximize his/her expected utility level by choosing the amount of time to spend in dating and leisure. Formally, the optimization problem is: ) , , . . ( . )] ( , , . . [ . ) 1 ( max , EU q Us Y w l w d l n N d q Uu Y w l w d l n d l (5)
In what follows, we denote by UiS and Uiu respectively the first-derivative of the 2
individual utility function, evaluated respectively at D and s D with respect to the u ith
argument, with i 1,2,3. The utility functions are supposed to be strictly quasi-concave, i.e.,
0
S i
U , Uiu 0 and UiiS 0, Uiiu 0 (with i 1,2,3). We further assume some complementary between private consumption and the time inputs ( 1 0
S i U , 1 0 u i U , i 2,3),
but some substituability between the time inputs l and d (U23s 0, U23u 0). The corresponding first-order conditions EU/ l 0 and EU/ d 0 are:
0 ) . ( . ) . ( . ) 1 ( q wU1s U2s q w U1u U2u (6) 0 ) . ( . ) ' . ( . ) 1 ( 1 3 1 u s s U w q U N U w q (7)
The interpretation of these conditions is as follows. From (6), the marginal expected cost of one hour of leisure in terms of foregone income (1 q) w U1s q w U1u is equal to its marginal expected benefit (1 q).U2s q.U2u since utility is increasing with leisure. From (7), the marginal expected cost of one hour spent in dating activities (1 q) w U1s q w U
1
u
is equal to its marginal expected benefit (1 q).N'U3s. Combining (6) and (7) leads to:
s u s U N q U q U q).( 2) . 2 (1 ). ' 3 1 ( (8)
Equation (8) means that the marginal expected benefit from one hour of leisure
u
s qU
U
q).( 2) . 2 1
( should be equal to the marginal expected benefit from one hour spent in dating activities (1 q).N'U3s at the equilibrium. When this equality does not hold, a better outcome can be reached by reallocating time between leisure and dating.
1.2. Economic conditions and dating
We are interested in the comparative static properties of the model in order to know the impact of a change in the exogenous income Y and the wage rate w on both the optimal amounts of leisure and dating. From the second-order derivatives, it can be shown that the derivatives d / Y and d / w can be either positive or negative. As in standard models of time allocation, the impact of a change in the individual level of income on dating activities will be given by the sum of a substitution effect and an income effect.
Consider an agent with little economic resources and consider an increase in his/her wage rate. The substitution effect will first dominate and the individual will increase his/her number of hours worked. This mechanically reduces time devoted to dating, especially if dating and other leisure are complementary goods. Now, with a substantial rise in income, the income effect is expected to be larger than the substitution effect. The additional utility gained from an extra hour of dating become greater than the utility derived from the additional income earned, and more effort will be devoted to dating activities. Note that this marginal benefit also depends on the effectiveness of the dating activity, measured through the shape of the dating technology N(.).
The relationship of online dating with the business cycle is not documented either. During a recession, people tend to rethink their priorities. It is true in business, but also in the personal live sphere. The need to get through it together, to feel part of a community, to create social and affective links, can be stronger in difficult periods. Moreover, for those looking for a mate, the perspective of income and risk pooling may also be an incentive during economic slowdown. In an article published in the New York Time, Ellin (2009) reports that dating interest is up, both with online and offline matchmakers, during the fourth quarter of 2008 (in a recession). Schwartz, a professor of sociology and the relationship expert at
perfectmatch.com, reports a 51 percent increase in new members in the fourth quarter of 2008 compared to 2007. During the previous economic downturn in 2001, a similar increased interest for dating was observed. With the average cost of offline dating being higher than the monthly cost to online dating, both the substitution and income effects tend to encourage online dating compared to dating during hardship. Unemployed and underemployed people, with more time on their hands, can devote more time surfing the web.
At the same time, it is also possible that during economic recession, people feel less confident and that, as a result, socialization and in particular dating are less successful. Dating (online or otherwise) may hence be correlated in a complex way with the income level as we just discussed, but also with the level of uncertainty, the attitude of people and their confidence. It follows that the sign of the correlation between the business cycle and online dating remains ambiguous even if anecdotal evidence suggests a negative correlation between online dating and the wealth of the economy.
2. The empirical model
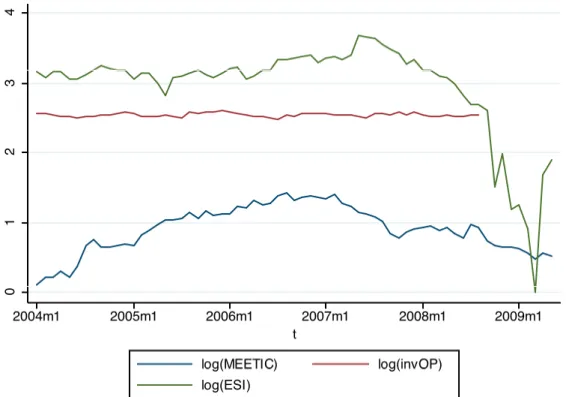
Our empirical analysis is based on a time series analysis. We use a French monthly dataset covering the period from January 2004 to August 2008 (56 observations). Specifically, we focus on the relationships between demand for dating (MEETIC), economic sentiment (ESI) and a proxy of the decrease in dating opportunities (measured by the lagged fertility rate denoted invOP) in France.
In order to test the relationship between online dating and income, one could use micro data with information on time (and more generally financial resources) allocation between work, consumption and dating as well as information about wealth and labour income. Such data have never been collected as far as we know. Alternatively, we may rely on macro data, which will be relevant to assess the relationship between confidence and the business cycle. By adding other variables, we could extend the analysis to other covariates. For example, it would be interesting to study the link between dating interest, confidence and sexual health (STIs, HIV, AIDS, pregnancies). Using data from the San Francisco Stop Aids Project, Geoffard and Méchoulan (2004) show that improvements in treatments against HIV (in 1996) provoked an increase in the risk level, by diminishing the cost associated with risk for those individuals who have opted for testing. Therefore, although they studied the relationship between sexual health and one aspect of confidence (confidence in physicians competence which may also maybe reflect a general form of optimism), they did not study the relationship with dating interest. Such a work will be interested to carry on.
Existing surveys provide some descriptive statistics, but do not offer any analysis and explanations. For instance, the Durex Sexual Well being Global Survey presents findings from 26 countries every year, investigating people's attitudes to sex. Since 2005, Durex Company also publishes yearly reports called “Face of global sex”, with a different question each year. In 2008, directly relevant to a study that would investigate confidence, dating interest and sexual health, the focus was on confidence. A sexual confidence scale assesses confidence aspects of sexual health (avoiding STIs/HIV/AIDS and pregnancy) as well as other dimensions of confidence, i.e. sexual fulfillment and where to find guidance on various sexual issues.
The variable MEETIC was built using http://www.google.fr/trends, which counts the number of times the word “MEETIC” has been searched on google over one month period. “Meetic” is the dating site by far the most viewed in Europe and France3. Interestingly, the use of online web search queries, submitted daily by millions of users around the world, is employed by public health specialists to monitor health-seeking behavior. Indeed, the relative frequency of certain queries (for example, cough) is highly correlated with the percentage of physician visits for that condition (that is to say, for cough in the example).
Economic conditions are captured by the economic sentiment indicator of consumers from the “Joint Harmonised EU Programme of Business and Consumer Surveys” (see http://ec.europa.eu/economy_finance/db_indicators/surveys/documents/userguide_en.pdf). About 40 000 consumers are currently surveyed across the EU. Answers obtained from these questions are aggregated in the form of “balances” which are constructed as the difference between the percentages of respondents giving positive and negative replies. The Commission calculates confidence indicators as arithmetic means of answers (seasonally adjusted balances) to a selection of questions related to the confidence indicator they are supposed to monitor. Sentiment indices are widely believed to have predictive power for the performance of the macroeconomy. Some empirical support for this belief is provided by research findings, which indicate that the sentiment index contains information about future changes in the economy beyond what is contained in past values of other available indicators (Carroll et al., 1994, Ludvigson, 2004).
Finally, dating also depends on the opportunities of success (correlated with the number of people looking for a date). As a proxy for the decrease opportunities of dating (invOP) in France, we use the t-9 month rate of fecundity. We can reasonably think that a
3
See http://www.businessweek.com/bwdaily/dnflash/feb2005/nf2005028_4806_db089.htm or for a more recent source: http://www.onlinepersonalswatch.com/files/meetic_res-q309_vfengfinale.pdf .
woman who is pregnant is less likely to look for a date. Therefore, when the share of pregnant woman increases, the share of single women looking for a date is decreasing. This proxy variable does not take into account the proportion of male that are available, but since two persons are needed for a date, it is related to the availability of possible matches. It should be kept in mind that this remains only an approximation. According to data from Forrester Research, over one-third of those using online dating are currently married. Hence, we cannot rule out that some of them may be married with women that are expecting a baby.
All of the variables were expressed as logarithms and seasonally adjusted. Note that we add +38 to each observation of the economic indicator, insofar as it presents negative values (min(ESI)=-37). Figure 1 depicts the evolution of the various variables.
[Insert Figure 1 about here]
When studying times series, we need to know first of all if the variables are integrated or not. If they are integrated of the same order, a stable long-run relationship may exist which can be taken into acount using error correction models. We therefore apply tests of unit roots to establish the order of integration in each of the four variables. Specifically, we turn to the unit root test developed by Phillips and Perron (1988). Basically, the Phillips–Perron test is a modification of the standard test proposed by Dickey and Fuller (1979). The Phillips–Perron test estimates the Dickey–Fuller test and modifies the t-ratio of the unit root coefficient so that serial correlation does not affect the test statistic. Table 1 presents the results for the unit root test for a model with an intercept.
The variables log(MEETIC) and log(ESI) appear to be non-stationary in levels, and stationary when differenced. In other words, we can conclude that these series are integrated of order one (I(1)). The Phillips–Perron on the variable log(invOP) rejects the existence of a unit root. We thus conduct a Dickey-Fuller GLS test, which is a modified Dickey-Fuller t-test for a unit root in which the series have been transformed by a generalized least-squares regression. The DF-GLS statistic for the series does not exceed the critical values in absolute terms at the 1% level of significance (-2.36>-2.62). When we take the first difference of each variable, it does, which means that log(invOP) is integrated of order one (or I(1)).
2.3. A VECM approach
The results described above indicate that there may be one or several stable long-run relationships between the variables and that we should test for cointegration before specifying the multivariate model. The concept of cointegration was formalized by Engle and Granger (1987). We say that variables are cointegrated when we can form a linear combination of them that is stationary, this linear combination can be considered as a long-run relationship between the variables. If one or several cointegrating relationships are identified in a multivariate system, the long-run relationship can be included as error correction terms in the vector autoregressive setup. Engle and Granger (1987) and Johansen (Johansen, 1988, Johansen and Juselius, 1990) tests can be used to determine the number of relations of cointegration. The latter is often preferred due to its one-step approach and its ability to handle more than one cointegrating relationship. Another drawback with the original Engle and Granger test is the importance of the choice of dependent variables. In the Johansen test, it is assumed that all variables are endogenous and the test is therefore not sensitive to structure choice.
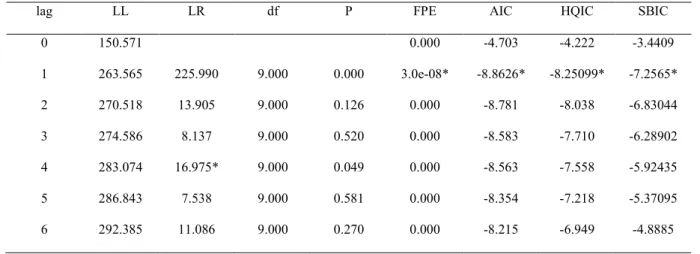
Before performing the Johansen procedure, it is necessary to specify the lag length of the vector auto-regressive model. The results of diagnostic tests proposed by Sims (1980) are shown in Table 2.
[Insert Table 2 about here]
The final prediction error (FPE), the Schwarz’s Bayesian information criterion (SBIC), the Hannan and Quinn information criterion (HQIC) and the Akaike's information criterion (AIC) indicate vector autoregressions of order 1, whereas the likelihood-ratio test statistics (LR) concludes to a four lag-order. Both lag 1 and lag 4 will be considered in the Johansen procedure, but we only report the results for four lags. The Johansen procedure produces Trace and Maximum Eigen-value tests presented in Table 3 from which the number of cointegrating vectors can be identified. We proceed sequentially by first testing for H0: r
0, with r the number of cointegrating vectors. If H0 is rejected, we then test for r 1 and so
on until the null hypothesis could not be rejected.
[Insert Table 3 about here]
The Johansen procedure clearly rejects the null hypothesis of zero cointegrating vector against the alternative, at both 1% and 5% levels when considering only one lag in the underlying VAR model (results are not presented). Table 3 indicates that the null hypothesis of no cointegration relation cannot be rejected at 1%, but is rejected at 5% in favor of at most one statistically significant cointegrating vector. Considering the results of the Johansen procedure that rejects the null hypothesis of no cointegration relation at 5% (with one or four lags), we will consider a model with four lags and one relation of cointegration.
The dating equation is identified by normalizing the estimated coefficient on log(MEETIC) to 1. The estimated relation of cointegration is (with standard errors in parentheses under the coefficients) :
log MEETIC 124.72 2.97
0.073 log ESI 44.600.000 log invOP (9)
where the vector of coefficients represents the cointegrating vector defining the linear combination of variables that are I(0). There can be described as long-run equilibrium.
First, the dating demand is negatively related both to the economic sentiment and the fertility rate, which indicates that it is positively related with the number of potential partners. The estimated coefficient associated to log(ESI) indicates that a 1% increase in ESI will decrease the demand for dating by 3% in the long run. When people are more confident in the economy and have more income, they tend to spend less time on meetic. On the contrary, during economic downturns, they appear to increase their demand for online dating.
Our results are consistent with anecdotal evidence suggesting that some people have more time to invest in online dating (those that are not employed full time) and that the marginal utility of dating increases during economic recession (“people want to go through it together”). Besides, the dating demand increases with the number of potential partners : the latter raises the marginal utility of dating, which can explain why it becomes more attractive to invest in dating4.
The next stage consists in studying the nature of the short-run relationship using a VECM. In this representation, short-run fluctuations are represented with the lagged first differences. Any changes in the dependent variables are a function of the level of disequilibrium in the cointegration relationships (measured with the error correction term ect):
4
Meetict aMeetic bi, Meetic i 1 4 Meetict i ci, Meetic i 1 4 ESIt i di, Meetic i 1 4 invOPt i eMeeticectt 1 1t (10)
invOPPt aMeetic bi,invOPP i 1 4 Meetict i ci,invOPP i 1 4 ESIt i di,invOPP i 1 4 invOPt i einvOPPectt 1 2t (11)
ESIt aESI bi, ESI
i 1 4 Meetict i ci, ESI i 1 4 ESIt i di, ESI i 1 4 invOPt i eESIectt 1 3t (12)
where ectt-1 is the lagged error correction term and the vector e represents the weight or
adjustment speed. In other words, it measures how fast the stationary variable ectt-1 feedbacks
onto the system. The t are serially independent errors with mean zero and finite covariance matrix.
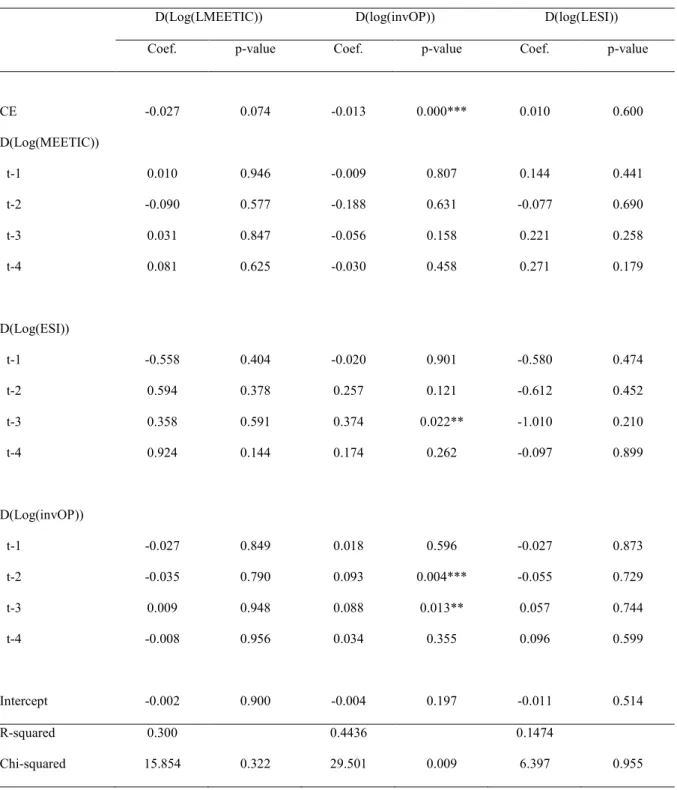
[Insert Table 4 about here]
Table 4 presents estimates of the short-run equations (10), (11) and (12). We can observe that the demand for meetic and the fertility rate appear to be the variables that adjust to any disequilibrium from the long-run relation (through the error correction term) at the previous period. Standard Granger-type causality tests can be performed in an ECM. Following Granger (1969), ESI causes InvOP if the prediction of InvOP is improved when including past values of ESI than when not including them. In the short-run, the t-test applied to the lag of each explanatory variable in each of the three equations indicates the statistical significance of the short-run causal effects (and the strict Granger exogeneity or endogeneity of the dependent variables).
Here, the variable ESI is deemed to cause InvOP if one or more of the lagged coefficient of ESI is statistically different from zero. Our data suggests that this is indeed the case. In other words, when economic agents are optimist about the economy, the fertility rate tends to increase and the opportunities of dating falls. The other variables appear to be strictly exogenous to each other. Again, this result is robust to other specifications, for instance the one including a model with one lag and one cointegration relation.
3. Discussion and concluding comments
With some exceptions, little attention has been paid to the question of time devoted to a partner choice. However, recent institutional, technical and social changes have altered the pool of individuals looking for dates, at all ages and at different moments in their lives. It should renew the interest for research on partner choices and the time devoted to it.
Search models, risk-pooling models and expected utility models of arbitrage between working time and leisure focus on different dimensions of choice of the individual. In particular, the first two can explain the different mechanisms that tend to extend the search period and that modify the costs and benefits of marriage (or cohabitation). Rising returns to labour market experience raises the incentive for highly educated women of search to develop stronger prospects in both the labor and the marriage market. If individuals view marriage as an insurance against income risks, those who are more risk tolerant will accept to delay marriage. But clearly, not all people using online services are looking for a life partner. The motivations are therefore very different from the ones just traditionally analyzed. To take into account both forms of dating, we use a model where the time has to be allocated between leisure and work. We have chosen to explore this last dimension, which was yet to be explored, by focusing on one growing form of partner search: online dating.
In this work, we seek to understand the relationship, if any, between dating and the business cycle, and more exactly between online dating and the business cycle. Online search offers a larger set of potential partners and anonymity than offline search. Moreover, it is likely to become more attractive in an economic recession as the former appears as a cheaper substitute to the latter.
We rely on a simple microeconomic model of time allocation. Dating is viewed as an additional possible time use, which extends the usual tradeoff between leisure and working activities. As in standard models of time allocation, the impact of a change in the individual level of income on dating activities is given by the sum of a substitution effect and an income effect. Hence, in general, we cannot predict the direction of the effect of a change in the economic sentiment on the demand for dating. In simple microeconomic models where workers are supposed to choose their hours, the relationship between time devoted to dating and income should be U-shaped. What should happen then in aggregate under real world conditions? From our own viewpoint, additional issues should lead to a much more complex, undetermined relationship. As a matter of fact, the marginal utility of dating for an individual also depends on the effectiveness of the dating activities, on its risk aversion, on its own risk of income variation and on its desire to pool risk with a mate among other factors.
The economic theory is therefore not able to predict the effect of a recession for the industry of online dating, as we could for a traditional normal good or inferior good. It is therefore interesting to explore empirically this question and to study whether, as reported in newspapers, economic recession tend to stimulate the online dating industry on the aggregate. For that purpose, we have used monthly observations covering the period from January 2004 to August 2008 on the demand for online dating in France through the MEETIC website, on the economic sentiment (ESI) and on a proxy of the rate of missed opportunities of dating (invOP) in France through the lagged fertility rate. The results are as follows. The
three series are integrated of order one. One relation of cointegration is identified, which can be described as a long-run equilibrium between the three variables. The dating demand is negatively related to both the economic sentiment and the fertility rate. So, during economic downturns, people appear to increase their demand for online dating, which is consistent with anedoctal evidences suggesting that some people have more time to invest in online dating and that the marginal utility of dating increases during economic recession. In conclusion, our empirical tests indicate that for the last recession the demand for online dating increased with the deterioration of the economic sentiment in the long-run trend. But nothing can be said about short-run fluctuations around the equilibrium, regarding the relationship between the economic sentiment and the demand for dating. To conclude, our empirical analysis shows that during the last recession, the demand for online dating has increased with the deterioration of the economic sentiment in the long-run trend. However, nothing can be said about short-run fluctuations around the equilibrium, regarding the relationship between the economic sentiment and the demand for dating. Our study offers a first investigation of this interesting and puzzling question of the effect of the income on the demand for dating. More work needed on this topic to better understand how income may have an impact on the demand for dating, both theoretically and empirically. It would be worthwhile to collect both macro data in order to predict long-term trends for the dating industry, but also micro data on both users and non-users of these online dating services. This would allow to shed light on the selection process into online dating and to better understand individual strategies to find a partner through these services. All these issues are of interest for future work.
REFERENCES
Ahuvia, A. and M. Adelman (1992), “Formal intermediaries in the marriage market: A typology and review”, Journal of Marriage and the Family, 54, 452—463.
Batabyal, A.A. (2001), “On the likelihood of finding the right partner in an arranged marriage”, Journal of Socio-Economics, 33, 273—280.
Becker G.S. (1973), “A theory of marriage: part one”, Journal of Political Economy, 81(4), 813—846.
Becker G.S. (1974), “A theory of marriage: part two”, Journal of Political Economy, 82(2), S11—S26.
Becker, G. S. (1981), A treatise on the family, Cambridge, MA, Harvard, University Press Buss, D.M. (1994), The evolution of desire: Strategies of human mating, Basic Books, New
York.
Cameron, S. and A. Collins (1997), “Estimates of a hedonic ageing equation for partner search”, Kyklos, 40(3), 409—418.
Cameron, S. and A. Collins (1999), “Looks unimportant? A demand function for male attractiveness by female personal advertisers”, Applied Economics Letters, 6, 381—384. Cameron, S. and A. Collins (2000), “Random utility maximizer seeks similar: an economic
analysis of commitment level in personal relationships”, Journal of Economic Psychology, 21, 73—90.
Cameron, S. and A. Collins (2000), Playing the Love Market: Dating, Romance and the Real
World, Free Association Books, London.
Cameron, S. and N. Vaillant (2006), “A Goods Characteristics Model of the Hedonic Ageing Equation: Evidence From a French Marriage Bureau”, Brussels Economic Review, 48(4), 341—354.
household spending? If so, why?”, American Economic Review, 84, 1397-1408
Caucutt, E., Guner, N. and J. Knowles (2002), “Why do women wait? Matching, Wage, Inequalities, and the Incentives for Fertility Delay”, Review of Economic Dynamics, 5(4), 815—855.
Dickey, D.A. and W.A. Fuller (1979), “Distribution of the estimators for autoregressive time series with a unit root”, Journal of the American Statistical Association, 74, 427—431. Ellin, A. (February 11, 2009), “The Recession. Isn’t it romantic?”, The New York Times. Engle, R.F., Hendry D.F. and J.F. Richard (1983), “Exogeneity”, Econometrica, 51, 277—
304.
—
—
—
Foa, U. (1976), Resource theory of social exchanges, Contemporary topics in social
psychology, In John S. Thiabut, Janet Spence, and Rachel Carson, Morristown, NJ :
General Learning Press.
Forrester Research, http://www.forrester.com/rb/research
Geoffard, P.Y., Méchoulan, S. (2004), Comportements sexuels risqués et incitations : L’impact des nouveaux traitements sur la prévention du VIH Revue économique, 55(5),
Ginsberg, J., Mohebbi, M.H., Patel, R.S., Brammer, L., Smolinski, M.S., Brilliant, L. (2009), “Detecting influenza epidemics using search engine query data”, Nature, 457:7232, 1012—1014.
Gould, E. and D. Paserman (2003), “Waiting for Mr Right: rising inequality and declining marriage rates”, Journal of Urban Economics, 53(2), 257—281.
Granger, C. (1969), “Investigating causal relations by econometric models and cross-spectral methods”, Econometrica, 37, 424—438.
Gronau, R. (1977), “Leisure, Home Production and Work -- The Theory of the Allocation of Time Revisited”, Journal of Political Economy, 85(6).
Grossbard-Shechtman, S. (1995), “Marriage market models”. In Tomassi, M. and K., Ierulli, (eds.), The new economics of human behavior, Cambridge: Cambridge University Press. Grossbard-Shechtman, S. (2003), “A consumer theory with competitive markets for work in
marriage”, Journal of Socio-Economics, 31, 609—645.
Hirschman, E. (1987), “People as products: analysis of a complex marketing exchange”,
Journal of Marketing, 51, 98—108.
Johansen, S. (1988). “Statistical analysis of cointegrating vectors”, Journal of Economic
Dynamics and Control, 12, 231—254.
Johansen, S. and K. Juselius (1990), “Maximum Likelihood Estimation and Inference on Cointegration—With Applications to the Demand for Money”, Oxford Bulletin for
Economics
and Statistics, 52, 169—210.
Lancaster, K. (1966). “A New Approach to Consumer Theory”, Journal of Political
Le Guirriec, G. and N. Vaillant (2005), “From libertinism to marital commitment: an economic analysis of the marital research’s differentiated objectives”, Journal of
BioEconomics, 7(1), 84—95.
Levy, S. and G. Zaltman (1975), Marketing society and conflict, Englewood Cliffs, New Jersey: Prentice Hall.
Ludvigson, S. (2004), “Consumer confidence and consumer spending”, Journal of Economic
Perspectives, Vol. 18, 29—50.
Phillips, P.C. and P. Perron (1988), “Testing for a Unit Root in Time Series Regressions”,
Biometrika, 75, 335—346.
Quah, E. (1990), “Optimal search, matchmaking and the factors affecting age at first marriage”, Indian Economic Journal, 37(4), 74—80.
Sims, C. (1980), “Macroeconomics and Reality”, Econometrica, 48, 1—48.
Stevenson, B. and J. Wolfers (2007), “Marriage and divorce: changes and their driving forces”, Journal of Economic Perspectives, 21(2), 27—52.
Vaillant, N.G. (2004a), “Estimating the Time Elapsed Between Ending a Relationship and Joining a Matchmaking Agency: Evidence from a French Marriage Bureau”, Journal of
Economic Psychology, 25(6), 789—802.
Vaillant, N.G. (2004b), “Discrimination in matchmaking: Evidence from a French marriage bureau”, Applied Economics, 36(7), 723—729.
FIGURES
TABLES
Table 1. Descriptive statistics (whole sample)
PP (level)
PP (1st diff.)
Mean SD Z (rho) Z (t) Z (rho) Z (t) Log(Meetic) 0.907 0.332 -4.833 -2.218 -57.122 -7.283*** Log(ESI) 2.960 0.690 -5 -1.426 -80.682 -10.374*** Log(OPP) 2.547 0.026 -27.298 -4.093*** -68.665 -9.445*** Significant at the one percent level (***).
Table 2. Length of the vector auto-regressive model.
lag LL LR df P FPE AIC HQIC SBIC 0 150.571 0.000 -4.703 -4.222 -3.4409 1 263.565 225.990 9.000 0.000 3.0e-08* -8.8626* -8.25099* -7.2565* 2 270.518 13.905 9.000 0.126 0.000 -8.781 -8.038 -6.83044 3 274.586 8.137 9.000 0.520 0.000 -8.583 -7.710 -6.28902 4 283.074 16.975* 9.000 0.049 0.000 -8.563 -7.558 -5.92435 5 286.843 7.538 9.000 0.581 0.000 -8.354 -7.218 -5.37095 6 292.385 11.086 9.000 0.270 0.000 -8.215 -6.949 -4.8885 Significant at the ten percent level (*).
Table 3. Johansen procedure (with constant in cointegration)
No. of cointegrating vectors Eigenvalue Trace test r = 2 (alternative: r = 3) 0.04326 2.299 r = 1 (alternative: r = 2) 0.16222 11.504* r = 0 (alternative: r = 1) 0.30487 30.414* Significant at the ten percent level (*).
Table 4. VECM estimation results
D(Log(LMEETIC)) D(log(invOP)) D(log(LESI)) Coef. p-value Coef. p-value Coef. p-value
CE -0.027 0.074 -0.013 0.000*** 0.010 0.600 D(Log(MEETIC)) t-1 0.010 0.946 -0.009 0.807 0.144 0.441 t-2 -0.090 0.577 -0.188 0.631 -0.077 0.690 t-3 0.031 0.847 -0.056 0.158 0.221 0.258 t-4 0.081 0.625 -0.030 0.458 0.271 0.179 D(Log(ESI)) t-1 -0.558 0.404 -0.020 0.901 -0.580 0.474 t-2 0.594 0.378 0.257 0.121 -0.612 0.452 t-3 0.358 0.591 0.374 0.022** -1.010 0.210 t-4 0.924 0.144 0.174 0.262 -0.097 0.899 D(Log(invOP)) t-1 -0.027 0.849 0.018 0.596 -0.027 0.873 t-2 -0.035 0.790 0.093 0.004*** -0.055 0.729 t-3 0.009 0.948 0.088 0.013** 0.057 0.744 t-4 -0.008 0.956 0.034 0.355 0.096 0.599 Intercept -0.002 0.900 -0.004 0.197 -0.011 0.514 R-squared 0.300 0.4436 0.1474 Chi-squared 15.854 0.322 29.501 0.009 6.397 0.955 Significant at the one percent level (***).