Analysis of speckle patterns for deformation measurements by
digital image correlation
D. Lecompte
a*, H. Sol
b, J. Vantomme
a, and A. Habraken
ca
Royal Military Academy, Av. de la Renaissance 30, 1000 Brussels, Belgium;
bVrije Universiteit Brussel, Pleinlaan 2, 1050 Brussels, Belgium;
cUniversité de Liège, Chemin des Chevreuils 1, 4000 Liège, Belgium;
ABSTRACT
Digital Image Correlation (DIC) – also referred to as white light speckle technique – is an optical-numerical full-field measuring technique, which offers the possibility to determine in-plane displacement fields at the surface of objects under any kind of loading. For an optimal use of the method, the object of interest has to be covered with a speckle pattern. The present paper studies the efficiency of a random speckle pattern and its influence on the measured in-plane displacements with respect to the subset size. First a randomly sprayed speckle pattern is photographed three times. Each picture is taken with a different zoom, yielding three speckle patterns, which are different by the size of the speckles. Secondly a number of speckle patterns are generated numerically using a given speckle size and image coverage. Subsequently, each speckle pattern image undergoes a numerically controlled deformation, which is measured with digital image correlation software. Both imposed and measured displacements are compared and it is shown that the size of the speckles combined with the size of the used pixel subset, clearly influences the accuracy of the measured displacements. Furthermore it is shown that it is possible to create an optimal speckle pattern when a given subset size is chosen.
Keywords: digital image correlation, speckle pattern, image deformation
1. INTRODUCTION
The identification of the mechanical properties of different materials requires appropriate strain measuring techniques. This is especially true for loading conditions which create complex heterogeneous deformation fields. Full field measurement techniques and the Digital Image Correlation (DIC) technique in particular are suitable to tackle this challenge. This technique – also referred to as white light speckle technique – is an optical-numerical full-field measuring technique, which offers the possibility to determine in-plane displacement fields at the surface of objects under any kind of loading based on a comparison between images taken with a digital Charge Coupled Device (CCD) camera at different load steps. This technique has been used in various technological domains and many of its applications have been reported [1-6]. The capacity of the technique to measure non-homogeneous deformation fields has been described [7] as well as its limits and the accuracy of the measured displacements [8-9].
The aim of the present paper is to study the efficiency of a speckle pattern and its influence on the measured in-plane displacements with respect to the subset size. It has already been shown [10-13] that the subset size is always a critical parameter in the correlation process. However, the particularity of this study is that the images representing the different speckle patterns and simulating an actual experiment are numerically deformed. Subsequently the displacement field is measured by DIC and compared to the imposed one. Two types of speckle patterns are used in the present study: randomly sprayed patterns and numerically generated ones. The relationship between the speckle size and the displacement accuracy is determined and an optimal speckle pattern is proposed.
2. NUMERICAL TREATMENT OF THE IMAGES
2.1 Digital image correlation
The digital image correlation technique allows studying qualitatively as well as quantitatively the mechanical behavior of materials under certain loading conditions. The camera uses a small rectangular piece of silicon, which has been segmented into 1024 by 1280 arrays of individual light-sensitive cells, also known as photo sites or pixels. Each pixel
stores a certain grey scale value ranging from 0 to 255, in accordance with the intensity of the light reflected by the surface of the tested specimen. Two images of the specimen at different states of deformation are compared by using a subset (part of the image) of the undeformed image and searching for it in the deformed image, in order to maximize a given similarity function. The displacement result, expressed in the centre point of the subset, is an average of the displacements of the pixels inside the subset. The uniqueness of each subset is only guaranteed if the surface has a non-repetitive, isotropic, high contrast pattern. A classic correlation function using the sum of the squared differences of the pixel values is used. The image correlation routine allows locating every subset of the initial image in the deformed image. Subsequently, the software determines the displacement values of the centers of the subsets, which yields an entire displacement field.
2.2 Numerical deformation of images
The images of the different speckle patterns are numerically deformed as to simulate a homogeneous deformation. The deformation is based on a Finite Element simulated displacement field which afterwards is used as a reference for the comparison of the displacements determined by Digital Image Correlation. To obtain a homogeneous deformation field, a finite element analysis of a tension test of the specimen is performed. The obtained nodal displacement field is used to deform the original image. The result can be considered as a picture taken after loading of the real specimen, but without experimental errors. A grey value image can be seen as a matrix filled with integer values between 0 and 255. Every element of the matrix represents the grey value of a single pixel. To numerically deform an image, one has to start with an empty matrix with slightly adapted dimensions, depending on the type of deformation. This is because the deformed image will contain more or less pixels than the initial image. Firstly, the centers of the pixels in the deformed image have to be located in the deformed mesh. This is possible because the coordinate system is identical for both the deformed image and the finite element model and because the nodal displacements are all known. Using the interpolation functions of the mesh elements, it is possible to determine the displacement components in the centre of every pixel. This also means that the initial position of the pixel can be traced back in the reference image by subtracting its displacement. Most likely the initial position of a pixel from the deformed image is not located in the centre of a pixel of the initial image. Therefore, it’s necessary to interpolate the grey values of the pixels in a given region around the initial position. This is performed using a bicubic interpolation algorithm. When the same procedure is followed for every pixel, the entire deformed image is finally constructed.
3. RANDOMLY SPRAYED SPECKLE PATTERNS
3.1 Characterization of the patterns
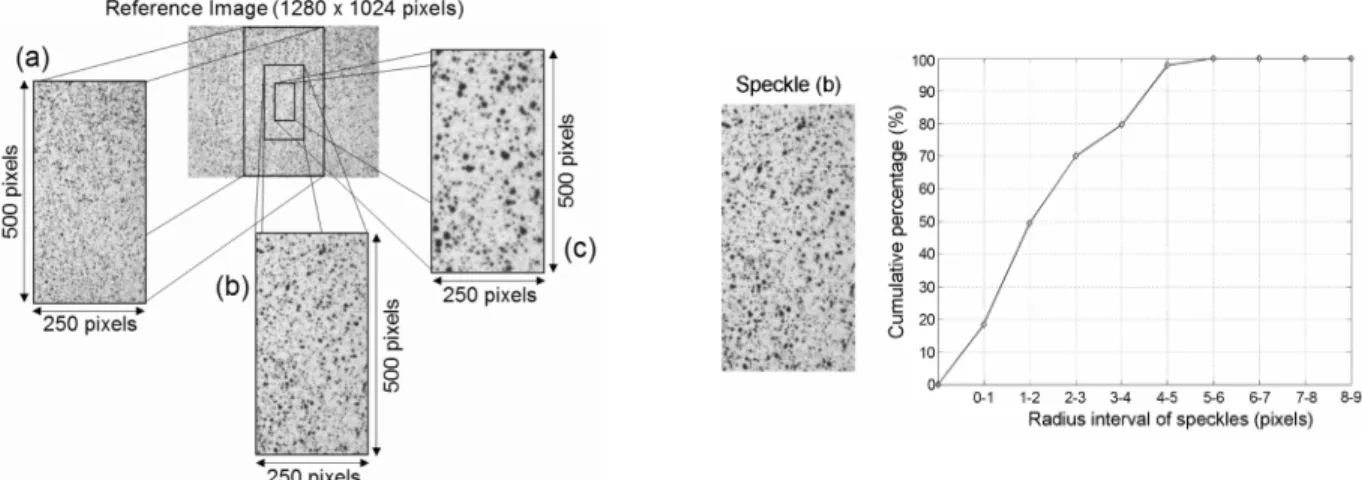
Firstly, a speckle pattern is randomly sprayed on a flat white surface. Several attempts were made to obtain an evenly distributed pattern of black paint drops. The same procedure is used in different studies in the case of actual experiments [14-19]. Three different images with a randomly chosen size of 250 x 500 pixels are extracted from this speckle pattern. They are all obtained by taking photographs of the same pattern using a different zoom (fig. 1 left). The main difference between the three new images is thus the overall (and random) size of the black dots or speckles. To be able to characterize the speckle patterns more quantitatively, a method to calculate the speckle size distribution of a given pattern, based on image morphology, will be used.
Morphology is a technique of image processing based on shapes. The value of each pixel in the output image is based on a comparison of the corresponding pixel in the input image with its neighbors. By choosing the size and shape of the neighborhood, one can construct a morphological operation that is sensitive to specific shapes in the input image. The operation consists in consecutively eroding and dilating the image. More detailed information can be found in [20]. In the present case a circular shape is used with different radii. The objective is to locate the speckles with a radius that is superior to a given value. By performing this operation for different radius values, a speckle size distribution corresponding to the given pattern can be formulated. An example of such a speckle size distribution curve is shown in fig. 1(right).
3.2 Influence of speckle size on displacement accuracy
The reference images of the three speckle patterns and the corresponding deformed images can be considered as if they were generated by an actual experiment. Figure 2 shows the difference between the imposed (FEM-based) displacements and the measured displacements with the DIC software. Three different subset sizes – 13 x 13, 23 x 23 and 33 x 33 pixels, respectively small, medium and big subset – are used in the image correlation process. The results are presented
in the form of histograms. The x-axis represents the difference between the imposed displacements and the DIC-calculated displacements in the horizontal direction. The y-axis represents the number of data points in which a given difference is present. The chosen image resolution is chosen to be equal to 100µm/pixel.
Fig. 1. Sprayed speckle pattern with three different zooms, yielding the three new reference speckle patterns
Fig. 2. Difference between the imposed and DIC-calculated displacement components for a homogeneous displacement field as a function of the speckle pattern and the subset size
Only the vertical displacement component is shown. For the understanding of the plots one should keep in mind the following remarks:
•The higher and the narrower the central peak, the better the correspondence between the imposed and the calculated displacements, thus the more accurate the results are;
•All the images are numerically treated in the same way. The difference in displacements is therefore only related to the speckle and the subset size.
A first and important observation is that the larger the subset, the more accurate the measured displacements are. This is shown by the narrowing of the peak for increasing subset sizes and it is true for the three speckle types. The reason for this is that the information content is more important in the larger subsets. This means that in the case of a homogeneous displacement field, the information can be smoothened inside the subset, which obviously leads to more accurate results. A second observation is that in the case where the small subset is used, figure 2 shows that the most precise result is obtained with the smallest speckles, followed by the medium and large speckles. When using the medium subset the best result is obtained with the large speckles. In that case the difference between the small and medium speckles is negligible. In the last case, where the large subset is used, it is clear that the large speckles yield the most precise results, followed by the medium and small speckles. The only problem with the randomly sprayed speckle patterns is that the size of the speckles cannot be controlled. Therefore it is tried to generate the patterns numerically.
4. NUMERICALLY GENERATED SPECKLE PATTERN
4.1 Creation of the patterns
In the available commercial DIC-systems the subset size is identical throughout the entire image. This means that once the subset size is chosen, it remains identical during the correlation calculation. The size of the subset depends on the type of deformation field to be expected. When dealing with homogeneous deformation (constant displacement gradients), the subset size should be as big as possible to enable noise filtering and thereby smoothing of the displacement data. However, in the case of heterogeneous deformations (variable displacement gradients), the subset size should be a trade-off between avoiding smearing of the displacement data, correlation problems and noise filtering. In the present paragraph a subset size of 15x15 pixels has been fixed to perform the study.
Fig. 3. Three different speckle patterns with a speckle diameter of 5 pixels (left), 9 pixels (middle) and 15 pixels (right)
Fig. 4. Three different speckle patterns with a speckle diameter of 5 pixels and a coverage of 10% (left), 30% (middle) and 50% (right)
The aim is to numerically generate a speckle pattern which can be characterized by the lowest possible number of parameters. The speckle patterns which are generated can be characterized by only two parameters. The first one is the size of the occurring speckles, which is identical for the entire pattern. It will be demonstrated that the speckle pattern can be random enough when only one speckle size is used. The second parameter is the coverage or the ratio of grey/black pixels over the entire number of pixels.
patterns also have to exhibit a random character. The term “random” refers in this context to the fact the in the entire image no two sub-images of 15x15 pixels are identical. This is a necessity for the correlation algorithm to perform a correct calculation. It is achieved by randomly positioning the same speckle in an image of 300x300 pixels, until the desired coverage is achieved. Seven speckle patterns are generated with a coverage of 55% and speckle size between 3 and 15 pixels (fig. 3). Seventeen patterns are generated using a speckle size of five pixels and a coverage between 15% and 95% (fig. 4).
4.2 Noise addition and blurring
In reality, the image taken of an object by a CCD-camera is just a representation of that same object influenced by the lightning conditions, the used lens and the noise of the light sensitive cells. This means that the real distribution of grey values does not reach from 0 to 255. Indeed, it is slightly smaller, meaning that black and white pixels are actually represented by a value that is respectively higher than 0 and lower than 255. In reality the object is never positioned in such a way that its image exactly lies in the image plane of the lens either, which leads to a certain level of blurring of the image. And finally the presence of noise in the images is unavoidable.
To simulate these conditions as close as possible, the numerically generated speckle patterns have to be blurred, subjected to noise and their grey value range has to be realistically limited. When analyzing the photographed image, it has been found that:
• the grey values are limited between a value of 30 and 240;
• the noise present in the image follows a normal distribution with a mean value of zero and a standard deviation of 2; • the blurring can be simulated by a Gaussian filter with a size of 4x4 pixels and a standard deviation of 0.8
4.3 Determination of the optimal speckle pattern
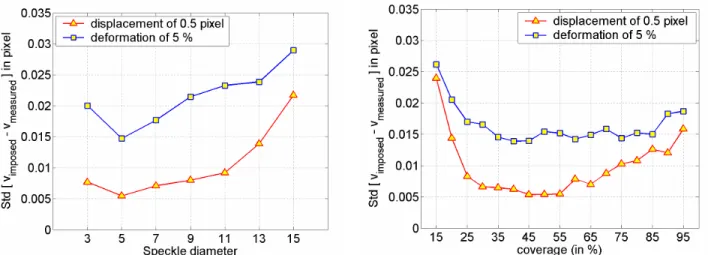
The same procedure to numerically deform the different patterns is used. A uniform deformation of 5% and a displacement of 0.5 pixels are imposed. The standard deviation of the difference between the imposed and the measured displacements for both deformations is calculated and shown as a function of the speckle diameter (fig. 5) and as a function of the coverage. It is clear that in the case of a subset size of 15x15 pixels, the optimal speckle size is 5 pixels and the optimal speckle coverage lies between 40% and 70%.
Fig. 5. Standard deviation of the difference between the imposed and the measured displacements in the case of a numerically imposed displacement of 0.5 pixel and a numerically imposed deformation of 5% for a speckle size between 3 and 15 pixels (left) and for a coverage between 15% and 95% using a speckle diameter of 5 pixels (right).
5. CONCLUSION
In the present paper, the accuracy of the Digital Image Correlation technique is studied in function of the nature of the speckle pattern. In first instance it has been shown that the mean size of the speckles in a given randomly sprayed
speckle pattern in combination with the size of the subset has an influence on the accuracy of the measured displacements. A method has also been presented that enables the characterization of sprayed speckle patterns by the determination of a speckle size distribution. It is based on a morphology study of the pattern image.
In a second instance a number of speckle patterns is numerically generated. The two parameters which determine the speckle patterns are the size of the speckles and the image covering. It has been shown that when using a subset of 15x15 pixels the optimal choice for the speckle diameter is five pixels and that the image covering lies between 40% and 70%
Further research will be conducted to numerically print speckle patterns onto specimens. In this way the speckle covering and speckle size can be controlled and optimized in function of the experimental set-up. It would offer the possibility to control the appearance of the patterns without losing the random character of the pattern, which is needed for the functioning of the DIC technique.
REFERENCES
1. Wang Y, Cuitiño AM. Full-field measurements of heterogeneous deformation patterns on polymeric foams using digital image correlation. Int J Solids and Structures 2002;39(13-14):3777–3796
2. Li EB, Tieu AK, Yuen WYD. Application of digital image correlation technique to dynamic measurement of the velocity field in the deformation zone in cold rolling. Opt Laser Eng 2003;39:479-488
3. De Roover C, Vantomme J, Wastiels J, Taerwe L. DIC for Deformation Assessment : A Case Study. European journal of Mechanical and and environmental Engineering 2003;48(1):13-20
4. Hild F, Raka B et al. Multiscale displacement field measurements of compressed mineral wool samples by digital image correlation. Applied Optics 2002;41(32):6815-6828
5. Asundi A, North H. White-light Speckle Method–Current Trends. Opt Laser Eng 1998;29:159-169
6. Rae PJ, Palmer SJP, Golrein HT, Lewis AL, Field, JE. White-light digital image cross-correlation (DICC) analysis of the deformation of composite materials with random microstructure. Opt Laser Eng 2004;41:635-648
7. Lagattu F, Brillaud J, Lafarie-Frenot M. High strain gradient measurements by using digital image correlation technique. Materials characterization 2004;53:17-28
8. Sun Z, Lyons JS, McNeill SR. Measuring Microscopic Deformations with Digital Image Correlation. Opt Laser Eng 1997;27:409-428
9. Brillaud J, Lagattu F. Limits and Possibilities of Laser Speckle and White Light Image Correlation Methods Theory and Experiments Applied Optics 2002;41(31):6603-6613
10. Knauss WG, Chasiotis I, Huang Y. Mechanical measurements at the micron and nanometer scales. Mechanics of Materials 2003;35:217-231
11. Vendroux G, Knauss WG. Submicron deformation field measurements: part 2. Improved digital image correlation. Exp Mech 1998;38(2):86–91
12. Sutton MA, Cheng M, Peters WH, Chao YJ, McNeil SR. Application of an optimized digital image correlation method to planar deformation analysis. Image Vision Comput 1986;4(3):143–150
13. Sutton MA, Wolters WJ, Peters WH, Ranson WF, McNeil SR. Determination of displacements using an improved digital image correlation method. Image Vision Comput 1983;1(3):133–139.
14. Zhang D, Arola DD. Applications of digital image correlation to biological tissues. Journal of Biomedical Optics 2004;9(4):691-699
15. Choi S, Shah SP. Measurement of deformations on concrete subjected to compression using image correlation. Exp Mechanics 1997;37:307-13
16. Samarasinghe S, Kulasiri D. Stress intensity factor of wood from Crack-tip displacement fields obtained from from digital image processing. Silva Fennica 2004;38(3):267-278
17. Abanto-Bueno J, Lambros J. Investigation of crack growth in functionally graded materials using digital image correlation. Engineering Fracture Mechanics 2002;69:1695-1711
18. Abanto-Bueno J, Lambros J. Mechanical and fracture behavior of an artificially ultraviolet-irradiated poly(ethylene-carbon monoxide) copolymer. Journal of Applied Polymer Science 2004;92(1):139-148
19. Geers MGD, de Borst R, Peijs T. Mixed numerical-experimental identification of non-local characteristics of random-fibre-reinforced composites Composites Science and Technology 1999;59:1569-1578