Analysis of the sensitivity of FEM predictions to numerical parameters in
deep drawing simulations
Laurent Duchênea, Anne Marie Habrakenb a
COBO Department, Royal Military Academy, Avenue de la Renaissance, 30, 1000 Brussels, Belgium b M&S Department, University of Liège, Chemin des Chevreuils, 1, 4000 Liège, Belgium
Abstract
In this study, deep drawing finite element (FE) simulations are compared with experimental results. The steel grade, the geometry and the parameters of the experimental deep drawing processes are detailed in this paper. Particular attention is paid to numerical models. The main part of the article is dedicated to a broad sensitivity study. The influence of several numerical parameters on the predicted punch force and earing profile is analysed. A quadratic [Hill, R., 1948. A theory of the yielding and plastic flow of anisotropic metals. Proc. Roy. Soc. London Ser. A 193, 281-297] constitutive law is compared with more sophisticated micro-macro constitutive laws. The sensitivity of these laws to the initial data characterizing material behaviour is presented. A significant influence of the FE type and the number of FE layers is noticed. Finally, it also appears that friction parameters (penalty coefficient and Coulomb friction coefficient) have a significant influence on numerical results. The low anisotropy of the steel sheet increases the influence of several numerical parameters. That influence would not be observed with a highly anisotropic steel.
Keywords : Finite element analysis ; deep drawing ; texture
1. Introduction
Recently, several sophisticated constitutive laws aiming accurately to represent the mechanical behaviour of material submitted to a forming process have been developed. Tourki et al. (1996) show the superiority of the Ferron-Tourki model in comparison with Hill's quadratic model for the prediction of the earing profile resulting from the deep drawing of a cylindrical cup. Andersson et al. (1999) use different numerical models for the finite element method (FEM) simulation of deep drawing tests of aluminium sheets: those of Hill (1948), Barlat and Lian (1989), Karafillis and Boyce (1993). The comparison of Andersson et al. (1999)'s FEM results with experiments shows that Karafillis' model yields the best agreement with experimental results. Pijlman et al. (1999) also demonstrate the improvement gained using Vegter's model (Vegter et al., 1999), in comparison with Hill's model, during a limiting dome height test.
Texture and microstructure-based constitutive models have also been investigated for the FEM simulation of deep drawing processes. Li et al. (2003) make use of a texture-based yield locus coupled to a microstructure-based mixed hardening model.
Their results show that their coupled model is capable of predicting the plastic anisotropy induced by both texture and strain-path change.
Both Dawson et al. (2003) and Habraken (2004) present reviews of state of the art numerical models in sheet forming analysis dealing with mechanical anisotropy resulting from crystallographic texture. Another review more related to material science is also presented in Raabe (2002).
These papers underline the effect of the constitutive laws on FE method results. Particular attention must, however, be paid to the implementation of these laws into FE codes. It is interesting to develop accurate models for mechanical behaviour but the accuracy of simulation results cannot be guaranteed by checking the
constitutive models alone. So many numerical parameters exist that can affect FE results.
The aim of this paper is to analyse the effect of some numerical parameters on the results provided by FE simulations in deep drawing simulations. The parameters under investigation can be classified into three groups. The first group concerns material behaviour: the choice of constitutive law, the selection of the representative set of crystals for texture-based laws and the procedure used to fit the parameters for Hill's (1948) law. The second group is more linked to the FE method. It concerns the choice of FE type and the number of element layers used to mesh the blank. Finally, as it is very influential during deep drawing simulations, the contact between the blank and the tools is examined through the Coulomb friction coefficient and the penalty coefficient (used to avoid interpenetration).
bottom. Two cases are studied corresponding to two lubrication techniques: oil lubricant and nylon film lubricant.
These deep drawing simulations were initially investigated as a validation for the micro-macro constitutive law described in Section 3.2 (see also Habraken and Duchêne, 2004; Duchêne, 2003, for further details). However, numerous investigations have confirmed that the material model is only one factor exhibiting close comparison between FEM predictions and experiments (see Duchêne et al., 2000, 2003, and Section 4 of this paper). This conclusion depends on the anisotropic character of the material and is particularly true for material close to isotropic behaviour as highlighted below.
2. Description of the deep drawing process
2.1. Material behaviour
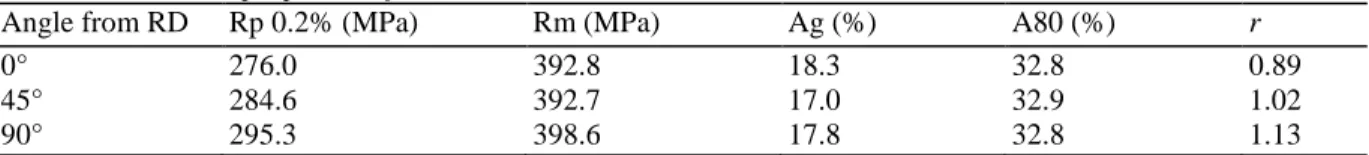
The deep drawing processes presented in this paper were achieved with a form of high tensile steel called SPXI 250. This steel sheet is produced by rolling, and the sheet thickness at the end of the rolling process is 0.8 mm. SPXI 250 is made of ferritic steel. It corresponds to a body centred cubic (bcc) crystal lattice and the mean grain size is 6 µm. The mechanical properties of SPXI 250 have been determined through tensile tests along different directions with respect to the rolling direction (RD). Particular points of stress-strain curves corresponding to 0°, 45° and 90° from RD are presented in Table 1. Lankford's coefficients (r) along RD, the 45° direction and the transverse direction (TD) are also presented in Table 1.
Table 1 Mechanical properties of SPXI 250 steel
Angle from RD Rp 0.2% (MPa) Rm (MPa) Ag (%) A80 (%) r
0° 276.0 392.8 18.3 32.8 0.89
45° 284.6 392.7 17.0 32.9 1.02
90° 295.3 398.6 17.8 32.8 1.13
RD: Rolling direction, Rp 0.2%: yield stress at 0.2% plastic strain, Rm: maximum stress, Ag: strain corresponding to Rm, A80: failure strain, r: Lankford coefficient.
The isotropic hardening behaviour implemented in our model makes use of the Swift power-type law of Eq. (1):
The hardening parameters are the strength coefficient K, the offset ε0 and the hardening exponent n. These parameters have been fitted on the stress-strain curve of the tensile test along RD. The values corresponding to the SPXI 250 steel have been defined as K = 579.5 MPa, ε0 = 0.0028 and n = 0.1726.
From these tensile tests, the elastic properties have also been extracted. Young's modulus (E) is 209 880 MPa and Poisson's ratio (v) is 0.28. As we focused in this study on the behaviour of the steel sheet during forming processes involving large strains, an interest in elasticity was not predominant over plasticity. It is for this reason that an isotropic elasticity model was implemented for the deep drawing simulations.
The texture of the steel sheet was measured in order to be used with our micro-macro model. The texture measurement of SPXI 250 steel was obtained by X-ray diffraction. The texture exhibits a γ fibre, which is typical for rolled steels. The maximum value of the ODF (corresponding to the most represented orientation in the polycrystal) is 5.86 for the SPXI 250 steel. Note that a value of 1 would correspond to a uniform distribution of crystal orientations. However, a value of around 5 constitutes a low texture, as confirmed by values of Lankford coefficient near 1.
2.2. Geometry of the deep drawing process
The axisymmetric geometry of the tools and the blank is defined in Fig. 1. The blank was a disc cut out from the rolled steel sheet. The drawing ratio of the blank radius (150 mm) to the punch radius (75 mm) was 2.0. The exact position of the symmetry axis of the punch, matrix and blankholder, with respect to each other, must be checked when the tools are mounted on the hydraulic press. The exact position of the symmetry axis of the blank must be carefully checked before each deep drawing process.
The deep drawing processes were performed up to a drawing depth of 80 mm. Taking into account the geometry of the blank and the tools, this drawing depth yielded an incompletely drawn cup. A part of the blank remained under the blankholder at the end of the process.
Fig. 1. Geometry of the tools and the blank (dimensions in mm).
2.3. Parameters of the deep drawing process
A hydraulic press was used for the deep drawing experiments. The punch force was applied by a hydraulic jack. The blankholder force was also applied by means of hydraulic jacks acting on the corners of the blankholder. The blankholder holds the steel sheet in place during the deep drawing process in order to avoid wrinkling. In the absence of a blankholder or with too weak a blankholder force, wrinkles would appear at the zone of the sheet near the edges. A too strong blankholder force would lead to failure of the steel sheet during the deep drawing process. A range can be found for the blankholder force. This range depends on the steel used for the deep drawing, but also on the geometry of the final cup and, particularly, on the drawing ratio. A blankholder force of 10 tons (98.1 kN) was used here for the studied deep drawing tests and led neither to wrinkling nor to failure. Two experimental deep drawing tests were conducted with the SPXI 250 steel using different lubrication techniques. The first lubricant was an oil and the corresponding Coulomb friction coefficient (μ) was 0.13. The second lubrication technique made use of a nylon film placed between the blank and the tools. In that case, the friction coefficient was smaller (μ = 0.02).
3. Description of FEM modelling
The deep drawing simulations described in the present paper were achieved thanks to the self-made FE code LAGAMINE. This is an implicit non-linear FE code with a Lagrangian formulation and is adapted to large strains and large displacements. The development of this code by the M&S department began in 1984. Since then, it has been applied to numerous forming processes, such as rolling (Habraken et al., 1998), forging (Habraken and Cescotto, 1990), continuous casting (Castagne et al., 2003; 2004), deep drawing (Duchêne et al., 2002), powder compaction (Mosbah et al., 1999), cooling processes (Habraken and Bourdouxhe, 1992; Casotto et al., 2005) and connection (Drean et al., 2002). LAGAMINE has a large element library (see, for example, Cescotto and Charlier, 1993; Zhu and Cescotto, 1994, 1995a; Habraken and Cescotto, 1998), as well as numerous constitutive laws (see Zhu and Cescotto, 1995b; Habraken and Duchêne, 2004).
3.1. Finite element mesh
As already stated, the geometry of the blank and the tools is axisymmetric. However, due to the orthotropy of material behaviour, an axisymmetric 2D analysis cannot be performed. A 3D analysis, modelling only a quarter of the deep drawing test is achieved. Adequate boundary conditions must be imposed at the symmetry axes. These symmetry axes are defined as the global X and Y axes in the FE mesh; the global Z axis is parallel to the punch displacement direction.
The geometry of the FE model is that of the experimental process shown in Fig. 1. The tools are considered to be perfectly rigid and are modelled by foundation elements. The tool mesh consists of triangular facets defined by three nodes. The volume of the tools is not modelled; only their external surface is meshed. The mesh of a quarter of the punch consists of 456 triangular facets; the matrix is meshed with 576 facets and the blankholder with only 48 facets, because it is flat. A total of 626 nodes are required for the three tools.
The blank is meshed by BLZ3D finite elements (see Zhu and Cescotto, 1994). BLZ3D is a solid finite element with eight nodes using a mixed formulation. These elements are adapted for large strains and large
displacements. One integration point per element is defined.
A quarter of the circular blank is meshed by 2,256 BLZ3D elements and 3,192 nodes in the shape of 3 layers of 752 elements (see Fig. 2). The thickness of each layer is one third of the steel sheet thickness (= 0.8 mm/3). The initial orientation of the local axes of BLZ3D elements corresponds to the orthotropy axes of the steel sheet (RD, TD and the normal direction). During deep drawing simulations, large displacements and large rotations occur. The steel sheet follows these rotations to represent correctly the anisotropy of the material. Local axes, which are linked to the current orientation of the steel sheet during the simulation, are used. Their position is computed according to an assumption of constant symmetric velocity gradient at each step. Details can be found in Munhoven et al. (1995).
Interface elements are required to model the contact between the blank and the tools. CFI3D contact elements are used (see Habraken and Cescotto, 1998). They consist of plane elements defined by four nodes; four integration points per element are defined. These contact elements are meshed on the surface of the blank using the nodes defined for the solid elements. As the nodes used for the meshes of the contact elements and the ones used for the mesh of the blank are identical, the contact elements deform like the blank and follow its displacements. A Coulomb law is linked to the contact elements to model the friction behaviour between the blank and the tools. In the relatively low normal pressure range encountered in the present deep drawing process, the Coulomb law predicts realistic frictional shear stresses, as can be checked through punch force prediction.
Fig. 2. Mesh of the blank with 3 layers of 752 solid elements.
3.2. Constitutive laws
Different constitutive laws have been investigated to model the mechanical behaviour of the blank during deep drawing simulations.
It is well-known that plastic deformation of polycrystalline material induces reorientation of individual grains into preferred orientations. This phenomenon, i.e. texture evolution, and the initial texture of the steel sheet are responsible for the mechanical anisotropy of the material, which plays an important role in forming processes. The implementation of texture evolution into the FE code is therefore of great importance. Unfortunately, micro-macro models generally require a very long computation time and large memory storage.
These considerations led us to the development of a local yield locus approach suitable for FE modelling of industrial forming processes. With this model, only a small zone of the yield locus is computed. This zone is updated when it is no longer in the part of interest in the yield locus or when the yield locus changes due to texture evolution.
Most of the deep drawing simulations presented in this paper make use of this local yield locus approach (Habraken and Duchêne, 2004). For this reason, the main ideas behind this new model are described below. The local yield locus approach is specific in the sense that it does not use a yield locus formulation either for interpolation or in the stress integration scheme. It uses a linear stress-strain interpolation described by Eq. (2):
Where ζ is a 5-D vector containing the deviatoric part of the stress, the hydrostatic part being elastically computed according to Hooke's law. The 5-D vector u is the deviatoric plastic strain rate direction (it is a unit vector). τ is a scalar describing the work hardening and is directly obtained from the exponential relationship of Eq. (1). The interpolation is included in matrix C of Eq. (2).
Five advisedly chosen directions in the deviatoric strain rate space are assumed: ui (i = 1...5) and the associated
deviatoric stresses: ζi (i = 1...5) are computed using a full constraints Taylor's model. These stress vectors lie on
the yield surface according to Taylor's model. These points define the interpolation domain; they are located at the vertices of the domain and are called 'stress nodes'. The C matrix is constructed on the basis of the five stress nodes.
With this method, only a small part of the yield locus is known. As long as the interpolation is achieved in the domain delimited by the five stress nodes, the interpolation matrix C is valid. When the stress direction explored during the FE computation falls out of the domain, updating of the stress nodes must take place; a new
interpolation matrix is then computed. The classical updating method consists of finding five new stress nodes defining a new domain containing the current stress direction. An improved updating method makes use of the adjacent domain. Therefore, only one new stress node is computed using Taylor's model and four of the five old stress nodes are kept for the interpolation. The main advantages of this method are that updating requires only one call (instead of five) to Taylor's model and that it improves the continuity of the resulting yield locus and the continuity of the normal to the yield locus.
Each stress node of the local yield locus presented above is calculated using Taylor's model. Furthermore, Taylor's model is also used for the computation of texture evolution during FE simulations. The texture of the steel sheet is represented at each integration point of the FE mesh by a set of crystallographic orientations and the texture evolution is computed on the basis of strain history, different for each integration point of the mesh. Two methods were used to compute the representative set of crystallographic orientations. These are described and compared in Section 4.5.
The above considerations are sufficient for an understanding of the basic concepts of the local yield locus implemented into the LAGAMINE code. Further details and properties of such parameterisation of an N-dimensional space have been previously investigated by Duchêne (2003). In that study, different interpolation methods are examined inside one domain: linear interpolation in Cartesian coordinates (hyperplane model), linear interpolation in spherical coordinates, an approach enriched by bubble mode....
The local yield locus without the computation of texture evolution (the initial texture is subsequently used throughout the simulation) is referred to as Minty (microscopic interpolated yield locus). If the texture evolution is activated, Evol is used to represent the corresponding results.
In order to analyse the effect of the choice of constitutive model on the deep drawing simulations (described in Section 4.1), other constitutive laws were also investigated.
The second constitutive law used is an analytical 6th order series yield locus based on points of the yield locus computed by Taylor's model and linked to the initial texture. This constitutive law corresponds to a global micro-macro yield locus and is further described in (Munhoven et al., 1996; Winters, 1996). The law is referred to as ANI3VH.
Deep drawing simulations were also performed using a classical (Hill, 1948) constitutive law. Hill's well known quadratic yield locus is implemented into several FE codes and then allows the comparison of different FE codes, eliminating the influence of the yield locus formulation. For example, Li et al. (2001) use Hill's law with the commercial FE code ABAQUS for the simulation of deep drawing processes. Geng and Wagoner (2002) also use the Hill yield locus with ABAQUS for sheet metal forming. According to Habraken (2004) and Lee et al. (1998), Hill's law is also available in the FE codes LS-DYNA3D and FORMSYS-DE, adapted for sheet forming. The Hill parameters describing the anisotropy of the steel sheet can be fitted on the Lankford coefficients or on the yield stresses. The results with Hill's law are referred to as Hill (r) for a fitting based on the Lankford coefficients only and Hill (sig+r) for a fitting based on the Lankford coefficients and the yield stresses (mixed fitting).
4. Sensitivity study
To check the validity of the results computed by deep drawing simulations, the influence of some important numerical parameters was investigated. These parameters refer to the steel sheet constitutive law, the FE mesh, the FE type and friction behaviour.
4.1. Comparison between constitutive laws
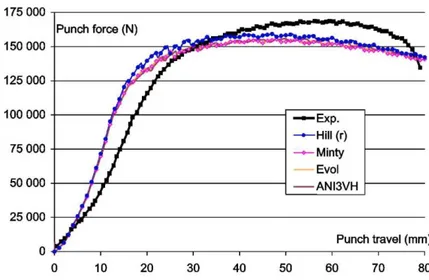
The punch forces as a function of the punch travel for four different constitutive laws are compared with experimental results in Fig. 3 (the oil lubricant case is presented). It can be noticed that all the numerical curves are almost superimposed, except the one relating to Hill's constitutive law, which is a little higher. These curves are in fair agreement with the experimental curve (the scatter on the experimental punch force is expected to be around 5%). The maximum of the curve is, however, too low and the slope at the beginning of the deep drawing
simulation is too high. The error on the maximum of the curve is very sensitive to the Coulomb friction coefficient (see Section 4.3). The nominal coefficient (0.13 in this case) is perhaps not perfectly adapted to the deep drawing process.
Furthermore, the hardening parameters have a significant influence on the maximum of the punch force. These parameters are fitted on a tensile test along RD, which is certainly not a perfect representation of hardening behaviour during a deep drawing process.
The error on the slope at the beginning of the simulation can be attributed to poor modelling of bending behaviour by the FE type. The influence of the FE type is discussed in Section 4.7 and a better agreement at the beginning of the simulation was indeed obtained with another FE type.
The oscillations noticed on the numerical curves are due to the passing of successive finite elements on the matrix shoulder. The elements are submitted to bending when they reach this zone. As the bending stiffness is different if one considers the bending of one finite element or the bending between two elements, oscillations are present on the punch force curves. On the other hand, the hydraulic press is at the origin of the oscillations on the experimental curve.
Fig. 4 presents the earing profile of the SPXI 250 steel with oil lubricant. The earing profile corresponds to the radius of the deformed cup as a function of the angle from RD. This measure is directly linked to the anisotropy of the steel sheet. For FE simulations, this anisotropy is introduced through the constitutive law (either the Hill parameters or texture data).
The shape of the curves is identical for all the numerical models: a maximum at 45° from RD, with lower values at 0° and 90°. The anisotropy of the material is therefore modelled similarly with the different constitutive laws. A shift can, however, be noticed between these curves showing small differences in the ductility of the material, depending on the law. Unfortunately, the shape of the numerical curves is very different from the one in our experiments (the scatter on the experimental earing profile is smaller than 5%). This difference may be due to one of several problems. A lack of accuracy during the experimental process might be at the origin of the problem. Experimental parameters, such as the homogeneity of the lubrication and the alignment of the centre of the blank to the symmetry axis of the tools, may be mentioned (see Duchêne, 2003, for further details on experimental measurements). Furthermore, the SPXI 250 steel is weakly anisotropic. The earing profile obtained for this steel can also largely be influenced by numerical parameters, such as the number of element layers, the penalty coefficient or the fitting procedure for Hill's law. These points are investigated in the following paragraphs.
With our model, the influence of texture updating ('Evol' in the figures) in comparison with the case using the initial texture throughout the simulation ('Minty') may be analysed. The punch force was almost uninfluenced by texture updating. On the other hand, the earing profile was more influenced: the shape remained more or less identical but a shift could be noticed. The radius of the deformed cup was lower when the texture was updated during the simulation. A relatively small influence of the texture updating on mechanical behaviour was then observed, whereas the analysis of the final texture showed a significant texture evolution during the process (see Duchêne, 2003).
Fig. 4. Earing profile for SPXI 250 steel with oil lubricant.
4.2. Number of element layers
In order to model correctly the bending and unbending of the steel sheet on the shoulders of the matrix and the bending against the punch, the deep drawing simulations were performed with three layers of finite elements through the thickness (remember that the BLZ3D element makes use of only one integration point per element). The same deep drawing process with only one layer of elements was also tested to check the influence of the number of layers on the results. From a computation time point of view, a test with one layer is better; the computation time is, indeed, more or less proportional to the number of finite elements.
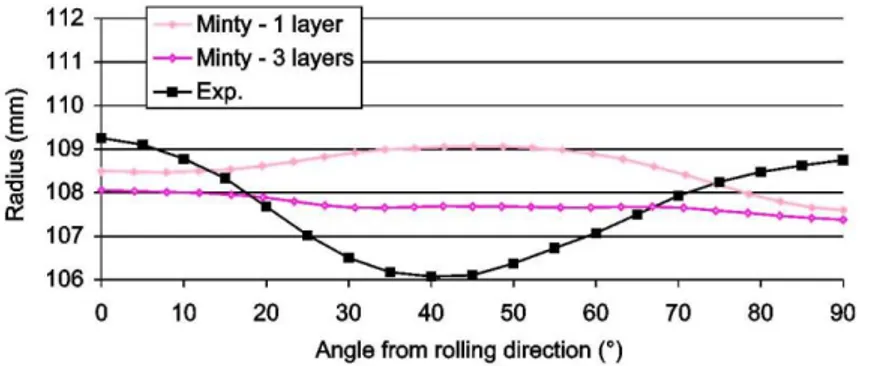
Fig. 5 presents the earing profile when one or three layers of elements were used. The earing profile with only one layer is almost opposite to the experimental one. The bending and unbending of the steel sheet on the curved part of the matrix cannot be accurately represented with only one layer.
Conversely, a larger number of element layers than three would not improve significantly the earing profile or the punch force prediction (Lei et al., 2001), while the computation time would become prohibitive (due to the time consuming texture-based constitutive law used).
Fig. 5. Influence of the number of element layers on the earing profile (SPXI 250 with nylon film lubricant).
4.3. Coulomb friction coefficient
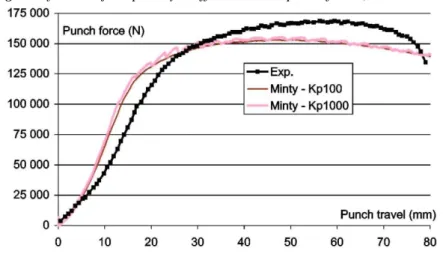
The Coulomb friction coefficient has a great influence on the deep drawing process. The experimental and the simulated punch forces are presented in Fig. 6 for both lubricants (oil and nylon film). It can be noticed that the oil lubricant corresponding to a higher Coulomb friction coefficient yielded to a higher punch force required to achieve the deep drawing process (experimentally and numerically). The force needed to extract the blank clamped between the matrix and the blankholder is indeed higher if the friction is higher.
A significant influence of the friction coefficient can also be noticed on the earing profile (by comparing Figs. 4 and 5). Both the experimental and numerical shape of the earing profile was influenced by the friction coefficient and the mean radius of the cup was also very sensitive: the mean radius was 107.7 mm in the case of the nylon film lubricant and 112.6 mm in the case of the oil lubricant (with Minty constitutive law).
The influence of the friction coefficient is mainly due to its effect on the efficiency of the clamping of the steel sheet between the blankholder and the matrix. The friction of the steel sheet on the shoulder of the matrix and the punch is also an important factor. A uniform Coulomb friction coefficient (of 0.02 for the nylon film and 0.13 for the oil lubricant) was certainly not perfectly adapted to model the contact between the blank and the different parts of the tools. Therefore, because of its significant influence on the punch force, it is possible to adjust the Coulomb friction coefficient so as to fit exactly the maximum of the experimental punch force. However, if we focus on the mean radius of the cup, the nominal friction coefficient (0.02 for the nylon film lubricant) leads to a mean radius of 107.7 mm with the Minty law, which is very close to the experimental value: 107.6 mm.
Fig. 6. Influence of the Coulomb friction coefficient on the punch force (SPXI 250 steel with both lubricants).
4.4. Penalty coefficient
The contact condition between the blank and the tools was enforced via a penalty method. In the case of contact between a contact element and a foundation, the repulsive stress (ζC) is defined as:
where Kp is the penalty coefficient and δ is the penetration of the contact element inside the foundation.
To reduce penetration, a high penalty coefficient should be used. However, too large a penalty coefficient leads to convergence problems. For the deep drawing simulations presented here, localisation of the strains on the flange of the cup was noticed for too large penalty coefficients. These strain localisations correspond to deep drawn cups reaching failure, which does not correspond to experimental observations.
In the present study, in order to avoid these strain localisation problems without allowing too high a penetration, a penalty coefficient of 1000 N/mm3 was used for the contact between the blank and the matrix and a coefficient of 500 N/mm3 was used for the contact between the blank and the punch and between the blank and the
blankholder (this set of values is referred to as 'Kp 1000' in Figs. 7 and 8). A larger coefficient was used for the contact with the matrix because a large zone of the steel sheet was successively in contact with the matrix shoulder during the deep drawing simulation. The correct modelling of the curvature of the matrix shoulder was then expected to be an important point for the accuracy of results. With this set of penalty coefficients, no strain localisation occurred and penetration was smaller than 15% of the thickness of the blank. The largest penetration was observed for the contact of the blank with the shoulder of the punch.
For comparison purposes, a value of 100 N/mm3 was tested for the contact between the blank and the three tools ('Kp 100' in the figures). Such a low value yields large penetrations: on the curved part of the tools, where the contact pressure is great, almost half the thickness of the blank penetrated inside the tool. Beside the inaccurate position of the blank during the simulation, such penetrations modify the effective curvature radii of the tools. Large penetrations also induce a more uniform distribution of the contact pressure between the blank and the tool in one contact zone. Furthermore, a lower penalty coefficient reduces the risk of strain localisation and
convergence problems during FE simulations.
Fig. 7 shows the influence of the penalty coefficient on the punch force. Our first observation is that the oscillations, already discussed in Section 4.1 in the case of Kp = 1000, were almost eliminated with Kp = 100.
bending stiffness between two elements was smoothed, thanks to more uniform pressure distribution. A further point of interest is the lower punch force observed for a lower penalty coefficient. This can be explained by the apparent modification of the curvature radii of the tools (the radii are larger for a lower penalty coefficient) and by the more uniform distribution of pressure under the blankholder.
Fig. 8 presents the influence of the penalty coefficient on the earing profile. The earing profile has already proved to be a very sensitive result. Indeed, the shape of the earing profile was completely different, according to the penalty coefficient.
Fig. 7. Influence of the penalty coefficient on the punch force (SPXI 250 with oil lubricant).
Fig. 8. Influence of the penalty coefficient on the earing profile (SPXI 250 with oil lubricant).
4.5. The representative set of crystallographic orientations
In order to carry out FE computations taking account of polycrystalline material texture, it is convenient to represent the orientation distribution function (ODF) by a discrete set of crystallographic orientations. One particular property of the polycrystal (noted A) can therefore be computed according to Eq. (4).
The sum being achieved on the n grains of the representative set, where ai is the value of the selected property
for the ith grain and Wi is a weighting factor corresponding to the volume fraction of the ith grain. From a
computational point of view, this technique is very interesting but three important problems arise: - The selection of the crystallographic orientations representative of the ODF;
- The computation of the weighting factor of each grain;
For the first two problems, several techniques have been developed to extract a discrete set of crystals that are expected to represent, as far as possible, the physical properties of the corresponding continuous ODF. Some of these are cited in Toth and Van Houtte (1992). New approaches have recently been developed (e.g. ODFLAM from the team of professor Van Houtte; see Van Houtte, 2002, for further details). As it has proved accurately to represent the mechanical behaviour of steel sheets, the ODFLAM procedure has generally been used to compute the representative discrete sets of crystallographic orientations. The ODFTAY procedure, which is a former version developed by the team of professor Van Houtte (see, Toth and Van Houtte, 1992, for further details), was also used for comparison purposes.
The influence of these procedures on the mechanical behaviour of the steel sheet was very small for the deep drawing simulations presented here. The greatest difference was noted on the earing profile and is presented in Fig. 9.
We have, however, noticed that the representative sets of crystals obtained with ODFLAM reflect more accurately the anisotropy of the steel sheet. In Fig. 10, the Lankford coefficient as a function of the angle from RD is computed with our texture-based model using a representative set computed by ODFLAM and another one obtained with ODFTAY. The Lankford coefficients directly computed from the continuous texture (referred to as 'Texture' in Fig. 10) and two sets of experimental values are also plotted. The Lankford coefficients computed on the basis of the discrete set obtained with ODFLAM are very close to the values directly computed from the continuous texture. The ODFTAY procedure is a little less accurate for the computation of the Lankford coefficients. As the Lankford coefficient is an important factor in deep drawing processes (as explained by Mendoza et al., 2000; Chung et al., 1996), the ODFLAM procedure should be preferred here. The superiority of the ODFLAM procedure is also shown in different applications in Duchêne (2003).
The question of the number of crystal orientations that should be included in the representative set is a very important one and has already been investigated by several authors. In the FE computation, each orientation must be treated; the computation time is then proportional to the number of crystals included in the
representative set. On the other hand, the accuracy of the computation is increased if the representative set reproduces correctly the continuous ODF, which is improved if a large number of crystals is used. The number of grains to take into consideration must then result from a compromise between accuracy and computation time. Clearly, with improvements in information technology, the compromise is always weighted towards better accuracy. Some authors have proposed the following:
• (Kalidindi and Anand, 1994): 180 or 200 crystals to be used during compression tests; • (Anand et al., 1997): 32 crystals for cup-drawing simulations;
• (Beaudoin et al., 1994): 256 for hydroforming process; • (Dawson and Kumar, 1997): 200 for titanium rolling;
• (Frénois, 2001): 233 orientations for tantalum forming or 1,144 if texture updating is investigated; • (Béringhier et al., 2004): 1,200 orientations for uniaxial compression test;
• (Li et al., 2005): 1,200 orientations for extrusion of copper.
Note that the current tendency is to decrease the number of crystals per integration point but to use a different set of crystals for each element in order to represent the material globally (see Béringhier et al., 2004; Delannay et al., 2005).
We also investigated this question with our micro-macro model (described in Section 3.2). The influence of the number of crystals on the accuracy of the computed yield stress is presented in Fig. 11. From this evidence and from further analyses detailed in Duchêne et al. (2000), it can be seen that a number of 2,000 crystals is a good compromise between accuracy and computation time (mean relative error lower than 1% for the studied cases). This number of crystals was used for the deep drawing simulations presented here.
4.6. The fitting of the Hill parameters
As explained in Section 3.2, Hill's constitutive law can be fitted either on the basis of the Lankford coefficients of the steel sheet or on the basis of yield stresses. A mixed fitting procedure was also investigated.
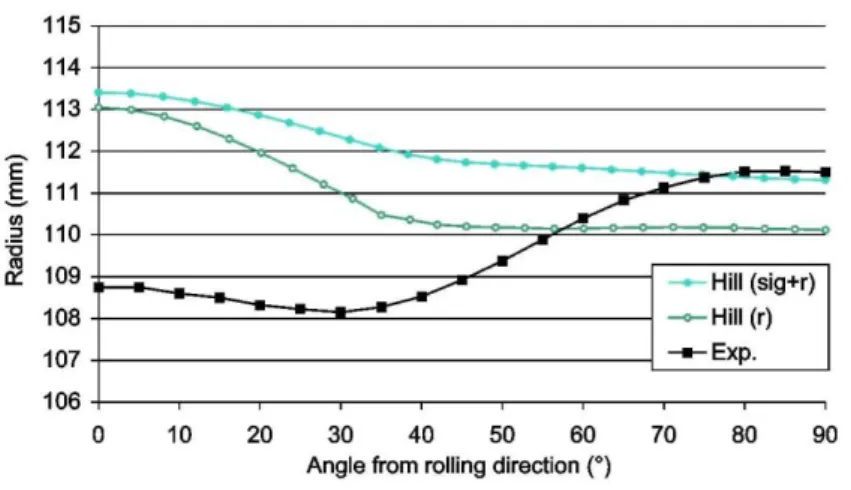
The case of a fitting based only on the Lankford coefficients ('Hill (r)') and the case of a fitting allotting the same importance between Lankford coefficients and yield stresses ('Hill (sig+r)') are compared in Fig. 12. The amplitude of the earing profile is larger when a Lankford coefficient-based fitting is used.
The earing profile being closely linked to the Lankford coefficients (this point is proved in Chung et al., 1996; Duchêne, 2003; Habraken and Duchêne, 2004), a Hill law fitted on the Lankford coefficients should be more accurate for the prediction of the earing profile.
Fig. 9. Influence of the procedures used to compute the representative set of crystals on the earing profile (SPXI 250 with oil lubricant).
Fig. 10. Comparison of the procedures used to compute the representative set of crystals (Lankford coefficient of the SPXI 250 steel).
Fig. 11. Influence on accuracy of the number of crystal orientations (the reference result is taken as the one computed with 40 000 orientations).
Fig. 12. Influence of the fitting of the Hill parameters on the earing profile (SPXI 250 with oil lubricant).
4.7. Influence of finite element type
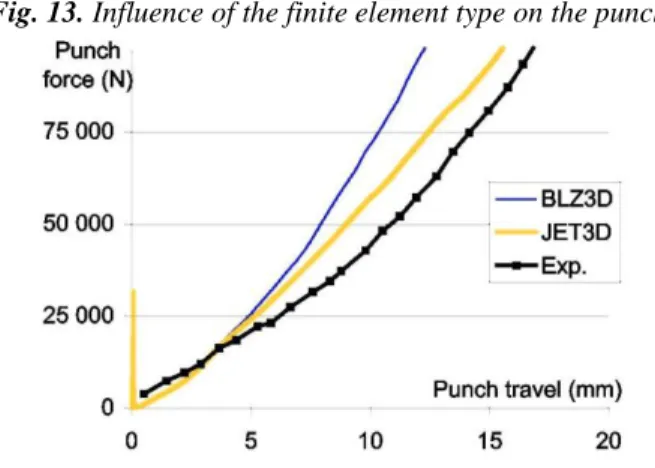
Finally, the influence of FE type on the deep drawing simulations was investigated. As already mentioned in Section 4.1, FE type has an influence on the bending behaviour of the modelled steel sheet. The slope of the punch force versus punch travel curve at the beginning of the simulation is then affected. Fig. 13 shows the punch force as a function of punch displacement with BLZ3D elements (see Zhu and Cescotto, 1994), which has been used to date and with JET3D elements (see Li et al., 1992; Li et al., 1995).
The JET3D and the BLZ3D elements are both 8-node brick 3-D solid elements with one integration point. They are mixed elements based on the Hu-Washizu principle (see Simo and Hughes, 1986) with hourglass control. Both elements make use of three fields: the stress field, the strain field and the displacement field. The main differences between the BLZ3D and the JET3D elements are the hypothesis used for the strain field and the treatment of locking.
For both simulations shown in Fig. 13, an identical Hill constitutive law was used. The FE mesh was also identical. As we focus on the slope of the curve during the increasing punch force stage, only the beginning of the simulation is plotted in Fig. 13.
The slope obtained with the JET3D elements was lower in comparison with the slope of the BLZ3D elements, showing a lower stiffness of the modelled material behaviour during the steel sheet bending stage. The JET3D element is in better agreement with experimental results.
A significant behaviour difference was obtained between both FE types, even though they are very similar elements. If shell elements had been investigated, a different behaviour would also be expected.
5. Conclusions
The punch force predicted by the numerical models was generally in fair agreement with experimental results (see Figs. 3 and 6); the influence of numerical parameters was relatively small (see, for example, Fig. 7 for the influence of the penalty coefficient). Table 2 summarizes the influence of numerical parameters on the punch force. As shown in Fig. 3, the constitutive law used appears not to be the most influential parameter.
Conversely, the prediction of the earing profile was not in agreement with experimental results (see Fig. 4). The weak anisotropy of the SPXI 250 steel is assumed to be at the origin of the poor accuracy of the numerical results and explains the small difference in the shape of the curves for different constitutive models. This point has been analysed in Section 4 and is summarized in Table 3. The earing profile prediction is clearly very sensitive. For the SPXI 250 steel, it appears that the influence of the constitutive law is relatively small in comparison with other parameters. Furthermore, the shape of the earing profile seems almost uninfluenced by the constitutive law, while other numerical parameters affect the shape. This conclusion is only valid for this low anisotropic steel, while the influence of the constitutive model would be predominant for higher anisotropic steels.
Fig. 13. Influence of the finite element type on the punch force (SPXI 250 with oil lubricant).
Table 2 Summary of the sensitivity study for the punch force
Numerical parameter Effect on the value of the maximum Effect on initial slope Effect on oscillations
Number of element layers 10% between 1 and 3 layers no no
Friction coefficient Large effect no no
Penalty coefficient Small effect no yes
Constitutive law Small effect no no
Finite element type - yes -
Table 3 Summary of the sensitivity study for the earing profile prediction
Numerical parameter Effect on mean amplitude Effect on shape
Number of element layers 0.87 mm between 1 and 3 layers yes
Friction coefficient Large effect yes
Penalty coefficient Small effect yes
Constitutive law Significant effect none or small
The analysis of other steel grades and other deep drawing geometries (see, for example, Duchêne, 2003; Li et al., 2001) proves indeed that a better prediction of steel sheet mechanical behaviour during deep drawing is obtained with accurate yield locus representations. Figs. 14 and 15 present the earing profiles for steels with higher anisotropy: Lankford coefficients ranging from 1.8 to 2.7 and maximum texture intensity of 12.7 for the IF steel of Fig. 14 and Lankford coefficients from 1.9 to 2.24 and maximum texture intensity of 14.8 for the FeP06t steel of Fig. 15 (see Duchêne, 2003; Duchêne et al., 2004; Li et al., 2001, for further details about these steels). These earing profiles show that constitutive models have a strong impact in the case of higher anisotropic materials. The comparison of Figs. 14 and 15 with the results obtained with the SPXI 250 steel shows that the texture-based models (ANI3VH, Minty and Evol) yielded similar results (in terms of earing profile and punch force), while Hill's model was generally different. Furthermore, Fig. 14 illustrates that the shape of the earing profiles predicted with the texture-based models is in good agreement with experimental values (the main discrepancy is a shift in the curves). Unfortunately, this was absolutely not the case for the SPXI 250 steel, as shown in Fig. 4. Furthermore, even if a significant texture evolution is noted according to experimental measurements (texture measurements of deformed cups are compared to initial texture in Duchêne, 2003), the prediction of texture evolution seems not to have had a significant influence on the mechanical behaviour of the SPXI 250 steel during the deep drawing processes presented in this paper (as shown in Figs. 3 and 4).
Fig. 14. Influence of the constitutive model on the earing profile for an IF steel (the experimental measurements are extracted from Li et al., 2001).
Fig. 15. Influence of the constitutive model on the earing profile for FeP06t steel (from Duchêne et al., 2004).
Acknowledgements
As Senior Research Associate of the National Fund for Scientific Research (Belgium), Anne Marie Habraken wishes to acknowledge the support of the Belgian research fund. The authors also thank the Belgian Federal Science Policy Office (Contract P5/08) for its financial support.
References
Anand, L., Balasubramanian, S., Kothari, M., 1997. Constitutive modelling of polycrystalline metals at large strains: application to
deformation processing, large plastic deformation of crystalline aggregates. In: CISM Courses and Lectures, vol. 376. Springer, pp. 109-172. Andersson, A., Ohlsson, C.A., Mattiasson, K., Persson, B., 1999. Implementation and evaluation of the Karafillis-Boyce material model for anisotropic metal sheets. In: Gélin, J.C., Picart, P. (Eds.), Proc. 4th Int. Conf. NUMISHEET 99, Besançon, pp. 115-121.
Barlat, F., Lian, J., 1989. Plastic behaviour and stretchability of sheet metals. Part 1: a yield function for orthotopic sheets under plane stress conditions. Int. J. Plasticity 5 (1), 51-66.
Beaudoin, A.J., Dawson, P.R., Mathur, K.K., Kocks, U.F., Korzekwa, D.A., 1994. Application of polycrystal plasticity to sheet forming. Com- put. Methods Appl. Mech. Engrg. 117, 49-70.
Béringhier, M., Delannay, L., Chastel, Y., Logé, R.E., 2004. Finite element modeling of a compression test with polycrystalline plasticity applied to reduced grain samplings. In: Stören S. (Ed.), Proc. 7th Int. Conf.: ESAFORM, Trondheim, pp. 167-170.
Casotto, S., Pascon, F., Habraken, A.M., Bruschi, S., 2005. Thermo-mechanical-metallurgical model to predict geometrical distortions of rings during cooling phase after ring rolling operations. Int. J. Machine Tools & Manufacture 45, 657-664.
Castagne, S., Pascon, F., Bles, G., Habraken, A.M., 2004. Developments in finite element simulations of continuous casting. J. Phys. IV, 447-455.
Castagne, S., Remy, M., Habraken, A.M., 2003. Development of a mesoscopic cell modeling the damage process in steel at elevated temperature. In: Engineering Materials. Trans Tech Publications, Switzerland, pp. 223-236, 145-150.
Cescotto, S., Charlier, R., 1993. Frictional contact finite element based on mixed variational principles. Int. J. Numer. Methods Engrg. 36, 1681-1701.
Chung, K., Lee, S.Y., Barlat, E., Keum, Y.T., Park, J.M., 1996. Finite element simulation of sheet forming based on a planar anisotropic strain-rate potential. Int. J. Plasticity 12 (1), 93-115.
Dawson, P.R., Kumar, A., 1997. Deformation process simulations using polycrystal plasticity, large plastic deformation of crystalline aggregates. In: ICMS Courses and Lectures, vol. 376. Springer, p. 247.
Dawson, P.R., MacEwen, S.R., Wu, P.-D., 2003. Advances in sheet metal forming analyses: dealing with mechanical anisotropy from crystallographic texture. Int. Mater. Rev. 48 (2), 86-122.
Delannay, L., Béringhier, M., Chastel, Y., Logé, R.E., 2005. Simulation of cup-drawing based on crystal plasticity applied to reduced grain samplings. In: Proc. 14th Int. Conf.: ICOTOM, Leuven, in press.
Drean, M., Habraken, A.M., Bouchair, A., Muzeau, J.P., 2002. Swaged bolts: modelling of the installation process and numerical analysis of the mechanical behaviour. Comput. & Structures 80, 2361-2373.
Duchêne, L., 2003. FEM study of metal sheets with a texture based, local description of the yield locus. PhD Thesis. University of Liège, Liège.
Duchêne, L., de Montleau, P., Bouvier, S., Habraken, A.M., 2004. Deep drawing simulations with different polycrystalline models. In: Ghosh, S. (Ed.), Proc. 8th Int. Conf.: NUMIFORM, Columbus, pp. 1022-1027.
Duchêne, L., Godinas, A., Cescotto, S., Habraken, A.M., 2002. Texture evolution during deep-drawing processes. J. Mater. Processing Technology, 125-126, 110-118.
Duchêne, L., Godinas, A., Cescotto, S., Habraken, A.M., 2003. Micro-macro analysis of steel sheet behaviour in finite element simulations. Application to deep-drawing process. J. Phys. IV (France) 105, 223-230.
Duchêne, L., Habraken, A.M., Godinas, A., 2000. Validation of a FEM model coupled with texture applied to deep drawing process. In: Fritz, H.G. (Ed.), Proc. 3rd Int. Conf.: ESAFORM'00, Stuttgart.
Frénois, S., 2001. Modélisation polycristalline du comportement mécanique du tantale. Application à la mise en forme par hydroformage. PhD Thesis, Ecole Centrale des Arts et Manufactures, Ecole Centrale Paris.
Geng, L., Wagoner, R.H., 2002. Role of plastic anisotropy and its evolution on springback. Int. J. Mech. Sci. 44 (1), 123-148. Habraken, A.M., 2004. Modelling the plastic anisotropy of metals. Arch. Comput. Meth. Engrg. 11 (1), 3-96.
Habraken, A.M., Bourdouxhe, M., 1992. Coupled thermo-mechanical-metallurgical analysis during the cooling of steel pieces. Eur. J. Mech. A Solids 11 (3), 381-402.
Habraken, A.M., Cescotto, S., 1990. An automatic remeshing technique for finite element simulation of forging processes. Int. J. Numer. Methods Engrg. 30, 1503-1525.
Habraken, A.M., Cescotto, S., 1998. Contact between deformable solids, the fully coupled approach. Math. Computer Modelling 28 (4-8), 153-169.
Habraken, A.M., Charles, J.F., Wegria, J., Cescotto, S., 1998. Dynamic recrystallization during zinc rolling. Int. J. Forming Processes 1 (1). Habraken, A.M., Duchêne, L., 2004. Anisotropic elasto-plastic finite element analysis using a stress-strain interpolation method based on a polycrystalline model. Int. J. Plasticity 20 (8-9), 1525-1560.
Hill, R., 1948. A theory of the yielding and plastic flow of anisotropic metals. Proc. Roy. Soc. London Ser. A 193, 281-297.
Kalidindi, S.R., Anand, L., 1994. Macroscopic shape change and evolution of crystallographic texture in pre-textured fcc metals. J. Mech. Phys. Solids 42/3, 459-490.
Karafillis, A.P, Boyce, M.C., 1993. A general anisotropic yield criterion using bounds and a transformation weighting tensor. J. Mech. Phys. Solids 41 (12), 1859-1886.
Lee, S.W., Yoon, J.W., Yang, D.Y, 1998. A stress integration algorithm for plane stress elastoplasticity and its applications to explicit finite element analysis of sheet metal forming processes. Comput. & Structures 66 (2-3), 301-311.
Lei, L.P, Hwang, S.M., Kang, B.S., 2001. Finite element analysis and design in stainless steel sheet forming and its experimental comparison. J. Mater. Processing Technology 110 (1), 70-77.
Li, K.P., Cescotto, S., Jetteur, P., 1992. An element with hourglass control for the large deformation analysis in three-dimension. In: Owen, D.R.J. (Ed.), Proc. of 3rd Int. Conf. on Computational Plasticity, Fundamentals and Applications, Barcelona.
Li, K.P, Habraken, A.M., Bruneel, H., 1995. Simulation of square-cup deep-drawing with different finite elements. J. Mater. Processing Technology 50, 81-91.
Li, S., Beyerlein, I.J., Alexander, D.J., Vogel, S.C., 2005. Texture evolution during multi-pass equal channel angular extrusion of copper: neutron diffraction characterization and polycrystal modeling. Acta Mater. 53, 2111-2125.
Li, S., Hoferlin, E., Van Bael, A., Van Houtte, P., 2001. Application of a texture-based plastic potential in earing prediction of an IF steel. Adv. Engrg. Mater. 3 (12), 990-994.
Li, S., Hoferlin, E., Van Bael, A., Van Houtte, P., Teodosiu, C, 2003. Finite element modelling of plastic anisotropy induced by texture and strain-path change. Int. J. Plasticity 19 (5), 647-674.
Mendoza, R., Alanis, M., Huante, J., Gonzalez-Rivera, C, Juarez-Islas, J.A., 2000. Evaluation of the mechanical properties and corrosion behaviour of ultra-clean steels. J. Mater. Processing Technology 101, 238-244.
Mosbah, P., Shima, S., Habraken, A.M., Charlier, R., 1999. Numerical simulation of compacting process of a multi-steeped part with comparisons to experiments. J. Japan Soc. Powder and Powder Metallurgy 46, 696-704.
Munhoven, S., Habraken, A.M., Van Bael, A., Winters, J., 1996. Anisotropic finite element analysis based on texture. In: Lee, J.K., Kinzel, G.L., Wagoner, R.H. (Eds.), Proc. 3rd Int. Conf.: NUMISHEET 96, Deaborn, pp. 112-119.
Munhoven, S., Habraken, A.M., Winters, J., Schouwenaars, R., Van Houtte, P., 1995. Application of an anisotropic yield locus based on texture to a deep drawing simulation. In: Shen, S.F., Dawson, P.R. (Eds.), Proc. 5th Int. Conf. on Numerical Methods in Industrial Forming Processes: NUMIFORM 95, Ithaca, pp. 767-772.
Pijlman, H.H., Brinkman, J., Huetink, J., Vegter, H., 1999. The Vegter yield criterion based on multi-axial measurements. In: Gélin, J.C., Picart, P. (Eds.), Proc. 4th Int. Conf. NUMISHEET 99, Besançon, pp. 109-114.
Raabe, D., 2002. Challenges in computational materials science. Adv. Mater. 14 (9), 639-650.
Simo, J.C., Hughes, T.J.R., 1986. On the variational foundations of assumed strain methods. J. Appl. Mech. 53, 51-54.
Toth, L.S., Van Houtte, P., 1992. Discretization techniques for orientation distribution function. Textures and Microstructures 19, 229-244. Tourki, Z., Zeghloul, A., Ferron, G., 1996. Sheet metal forming simulations using a new model for orthotopic plasticity. Comput. Mater. Sci. 5, 255-262.
Van Houtte, P., 2002. ODFLAM Software, Part of the latest version of MTM-FHM Software System. Katholieke Universiteit Leuven. Vegter, H., An, Y., Pijlman, H.H., Huetink, J., 1999. Advanced material testing on aluminium alloys and low carbon steels for sheet forming. In: Gélin, J.C., Picart, P. (Eds.), Proc. 4th Int. Conf. NUMISHEET 99, Besançon, pp. 3-8.
Winters, J., 1996. Implementation of texture-based yield locus into an elastoplastic finite element code. PhD Thesis, Katholieke Universiteit Leuven, Leuven.
Zhu, Y.Y., Cescotto, S., 1994. Transient thermal and thermomechanical analysis by FEM. Comput. & Structures 53 (2), 275-304.
Zhu, Y.Y., Cescotto, S., 1995a. Unified and mixed formulation of the 4-node quadrilateral elements by assumed strain method: application to thermomechanical problems. Int. J. Numer. Methods Engrg. 38, 685-716.
Zhu, Y.Y., Cescotto, S., 1995b. A fully coupled elasto-visco-plastic damage theory for anisotropic materials. Int. J. Solids Structures 32 (11), 1607-1641.