Optical spectroscopy investigation of fiber optic
high temperature sensors
Th`ese pr´esent´ee pour l’obtention du grade de
Philosophiae Doctor (Ph.D.)
en Sciences de l’´energie et des mat´eriaux
par
Binod Bastola
Jury d’´evaluation
Pr´esident du jury
Professeur Luca Razzari
Universit´e INRS–EMT, Canada
Examinateur externe
Professeur Pablo Bianucci
Universit´e Concordia, Canada
Examinateur externe
Professeur Florian Hausen
Universit´e RWTH Aachen, Allemagne
Directeur de recherche Professeur Andreas R¨udiger
Universit´e INRS–EMT, Canada
Institut National de la Recherche Scientifique
´Energie Mat´eriaux T´el´ecommunications
Universit´e du Qu´ebec 2018
Abstract
Optical Spectroscopy Investigation of Fiber Optic
High Temperature Sensors
by Binod Bastola
Optical fibers have become an integral part of our daily life in a variety of appli-cations, most notably in telecommunications and non-invasive medical diagnostics. Derived products, including fiber Bragg gratings (FBGs) extend the field of appli-cations to e.g. temperature and strain sensors that are already beyond the labo-ratory proof-of-concept level and that hold the promise to transform many areas of industries in an ever increasing number of applications in aerospace, structural integrity monitoring as well as in-site sensing in turbines and reactors. Especially the latter represent a harsh environment which makes the use of electronic sensors either completely impossible or which implies short service intervals. Often these industries employ optical techniques to conduct measurement in the optical fibers themselves, e.g. based on evanescent fields but only a few fiber-based techniques allow for distributed multiplexed sensing. The idea is to operate different sensors along the length of the fiber at different wavelengths, a concept that also capitalizes on the fact that most optical sensors are passive so that the fiber only carries the signal rather than the power supply. The aforementioned points translate into the many advantages of fiber based sensors: reliability, good sensitivity, multiplexing, and low maintenance costs so that in many industries, the technology is now already seen as a worthwhile alternative to established electronic sensors. Optical fibers are immune to electromagnetic field (EMI), compact and can be functionalized. This collaborative dissertation with an industrial partner specialized in developing prac-tical, end–user–focused commercial sensor solutions, is based largely on fiber optic sensing. While the overall project dealt with glass fiber and Fiber Bragg Gratings (FBG) for temperature sensing at elevated temperature and in otherwise harsh en-vironment, the focus of my work is on the physics and material science of FBGs at elevated temperatures.
As typical application example, the atmospheric re–entry, of space vessels exposes materials to extreme thermal conditions under the influence of hypersonic velocity, which lead to critically high temperatures that might affect the structural integrity
at a high repetition rate with sufficient precision to provide real time feedback to the crew. The reason of choosing optical fiber technology is not only because of fibers being themselves relatively inert but also because they are the ideal choice for long–term monitoring with embedding capability in composite structures. So, the thesis primarily addresses the capability of FBG to track temperatures, a property readily known and thoroughly investigated as such at low and moderate tempera-tures but which holds a couple of surprises and challenges for temperatempera-tures above 300◦C.
Fiber Bragg gratings are periodic refractive index modulations in the core of a fiber for which the Bragg condition is met at a specific wavelength referred to as the Bragg wavelength. This wavelength is reflected and contains information about the grating. The length of this periodic structure is typically a few millimeters while the distance between two maxima of the refractive index modulation is in the range of 500 nm for an FBG matching the C-band of telecom. The permanent change in the physical characteristics with a spatial periodic modulation of the core in-dex of refraction is most commonly created through transversely exposing the fiber core with a UV–beam and using a phase mask to generate an interference pattern of UV–optical field. The temperature sensitivity of the Bragg wavelength depends on the periodicity of the grating and on the effective refractive index of the fiber core. The dominant contribution to this stems from the temperature dependence of refractive index (thermo–optic effect) as compared to the thermal expansion of silica. At high temperatures, the FBG is however unstable which leads to a loss in reflectivity to the point that the signal becomes undetectable.
For specific conditions during the post-fabrication process of the FBG, the reflec-tivity recovers after a certain time providing what is referred to as a regenerated FBG. These regenerated FBGs have a much better temperature stability but suf-fer from a substantially reduced reflectivity, typically in the range of 10 –15 % of the initial value. While this regeneration process is now widely used, it still lacks fundamental understanding, in particular as the description of FBGs so far relies on a single grating that, once it has been erased, should not regenerate. The fun-damental understanding of the regeneration process is furthermore complicated by the complexity of glass as a material system so that e.g., chemical compositions, stress relaxation phenomena, densification etc. are barely understood and models of the underlying mechanisms are still in their infancy. Therefore, in this thesis, I aim at correlating temperature dependent a) FBG parameters with b)in situ Raman spectroscopy and c) photoluminescence data to characterize the optical fibers and FBGs and the way fiber parameters (e.g., hydrogen loading, relaxation of the glass,
fiber dopants and stresses) mitigate or impact the FBG regeneration process has been investigated.
In the macroscopic study, an Erbium (Er) broadband source between 1530 –1565 nm is coupled to an optical spectrum analyzer (OSA) through different fibers contain-ing FBGs and their senscontain-ing capacities were investigated by monitorcontain-ing wavelength shifts with changes in temperature. Annealing behavior of gratings in standard telecom grade fibers were investigated with a dedicated setup that allowed for tem-perature cycles below 1000◦C. The linear temperature response is influenced upon
heating to 900◦C and subsequent cooling of FBGs back to ambient temperature and
the observed temperature sensitivity is determined to be approximately 13 pm/K. The calibration curves are obtained to test the characteristics of RFBGs. This was done through a dedicated program in MATLAB to automatically extract all rele-vant experimental parameters from a time– and temperature–dependent sequence of spectra and led to a new methodology to enhance the recovered reflectivity of FBGs through regeneration between 700 –1000◦C, exceeding the state of the art by over
400 %. The objectives of this work are thus to provide a better understanding of the regeneration mechanism from a phenomenological and microscopic perspective as well as suggestions on how to enhance the performance of regenerated FBGs.
Regarding the methodology, the observation of the key parameters of FBGs was accomplished in collaboration with our industrial partner. I developed a dedicated Matlab code to improve the precision with which critical parameters could be ex-tracted from the large amount of data which allowed me to systematically investigate the peak width that provides a direct handle on the core refractive index modulation. Still, the fundamental question remained about the mechanism of regeneration or in other words, what provides the memory to generate a new grating after the initial one was erased. I address this challenge through the introduction of a second grat-ing that coexists from the very beginngrat-ing and which is of opposite phase to the first while having a stronger thermal stability. All qualitative observations are covered through this simple model. With respect to the microscopic identification, Raman spectroscopy allowed me to identify fluorine as an undocumented component of the core in GF1B fibers. A comprehensive description of the glass composition, as it would be required to establish a complete microscopic model, is however still out of reach. In order to push for additional indicators at the microscopic level, I exploited the temperature dependence of a strong visible luminescence from the FBG under excitation of a blue cw laser and report on reversible and irreversible contributions of this luminescence.
an exciting perspective worth exploring further. As far as the spectroscopic in-vestigation of the microstructure is concerned, two principle directions should be followed in the near future: for one, it is worthwhile investigating if any of the already observable properties (Raman signature and luminescence) correlates with the regeneration process of FBGs and for the other, it should be possible to extract thermal activation energies for these processes as a fingerprint of defects that can then be compared with independent studies in other fibers and by other experimen-tal techniques.
Publications and conference presentations
[1] B. Bastola, B. Fischer, J. Roths, and A. Ruediger, “Qualitative
photolumines-cence study of Defect activation in telecommunication fibers and Bragg gratings,” Optical Materials, vol. 81, pp. 134-139, 2018.
[2] B. Bastola, B. Fischer, J. Roths, and A. Ruediger, “Raman microstructural
investigation of optical fiber at elevated temperature,” Optical Engineering, vol. 56, pp. 097104, 2017.
[3] M. Celikin, D. Barba, B. Bastola, A. Ruediger, F. Rosei, “Development of
regenerated fiber Bragg grating sensors with long-term stability,” Optics Express, vol. 24, pp. 21897, 2016.
[4] B. Bastola, B. Fischer, J. Roths, and A. Ruediger, “In-situ Raman
investi-gation of optical fiber glass structural changes at high temperature,” Proc., Fiber Optic Sensors and Applications XIV, vol. 10208L, 2017 [ SPIE Defense + Commer-cial Sensing, California].
[5] B. Bastola, D. Barba, M. Celikin, K. Tagziria, E. Haddad, F. Rosei, and A.
Ruediger, “Temperature-dependent Raman spectroscopy studies of fibers,” Proc., Photonics and Fiber Technology, vol. JT4A.28, 2016 [OSA Advanced Photonics Congress, Australia].
´
Etude par spectroscopie optique de capteurs de
fibres optiques `
a temp´
eratures ´
elev´
ees
par Binod Bastola
Les fibres optiques sont faites de silice (SiO2), d’oxyde de silicium pur, une sorte
de sable ou de quartz raffin´e qui peut ˆetre dop´e par une s´erie de mat´eriaux. Par exemple, le cœur de la plupart des fibres monomode int`egre du germanium (Ge) qui donne lieu `a un m´elange homog`ene appel´e verre germanosilicate. Cela a pour effet de modifier l’indice de r´efraction du cœur de la fibre et cons´equemment l’absorption et l’´emission optique, menant `a des changements caract´eristiques de la fibre. Ainsi, c’est le syst`eme bi-mat´eriel compos´e du cœur dop´e de germanium et de la gaine ext´erieure de silice, tel que la fibre SMF–28 ou la structure tri-mat´erielle ayant comme revˆetement interne des dopants additionnels tel que la fibre GF1B (se r´ef´erer au tableau 3.1.1 pour les param`etres importants des diff´erents type des fibres). Ces fibres optiques et ces fibres `a r´eseaux de Bragg (FRBs) qui sont consid´er´ees comme des canaux `a lumi`ere soit pour un r´eseau de communication rapide ou pour une illu-mination, les exploits de la technologie qui promettent au–del`a de la preuve de fais-abilit´e en laboratoire, contribuent `a transformer plusieurs secteurs d’industries pour un nombre croissant d’applications dans, par exemple, les amplificateurs utilis´ees en t´el´ecommunication, les gyroscopes en fibre optique utilis´es en a´erospatiale, les capteurs 3D chirurgicaux, les turbines et les r´eacteurs. Ces industries doivent con-stamment inspecter leurs installations r´eguli`erement et de mani`ere rentable, entre autres pour une meilleure d´etection de temp´erature et de pression. Tr`es souvent, ils utilisent des techniques de mesures de fibres optiques, exploitant normalement des effets au sujet des limitations des syst`emes de t´el´ecommunication. Leurs avan-tages incluent la fiabilit´e, la rentabilit´e et, dans plusieurs secteurs, la technique est consid´er´ee comme ´etant plus fiable lorsque expos´ee `a un traitement dur, et ne n´ecessitant pas de puissance ´electrique `a la tˆete du capteur. Les fibres optiques sont prot´eg´ees contre les interf´erences ´electromagn´etiques, elles sont de petites tailles, ont une haute r´esolution, et offrent des configurations d´ecentralis´ees.
Dans cette dissertation collaborative avec l’industrie–partenaire sp´ecialis´ee de d´evelopper des solutions de capteurs commerciaux, pratiques et destin´ees `a l’intention de l’utilisateur final, ce projet, qui est bas´e principalement sur la d´etection par les fibres optiques, traite des fibres de verre et des FRBs pour la d´etection `a de hautes temp´eratures et dans des environnements rudes, principalement pour des applications en a´erospatiale. Durant la rentr´ee dans l’atmosph`ere, les mat´eriaux expos´es (dot´es de bonnes car-act´eristiques et de bonnes performances a´ero–thermo–dynamique) des v´ehicules spa-tiaux font face `a de s´ev`eres charges de chaleur sous l’influence de vitesses hyperson-iques, ce qui provoque des augmentations de temp´eratures qui peuvent affecter le fonctionnement et, par cons´equent le besoin d’une r´etroaction en temps r´eel de la surveillance de l’´etat ´etant donn´e que la temp´erature et la d´eformation sont cri-tiques. Ceci est le contexte o`u le projet prend la route avec une approche optique fiable connue, le capteur FRB. Le but est, cependant, d’aborder le probl`eme critique de la stabilit´e du FRB dop´e de germanium `a haute temp´erature (au–del`a de 850◦C).
Ce projet est enti`erement bas´e sur l’utilisation de recuit thermique de longue dur´ee dans le but d’optimiser un traitement thermique visant `a am´eliorer l’efficacit´e du capteur de fibre et pour comprendre le m´ecanisme de r´eg´en´eration du FRB. Le choix du mat´eriau de la fibre optique n’est pas seulement `a cause du caract`ere inerte de la fibre, mais aussi parce que c’est le choix id´eal pour la surveillance `a long-terme avec capacit´e de s’imbriquer dans les structures. De ce fait, toute variation de temp´erature ou de d´eformation localement sur la fibre attach´ee `a sa surface peut ˆetre imm´ediatement d´etect´ee. La th`ese, par contre, entreprend des recherches sur les capteurs de temp´erature de FRB pour des applications en a´erospatiale ´etant donn´e que le proc´ed´e d’optimisation pour les applications `a hautes temp´eratures est cri-tique. Par cons´equent, le cœur de la th`ese concerne les instabilit´es de temp´eratures associ´ees `a a) la r´eflectivit´e des FRB et `a b) la d´ependance en temp´erature des mat´eriaux de fibres de verre et des d´efis reli´es `a la prise de mesures. Les para-graphes qui suivent d´etailleront les ´etapes-cl´es concern´ees.
(i) Photosensibilit´e
L’utilisation de fibres de t´el´ecommunication ne requiert non seulement de faibles pertes intrins`eques sur une certaine fenˆetre optique mais dans la plupart des cas, elle requiert aussi une certaine photosensibilit´e de la fibre notamment pour le mar-quage par UV des FRBs. `A cause de la photosensibilit´e, les propri´et´es des fibres (notamment l’indice de r´efraction du cœur de la fibre) peuvent changer suite `a une exposition `a la lumi`ere (UV pour la plupart des cas, mais `a cause de l’absorption multiphoton, les longueurs d’ondes plus ´elev´ees sont aussi admissibles). Dans les fibres de t´el´ecommunication courantes, la photosensibilit´e est atteinte en dopant
avec d’autres ´el´ements (terres rares). Par l’ajout de germanium pendant le proc´ed´e de fabrication (fibrage), des liens Ge − Si, Ge − Ge et Si − Si, couramment ap-pel´es «faux liens» ou «centre d´eficient germanium–oxyg`ene» (GOCD), sont form´es (se r´ef´erer `a la section 1.4). Ces faux liens semblent jouer un rˆole important pour l’accroissement de la photosensibilit´e dans la gamme spectrale des UV `a cause du bris des liaisons pendant l’exposition aux UV, ce qui g´en`ere des bandes d’absorption r´eduites. Pour la fabrication des FRB, le pic d’absorption aux alentours de 240 nm (assign´e au GeO) est aussi utilis´e tout comme le pic d’absorption `a 185 nm (assign´e au GeO2) tel que repr´esent´e sur la figure 1.4.2. Cependant, pendant l’exposition
aux UV, les faux liens se rompent en lib´erant un ´electron et en laissant un d´enomm´e ainsi GeE0 (atome de Ge ayant un ´electron li´e `a trois atomes d’oxyg`ene, voir la
figure 1.4.1). Les d´efauts GeE0 semblent constituer le facteur le plus important dans
l’augmentation de l’indice de r´efraction durant le marquage par UV de la FRB et peuvent ˆetre directement correl´es au changement d’indice de r´efraction du FRB, tel que repr´esent´e `a la figure 1.4.3.
Les ´electrons lib´er´es par le rayonnement UV se d´eplacent dans la bande de conduc-tion du verre et peuvent ˆetre pi´eg´es dans les centres F. De plus, les ´electrons peuvent sauter sur l’atome d’oxyg`ene de la liaison Ge − O et causer la rupture de cette liai-son en laissant un atome d’oxyg`ene charg´e n´egativement (centre de trous d’oxyg`ene non liant ou NBOHC, voir la figure 1.4.1) avec un autre d´efaut GeE0 (≡ Ge). Outre
cela, durant le processus du fibrage, les faux liens peuvent ˆetre rompus par une d´eformation de traction et il en r´esulte des radicaux Ge
..
Si et Ge..
Ge, qui sont aussi connus sous le nom de d´efauts induits par fibrage (DID, voir la figure 1.4.1). La quantit´e de DID croˆıt avec l’augmentation de la vitesse de fibrage durant le proces-sus, ce qui cr´ee des tensions suppl´ementaires. De plus, la hausse de la vitesse de fibrage diminue la photosensibilit´e effective de la fibre `a cause de la quantit´e r´eduite de faux liens.(ii) Charge en hydrog`ene
Un autre moyen d’accroˆıtre la photosensibilit´e de la fibre est de charger la fibre avec de l’hydrog`ene sous haute pression avant l’exposition UV. Durant l’exposition UV, les diff´erents groupes d’hydroxyle (OH), `a savoir le Si − OH et le Ge − OH, sont form´es dans le cœur de la fibre (voir l’´equation 1.11), le cœur ´etant connu pour ˆetre de temp´erature plus stable (jusqu’`a 1200◦C), voir la r´ef´erence 1.4. Ces groupes
OH augmentent l’indice de r´efraction. Durant l’exposition UV, le Ge est promu `a un niveau d’´energie plus ´elev´e. Sans la pr´esence d’hydrog`ene, le germanium excit´e
pourrait revenir `a son ´etat fondamental apr`es une courte p´eriode de temps. Mais, en pr´esence de l’hydrog`ene, l’´etat excit´e r´eagit avec l’hydrog`ene pour former un d´efaut GeE0, un groupe OH et un atome d’hydrog`ene. Cet atome d’hydrog`ene peut
soit briser les liaisons GeO, qui sont connus pour ˆetre plus faibles que les liaisons SiO, pour former plus de d´efauts GeE0 ou pour r´eagir avec les d´efaut GeE0 pour
former des hydrates (porteurs d’hydrog`ene) tel que le GeH, qui lui aussi peut aug-menter l’indice de r´efraction. Par ailleurs, l’hydrog`ene peut aussi briser les liaisons Si − O − Si pour former des hydroxyl et des hybrids tel que propose par Shelby, voir la r´ef´erence 1.4.
Pour am´eliorer la structuration du r´eseau, les fibres sont laiss´ees pour ˆetre charg´ees en hydrog`ene `a la temp´erature de la pi`ece dans une chambre `a pression ´elev´ee qui convienne (∼ 200 psi) pour 120 heures. Cette ´etape de fabrication r´eduit l’´energie des rayonnements UV requise pour la structuration des FRB, le proc´ed´e est ap-pel´e passivation ´etant donn´e que les liaisons bris´ees sont passiv´ees par des atomes d’hydrog`ene dans de la silice amorphe par la r´eduction de liaisons pendantes qui peuvent modifier la diffusivit´e et am´eliorer la modulation de l’indice de r´efraction. Apr`es avoir retir´e les fibres de la chambre `a pression, elles sont entrepos´ees dans un cong´elateur `a −20◦C pour ´eviter que l’hydrog`ene ne diffuse `a l’ext´erieur de la fibre
avant le marquage du r´eseau. Ces travaux collaboratifs sont men´es au laboratoire MPB de Montr´eal et `a l’Universit´e de Munich en sciences appliqu´ees en Allemagne. Pour les param`etres des fibres et des param`etres de chargement d’hydrog`ene, se r´ef´erer au tableau 3.1.1.
(iii) La photoexposition UV `a motifs de franges
Ce projet industriel d´epend de a) la structuration `a l’´echelle submicronique de fibre de verre de silice avec un masque de phase en utilisant des outils d’optique de tr`es haute pr´ecision et b) son analyse thermique. Le proc´ed´e de fabrication industriel pour graver un r´eseau d’indice de r´efraction qui varie p´eriodiquement dans le cœur d’une fibre utilise un syst`eme de gravure lat´eral en se servant d’un masque de phase tr`es pr`es de la fibre. Le changement permanent en fonction de la modulation de p´eriodicit´e spatiale de l’indice de r´efraction du cœur est cr´e´e en exposant le cœur de la fibre `a un rayonnement UV `a travers un masque de phase afin de g´en´erer un patron d’interf´erence du champ optique UV. Un tel patron d’exposition, qui a une p´eriode de 0.5 µs produit une r´eflectivit´e de 1500 nm dans la bande de fr´equences t´el´ecom.
de Munich en sciences appliqu´ees en Allemagne, le pas du r´eseau initial (avant att´enuation) est grav´e soit avec un laser UV `a 248 nm ou un laser `a 193 nm et typiquement sur une longueur de ∼ 10 `a 12 mm avec environ 20000 structures p´eriodiques sur une fibre standard en germanosilicate. Pour le marquage, les fibres de 50 cm de long charg´ees en hydrog`ene (voir le tableau 3.1.1 pour les propri´et´es des fibres optiques) sont d´enud´es m´ecaniquement au milieu de la fibre sur une longueur approximative de 4 cm. La fibre d´enud´ee est plac´ee parall`element `a une masque de phase avec une distance efficace d’environ 100 um. La lentille de focalisation est install´ee `a 3 mm de son point focal afin de ne pas d´etruire la fibre par une fluence de radiation ´elev´ee. En bougeant le miroir continuellement et avec une exposition laser continue, la longueur du r´eseau de 12 mm est fabriqu´ee par un seul balayage. Le balayage est n´ecessaire `a cause du profil rectangulaire du faisceau du laser exciplex (environ 3 mm × 5 mm). Le pic de r´eflectivit´e d’un r´eseau Bragg est maintenu sous surveillance durant le marquage avec un syst`eme d’interrogation (micron SM125), typiquement, une bande ayant une r´eflectivit´e de 99 % aux alentours d’une longueur d’onde centrale de 1500 nm est atteinte grˆace `a la longue exposition UV pendant chaque balayage.
(iv) D´etection de la temp´erature par le r´eseau de Bragg
La d´etection par FRB se sert de fibres optiques pour capter les changements physiques via une interaction avec une microstructure r´esonante (typiquement longue de quelques millim`etres dans le cœur de la matrice de silice) d’une fibre monomode. Le principe de fonctionnement est bas´e sur la d´etection du d´ecalage en longueur d’onde des sig-naux r´etro–r´efl´echis dans une ´etendue spectrale ´etroite, aussi connu sous le nom de longueur d’onde de Bragg. La sensibilit´e en temp´erature (T) de la longueur d’onde de Bragg (λB) d´epend de la p´eriodicit´e du r´eseau (Λ) et de l’indice de r´efraction
effective (nef f) du cœur de la fibre (λB(T ) = 2neff(T ) · Λ(T ). Le facteur dominant
qui contribue `a cela est la d´ependance en temp´erature de l’indice de r´efraction in-duite par effet thermo-optique sur l’expansion thermique de la silice. Le proc´ed´e de recuit sur les propri´et´es du mat´eriau des fibres optiques tend `a appliquer cette technique pour la d´etection de temp´eratures tr`es ´elev´ees (au–del`a de 1000◦C), ce
qui d´efinit un nouveau type de FRBs appel´es fibres de r´eseaux de Bragg r´eg´en´er´ees (FRBRs). Typiquement, la fabrication de FRBR implique la production d’un pas de r´eseau initial (avant att´enuation) d’un FRB de type–I (se r´ef´erer `a la section2.2.1). Cependant, la fibre optique de base n’est pas un choix appropri´e pour des appli-cations de temp´erature ´elev´ees sans compter que les r´eseaux de type I ne sont pas assez stables pour ˆetre op´erationnels `a de hautes temp´eratures et commencent `a
att´enuer lorsqu’ils sont expos´es `a des temp´eratures au–del`a de 300◦C. Mais ces
r´eseaux peuvent ˆetre optimis´es par un proc´ed´e appel´e r´eg´en´eration de sorte que les FRBR ont d´emontr´e un grand potentiel pour des mesures `a hautes temp´eratures et en exploitant davantage de propri´et´es, en particulier en continuant le post-recuit `a des temp´eratures plus hautes. Le processus de r´eg´en´eration est effectu´e la plupart du temps par recharge d’hydrog`ene ou de deut´erium de la fibre avant le marquage par UV o`u les effets de tels facteurs de changement des r´eseaux qui cr´eent un envi-ronnement propice `a la r´eg´en´eration sont moins bien compris et le d´eveloppement de mod`eles (e.g., mod`ele de composition chimique, relaxation de stress, densification, etc.) responsables pour des m´ecanismes sous-jacents et des propri´et´es d´ependantes de la temp´eratures associ´ees `a ces pi`eces micro–usin´ees de verre et de FRBR est au stade de d´eveloppement. Ainsi, dans cette th`ese, le projet traite des techniques op-tiques qui sont d´efinis sur la base de m´ethodologies utilisant des techniques macro-scopiques ph´enom´enologiques et par la mise en place d’une spectroscopie Raman
in–situ d´ependante de la temp´erature pour ´etudier les fibres optiques et les FRB et
la fa¸con dont les param`etres des fibres (e.g., recharge en hydrog`ene, relaxation du verre, les dopants et les contraintes de la fibre) att´enuent ou influencent le processus de r´eg´en´eration.
(v) Ph´enom´enologie macroscopique
L’att´enuation thermique dans la capacit´e de d´etection des FRB standard (type–I) limite l’utilisation des capteurs `a des applications moins critiques `a des temp´eratures de manœuvre sous 200◦C. Les efforts de la derni`ere d´ecennie dont men´e au d´eveloppement
de nouveaux types de r´eseaux o`u les r´esultats les plus prometteurs sont obtenus pour des capteurs FRBR qui peuvent r´esister `a des temp´eratures au-del`a de 1000◦C. La
fabrication des capteurs de FRBR implique un traitement de recuit post-marquage durant laquelle le signal r´efl´echi initial subit une att´enuation en-dessous du niveau de bruit et par la suite se rattrape `a des valeurs inf´erieures initiales du r´eseau (typique-ment <40 %). Cependant, le m´ecanisme principal pour le proc´ed´e de r´eg´en´eration thermique n’est pas totalement compris, d’o`u le besoin de d´evelopper de nouvelles approches pour augmenter les taux de rattrapage et la stabilit´e `a long terme (qui s’av`ere cruciale pour des applications en a´erospatiale).
Dans les ´etudes macroscopiques, la dynamique du processus de r´eg´en´eration ther-mique est analys´ee en r´eg´en´erant isotherther-miquement `a une ´etendue de temp´erature de 700 -1000◦C. Une source laser `a bande large en erbium (Er) entre 1530 –1565 nm
est coupl´ee `a un analyseur de spectres optiques (OSA) ou un ondem`etre Burleigh `a travers diff´erentes fibres qui contiennent des FRBs et leur capacit´e de d´etection
la variation de temp´erature en utilisant un montage consacr´e pour ces mesures. La quasi-lin´earit´e de la r´eponse de la temp´erature est influenc´ee par le chauffage `a 900◦C
et par le refroidissement subs´equent des FRBs `a des temp´eratures ambiantes et la sensibilit´e de temp´erature observ´ee est approximativement 13 pm/K. La r´eflectivit´e ne semble pas changer avant que le r´eseau ne commence `a s’att´enuer jusqu’`a une temp´erature maximale durant le cycle de chauffage tandis que la largeur du pic diminue notablement `a des temp´eratures plus ´elev´ees que 300◦C, ce qui n’est pas
facile `a analyser puisque la m´ethode qu’on utilise pour extraire la largeur d´epend de la forme du pic (´etant donn´e que nous utilisons l’aire autour du maximum d’un pic pour le reconnaˆıtre et non sa base). Le d´elai temporel pour observer le change-ment dans l’intensit´e du pic est caus´e par la d´ependance au carr´e de la tangente hyperbolique (i.e., tan h2) en fonction du changement de l’indice de r´efraction de la
r´eflectivit´e. Apr`es un recuit isotherme `a 900◦C, la r´eflectivit´e et la largeur du pic
continuent de diminuer jusqu’`a sa compl`ete disparition dans le bruit, ce qui indique que les FRBs s’effacent par un processus activ´e thermiquement. Apr`es un temps de d´ecroissance de quelques minutes, la r´eflectivit´e et la largeur de pic r´eapparaissent et recommencent `a croˆıtre jusqu’`a ce qu’elles soient suffisamment stabilis´ees `a la valeur maximale, puis se remettent `a d´ecroˆıtre plus lentement.
`A 900◦C, il y a un d´ecalage vers le bleu constant qui affecte la longueur d’onde
centrale durant la r´eg´en´eration, ce qui indique qu’en moyenne, la structure de verre a des propri´et´es alt´er´ees qui voient une diminution de l’indice de r´efraction du cœur. Les courbes de calibration sont obtenues pour tester les caract´eristiques de FRBRs. Ceci a ´et´e effectu´e par un code Matlab qui extrait automatiquement tout param`etre exp´erimental pertinent par une s´equence d´ependante en temps et en temp´erature des spectres et qui m`ene `a une nouvelle m´ethodologie pour am´eliorer la r´eflectivit´e des FRBs. Une relation inverse entre la temp´erature et l’efficacit´e de la r´eg´en´eration a ´et´e ´etablie (bas´ee sur le fait qu’en ralentissant le processus de r´eg´en´eration, on augmente l’efficacit´e de restauration du signal). Ceci atteint une efficacit´e de restauration au-dessus de 85 % du pas de r´eseau orignal avant att´enuation. Surtout, l’avantage d’un cycle de r´eg´en´eration lent est aussi pr´eserv´e sur des mesures de stabilit´e `a long terme `a 1000◦C sur 500 heures, permettant ainsi une application potentielle pour le
d´eveloppement de fibres r´esistantes `a de hautes temp´eratures. De plus, une nouvelle approche qui a nous a permis de d´eterminer l’´energie d’activation du m´ecanisme de r´eg´en´eration (qui suit une tendance d’Arrhenius) nous a permis de pr´edire le d´eclenchement de la r´eg´en´eration du signal r´efl´echi avec grande pr´ecision. Nous dis-cutons des trouvailles exp´erimentales bas´ees uniquement sur le transport diffusionnel ou sur la densification induite par contrainte ´etant donn´e que ces deux effets ont leur
rˆole `a jouer dans le processus de r´eg´en´eration thermique. Finalement, en prenant la r´eflectivit´e et la largeur du pic comme des observables, nous d´erivons un mod`ele sim-ple, ph´enom´enologique et quantitative pourtant capable d’expliquer avec pr´ecision le processus de r´eg´en´eration concernant `a la fois la disparition et le restauration de la r´eflectivit´e de la FRB ce qui nous ´eclaire sur l’impact de la temp´erature sur la structure interne de la fibre de verre d´ependante du temps (par exemple, l’indice de r´efraction). Plus de d´etails sont donn´es dans le chapitre 4 ci–dessous.
(vi) Mesures Raman in–situ et mesures de photoluminescence
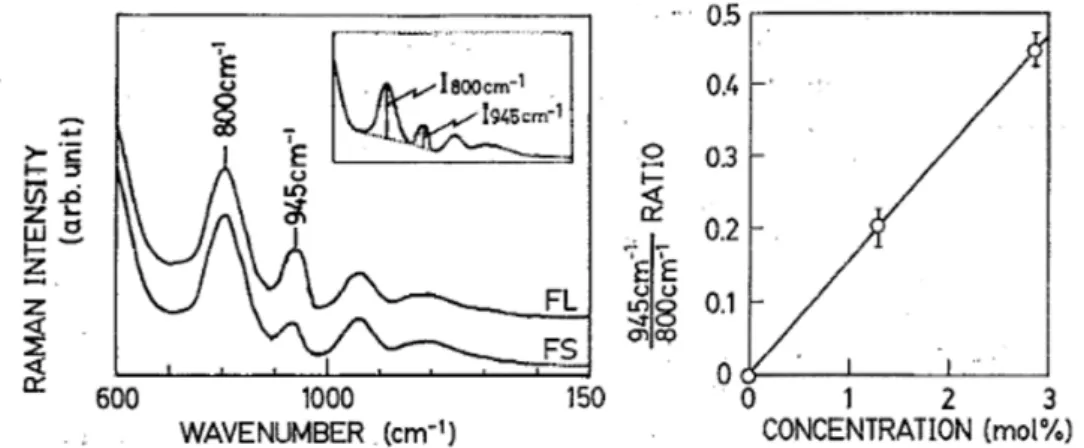
Le d´efi de la spectroscopie optique sur le verre est en rapport avec sa figure de m´erite, de faibles pertes en transmission optique, tandis qu’une interaction in´elastique est particuli`erement utile dans les ´etudes en hautes temp´eratures et `a la base de la plupart des approches spectroscopiques. Les exemples incluent les mesures spectro-scopiques en Raman et en photoluminescence des fibres optiques en verre qui sont d´etectables mˆeme `a hautes temp´eratures cependant, nous choisissions ces approches comme des techniques d’analyses pr´eliminaires dans ces ´etudes. a) L’intensit´e de la diffusion Raman d´epend non seulement sur la densit´e d’´etats de vibration, mais aussi sur le couplage entre les photons et les vibrations o`u une diffusion est in-trins`eque aux propri´et´es de la fibre et peut ˆetre fonction de la temp´erature et de la d´eformation. La quantit´e d’´energie perdue par un photon issu d’un laser est vue comme une variation en ´energie (fr´equence) du photon qui irradie de sorte que cette perte d’´energie est caract´eristique pour une liaison particuli`ere dans la struc-ture du verre, appel´ee signastruc-ture spectrale. Le d´ecalage en fr´equence qui r´esulte du changement de longueur d’onde peut ˆetre rep´er´e par le capteur, o`u la d´ependance en temp´erature du signal Raman peut alors ˆetre mesur´ee pr´ecis´ement en fonction de la fr´equence d’excitation. b) Dans un autre ordre d’id´ees, la technique d’´emission de photoluminescence est capable de mesurer les caract´eristiques du recuit ou encore la d´ependance de temp´erature des d´efauts sur une gamme ´etendue de temp´eratures. La bande large de photoluminescence dans le silicate et le verre de germanosilicate qui correspond aux centres de d´eficiences en oxyg`ene (ODCs), aux centre de trous d’oxyg`ene non liant (NBOHCs), et aux d´efauts Ge–H induits par l’hydrog`ene sont bien connus. Ces bandes de photoluminescence qui sont d´etect´es dans la gamme du visible sont produites par des transitions permises de niveaux d’´energie localis´ees. L’originalit´e de l’approche dans cette th`ese est le fait de faire les mesures `a l’in–situ et longitudinalement au cœur de la fibre en b´en´eficiant d’un volume plus grand et d’une longueur d’interaction plus grande des mesures ex–situ des FRBR en-treprises pr´ec´edemment dans notre groupe de recherche, o`u des cartographies Raman transversales ont ´et´e ex´ecut´ees pour contrˆoler les centres de d´efauts dans le cœur
nescence fournissent des d´etails des ´emetteurs de d´efauts g´en´er´es dans le cœur de la fibre durant le marquage des FRB de sorte que nos ´etudes se concentrent sur les centres de photoluminescence situ´es dans le cœur et `a l’interface cœur-gaine, ainsi l’ensemble des modes qui occupent un volume plus grand interagissent avec l’onde ´electromagn´etique.
Dans ce projet, la premi`ere ´etape de la pr´eparation d’´echantillon `a une jointure s’accordant bien est obtenue durant le processus de la cr´eation d’un clivage net et plat sur les fibres. Cela n´ecessite l’enl`evement du revˆetement et le nettoyage de la surface de la fibre de verre pour s’assurer qu’aucun r´esidu ne reste sur la fibre d´enud´ee. Ensuite, le sondage implique d’approcher le laser de l’espace (loin de la fibre) `a la fibre qui a ´et´e plac´ee sur l’unit´e de lanceur de la fibre (fiber launcher unit), qui contrˆole grˆace `a un micropositionneur dans les trois directions de l’espace dans le but de centrer la fibre pour avoir une efficacit´e de couplage optimale. Ensuite, cela requiert de garder la portion de la fibre `a l’int´erieur de la zone de chauff´ee du four et finalement de focaliser les lentilles du scanner du microscope dans le spectrom`etre Raman. Les mesures macroscopiques et les mesures Raman in–situ ont ´et´e effectu´ees dans une g´eom´etrie de transmission sur a) des fibres optiques de verre pur et b) des FRB de type–I dans des fibres charg´ees en hydrog`ene du mˆeme type. Les d´etails des param`etres importants des diff´erentes types de fibres qui sont utilis´ees dans l’´etude sont pr´esent´es dans le tableau 3.1.1. Un cheminement prometteur vers une compr´ehension microscopique est la corr´elation quantitative des observations macroscopiques telle que la r´eg´en´eration et le contraste d’indice de r´efraction avec des traits microscopiques parmi les d´efauts ponctuels, les d´efauts ´etendus et les d´eformations. La plupart des proc´ed´es reli´es sont activ´es thermique-ment de sorte que les propri´et´es d´ependantes en temp´erature de la luminescence des d´efauts ponctuels et de la d´etection Raman des d´efauts ´etendus et des d´eformations donnent une indication du rˆole des dopants dans la fibre de verre. Sachant que ces propri´et´es ph´enom´enales peuvent en d´efinitive aider `a comprendre les processus macroscopiques et microscopiques.
Pour des mesures Raman et des mesures de photoluminescence, un laser de 473 nm avec un mode TEM00 est coupl´e `a un spectrom`etre optique par diff´erentes fibres o`u
le volume occup´e par l’ensemble des modes qui est sond´e s’´etend en dehors du cœur et donc interagit aussi avec la gaine. Les fibres sont alors soumises cycliquement `a la temp´erature de la pi`ece et 950◦C. La longueur d’onde 473 nm est loin de toute
ab-sorption fondamentale et les intensit´es utilis´ees dans ce travail sont environ de deux ordres de grandeur en-dessous de ceux rapport´es par des ´etudes sur les changements
d’absorption photo–induits. Par une premi`ere observation, nous pouvons clairement remarquons une ´emission de rouge par les fibres d´enud´ees `a l’endroit des r´eseaux de fibres de Bragg. Cette d´ecouverte donne un point de d´epart pour l’assignation des pics de luminescence. En mod´elisant ce spectre de luminescence avec une Gaussi-enne et en surveillant l’intensit´e en fonction de la temp´erature, il a ´et´e r´ev´el´e une d´egradation activ´ee thermiquement et irr´eversible de la luminescence associ´ee aux FRBs. Une inspection de plus pr`es de fibres de verre pures sans FRBs a r´ev´el´e une luminescence l´eg`ere mais thermiquement stable avec des caract´eristiques spectrales similaires. En suivant un comportement d’Arrhenius, les deux types de lumines-cences permettent un moyen simple pour d´eterminer les ´energies d’activation, ce qui indique soit des d´efauts diff´erents qui serait `a la base de cette ´emission ou encore des environnements structuraux ou chimiques diff´erents pour le mˆeme d´efaut. Le d´efi cl´e de cette s´erie d’exp´eriences est de s’assurer qu’il n’y avait pas de d´erive de la temp´erature du couplage de la fibre dans le cas contraire, avant chaque mesure, le cœur de la fibre aurait besoin d’ˆetre de nouveau align´e. Ceci limite la r´esolution dans le temps des diff´erents taux de chauffage, permettant uniquement la comparaison qualitative des ´energies d’activation entre le premier et le second cycle de chauffage sous u profil de chauffage identique mˆeme si leur ratio exact d´ependrait toujours des conditions de chauffage. Les activations d´ependantes en temp´erature dans les fibres ont de grandes chances de d´ependre sur un cœur de germanium hautement dop´e sur l’influence du co–dopant (e.g., fluor) tandis qu’un dopant quelconque (e.g., phosphore dans la fibre GF1B) ne montre pas d’effet sur la forme des pics de lumi-nescence et du nombre d’onde des pics. Plus de d´etails sont donn´es dans le chapitre 5 ci–dessous.
Les r´esultats–cl´es de cette approche potentielle a d´ej`a montr´e la capacit´e de pousser plus loin cette technique pour une compr´ehension plus en profondeur de cette belle pi`ece de science des mat´eriaux pour le verre, par exemple une perspective d’int´egrer l’interf´erom´etrie dans notre spectrom`etre optique existante peut offrir la r´eflectivit´e simultan´ee et des mesures de spectres Raman de la structure du verre sur la r´eg´en´eration des FRBs par r´eflectivit´e. Ce projet est d´ej`a en d´eveloppement `a travers des collaborations et un nouvel ´etudiant qui vient de commencer `a travailler dessus pour produire un m´emoire de maˆıtrise sur ce projet.
As I am transitioning on the next phase of my career goal – I wanted to take a moment to say “thank you.”
My experience has been amazing to work in a passionate team, with the inspiring professors, and my colleagues in INRS-EMT over the past four years. It has been fascinating and educational years for me, and I am proud of being part of such a talented and motivated Nanophotonics team led by my supervisor and mentor, Prof. Andreas Ruediger who’s terrifically brainy, generous person with his time, advice and encouragement, because without it I don’t believe I’d have gotten this far. I would like to acknowledge for his coaching, phenomenal support and extend my deepest gratitude for the highly competitive NSERC strategic partnership project opportunity, which was also being spearheaded by an industrial sector principal, Emile Haddad from MPB Photonics Inc. I would also like to thank Dr. David Barba from INRS-EMT, Dr. Mert Celikin from University College Dublin, Prof. Johaness Roths and Bennet Fischer from Munich University of Applied Sciences for their potential collaborations, and many, many others for their contributions and support throughout the duration of this thesis. Thank you for all the incredible learnings, memories, and fun. I would like to thank jury committee for a construc-tive feedback, the contributions were invaluable.
Thanks to all the mentors who guided and taught me, all are remembered. And thank you to my parents, relatives, and friends, who are nearby and miles away yet always made feel as though I make them proud and give me constant inspiration to make them prouder. To my dear wife, Sudha Sharma, my angel – I can’t thank you enough for your constant love, and support. I am incredibly excited for what lies ahead!
1 Introduction 1
1.1 Relevance and motivation of project . . . 2
1.2 Fiber optic sensing basics . . . 4
1.3 Glass science basics . . . 6
1.3.1 Structure of glass . . . 6
1.3.2 Temperature dependence of fiber optic glass properties . . . . 7
1.4 Enhancing photosensitivity . . . 11
1.5 Scope of thesis . . . 15
2 Fiber Bragg Grating 17 2.1 Fiber Bragg grating parameters . . . 17
2.2 Grating types . . . 20
2.2.1 Type-I grating . . . 20
2.2.2 Type-II grating . . . 22
2.2.3 Regenerated grating . . . 23
3 Materials and Methods 27 3.1 Fiber properties and types . . . 27
3.2 Seed gratings manufacturing . . . 28
3.3 Launching light into a single mode fiber . . . 29
3.4 Raman spectroscopy . . . 30
3.5 Photoluminescence spectroscopy . . . 34
3.6 Role of fiber dopants and hydrogen loading . . . 35
4 Phenomenological Macroscopic Characterization 49 4.1 Temperature dependent phenomenological study . . . 49
4.2 Peak-wavelength-detection algorithm . . . 50
4.3 Calibration of fiber Bragg grating sensor . . . 53
5 In–situ Spectroscopic Characterization 65 5.1 Measurement setup . . . 65
5.2 Raman measurements . . . 66
Contents
6 Conclusions and Perspectives 93
Contents
Abbreviations
CCD - Charge-Coupled Device
CCG - Chemical Composition Grating CTE - Coefficient of Thermal Expansion DID - Drawing-Induced Defect
EMI - Electro-Magnetic Interference FBG - Fiber Bragg Grating
fs-Grating - Femtosecond Grating FTIR - Fourier-Transform-Infrared
GODC - Germanium-Oxygen-Deficient Center GRIN - Gradient Index
IR - Infrared
KrF - Krypton Fluoride
MM - Multimode
NBOHC - Non Bridging Oxygen Hole Center PL - Photoluminescence
PM - Phasemask
RFBG - Regenerated Fiber Bragg Grating RI - Refractive Index
SM - Singlemode
TIR - Total Internal Reflection UV - Ultra Violet
1 Introduction
Ever since the first demonstration of in-fiber Bragg gratings (FBGs) by Ken Hill in Canada in the year 1978 [2], scientists and materials engineers are pushing the limits potentially well beyond a laboratory and telecommunications interest to-wards emerging applications. Optical fiber sensors and more specifically FBGs, key telecom-enabling technology, have optical filtering or reflecting ability to elim-inate a given narrow frequency band. Their temperature and strain-dependence play a central role in a multitude of applications for temperature and strain moni-toring (in aerospace, oil, nuclear, civil engineering, for example) [3–7]. Fiber optic sensing technologies are particularly suitable under the influence of harsh environ-ments, high temperatures for example, but even glass fibers also are subjected to material properties changes and thermal degradation above a few hundred degrees Celsius, thereby limiting applications. In particular, the gratings necessitate ther-mal stability and enhanced lifetime that can be realized through ”regenerated fiber Bragg gratings (RFBG)” [8,9]. RFBG are the elevated temperature induced index-modulation having much of the spectral features of a seed grating [10] that exhibit robust thermal stability like the femtosecond (fs) grating. For restoration of such stable FBGs in optical fiber, H2-loading and appropriate annealing techniques are
required. Therefore, the aim is mainly two-fold focussing on development of FBG for use in the identification of operational safety above 1000◦C in collaboration with
MPB Technologies Inc. and investigations of the glass structure and their thermal properties.
Recent years have seen tremendous progress in in situ Raman diagnosis of glass to obtain a comprehensive microstructural picture and temperature-dependent proper-ties [11–16]. Understanding of the glass relaxation behavior as well as assessing the stress evolution have substantially progressed by a number of authors [17–23] and in particular, the Raman spectroscopy studies of such amorphous structures already have shown very positive outlook [24–27]. Until recently, most efforts were focused on bulk samples (e.g., silicate glass, germanate glass and melt) but data on optical fiber glass that contain GeO2 and SiO2 as the basic materials are sparse so our work
defines a status quo on the application of structural probe using in situ Raman and photoluminescence (PL) spectroscopy to account for the high temperature
instabil-ities in germanosilicate optical fibers [16].
This thesis is organized in a first part comprising chapters 1–2, and a second part, comprising chapters 3–5. The chapters 1–2 and section 3.6 cover a brief overview and a background on the specialized literature dealing with fiber optic sensors and fiber Bragg gratings. In this, the approach is mainly focused on a selection of rel-evant works that this thesis aims to clarify. This chapter 1 begins with the glass science basics, the temperature dependence, photosensitivity and the scope of the-sis. Chapter 2 includes fiber Bragg grating types and briefly highlight the grating regeneration thereof. Chapter 3 includes a detail background on the materials and the experimental methodologies used in this thesis. Chapters 4 and 5 present the experiments and the results. Chapter 6 draws the conclusions and briefly outlines perspectives for further work.
1.1 Relevance and motivation of project
There is a need for materials in aerospace vehicles with high aero-thermo-dynamic performances and characteristics. During atmospheric re-entry, the exposed materi-als encounter severe heat load under the influence of hypersonic velocity, which lead to ultra-high temperature field (>1000◦C). This affects operational safety and
mon-itoring the real time temperature of such critical structures is important. Despite there are issues associated with glass material under such elevated temperature, an innovative optical approach based on fiber optic sensing has the potential to address the concerns for such applications and environments. The main benefits of this ap-proach comprise reliability and low cost and in many industries, now the technique is considered safe. It is immune to EMI, having small size, high resolution, harsh en-vironment capabilities and distributed configurations. One example would be single mode fiber with multiplexed FBGs configuration or distributed temperature sensing (DTS) which could replace between a hundred to thousands of thermocouples.
Regarding the demerits, it comprises the behavior of optical fibers at high tem-peratures that raises important and unsolved questions regarding the recovery and stabilization of FBGs. When holding a fiber long time continuously above 300◦C
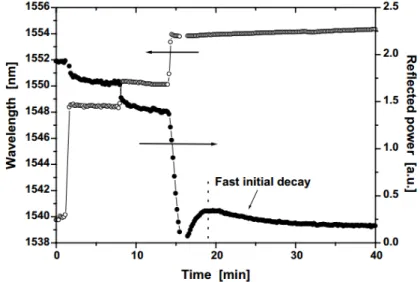
(threshold-like temperature necessary for the onset of regeneration [28]), the FBG reflectivity signal decreases continuously, then disappears on a time scale of a few minutes and is restored at a constant fraction of its nominal value. The dynam-ics of this phenomenon increase with temperature and remain so far unexplained. These regenerated gratings are robust and sustain repeated cycling at temperatures in excess of 1000◦C [15]. This PhD project centers on (a) structure-property
investi-1.1 Relevance and motivation of project gations of the degradation and regeneration processes associated with FBGs above 700◦C, and (b) leveraging regeneration process to enable strong gratings suitable for
operation above 1000◦C. In a, there is still ambiguity about the different mechanisms
(e.g., complex atomic diffusion and stress induced densification effects [9,28], chem-ical composition gratings - CCG [8,29], modulation of molecular water in the fiber’s core [30]) responsible for grating regeneration and understanding this phenomenon on a microscopic scale is important for many practical reasons I will explain in the following paragraph.
The FBG recovery process consists of a complex processing involving numerous pa-rameters such as gas loading (H2or He), UV-inscription power and laser wavelength,
the strength of initial (seed) grating and annealing cycle, but also the material prop-erties associated with multitude of fibers available and their composition. This thesis directs the attention to the study focused on RFBGs within hydrogen loaded stan-dard photosensitive optical fibers since this gives the most pronounced stabilization to date and is explored through academic and industrial collaborations. Another field of work in our group is the microscopic investigation by confocal Raman and PL imaging systems, equipped with a laser line (473nm) lower than the Bragg grating periodicity. Some interesting but preliminary results of the very first prob-ing of FBG refractive index modulation [1] by photoluminescence which provided information on the chemical composition of the materials, is motivating. The sys-tem is further upgraded with an additional fiber coupling unit to align optical fibers with micrometer resolution, then optical glass scattering between room temperature (RT) and 1000◦C is monitored continuously. This non-destructive characterization
technique correlates the spectral signature of the Ge-doped core fibers (at various stages of thermal processing) to the regeneration of reflectivity signal determined from phenomenological in-line measurements. By using this technique, we are not only able to see the role of dopants in photosensitive fibers (eventually regeneration behavior), we are able to extract strain, densification and chemical changes as a function of annealing temperature. Therefore, the result discussed, give an unique
in situ approach to dealing structural or chemical process upon high temperature
treatment through (a) observation of extended defects and strain by Raman and (b) temperature dependent reversible and irreversible changes associated to point defects in FBGs and optical fibers by luminescence spectroscopy. For this, the test set-up combines the pre-existing portfolio of spectroscopic technique requiring less than $10K worth of additional equipment.
1.2 Fiber optic sensing basics
Optical fiber based sensing technologies utilizing light-based technology receive a surge of interest thanks to enhanced monitoring, reliability and safety across tur-bines, reactors, aerospace, medical and power and pipelines, and downhole applica-tions in oil and gas industries, to name but a few. Fiber-based sensors are adopted for an ever increasing number of applications related to temperature and strain sensing constantly replacing electronic sensors (e.g., thermocouple, piezoresistive gauges). Electronic sensors is associated with low signal-to-noise ratio (SNR) due to the transmission of electrical signal along the wires. Thus, when it is exposed to electromagnetic (EM) fields, the electrical cable could behave as an antenna prone to environmental noise into the signal thereby compromising a high level of signal certainty. Multiplexing is another issue with electronic sensors due to band widths. On the other hand, fiber Bragg gratings (FBG) and scattering based fiber optic sen-sors possess the most prominent features such as small size, immunity to EM-fields and capability for multiplexing. The other advantage is that fiber optic sensing is intrinsically safe due to the lack of electrical parts, however relies on electricity buffered interrogator unit (laser and detector system), which is why an instanta-neous collection and analysis of material and structural data has become possible to understand the external environment—temperature, strain, vibration, etc. from miles away. In particular, there is no need for a power supply at the location of measurement.
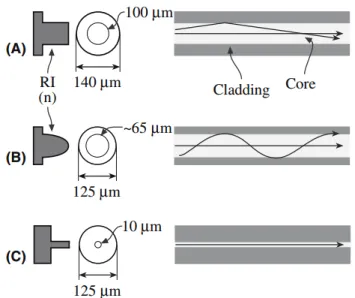
The phenomenon used to measure temperature, strain or vibration relies on the interaction between light and glass in a optical fiber. The most commonly used mechanism for light guiding in telecommunication and sensing applications is index guiding by total internal reflection (TIR) due to difference in refractive indices (RI) of core and cladding (figure 1.2.1). Other mechanisms are band gap guiding like in microstructured fibers [31].
1.2 Fiber optic sensing basics
Figure 1.2.1: Different types of TIR in glass fibers, their typical RI distribution and dimensions. (A): Multi mode (MM) step index fiber, (B): Gradient index (GRIN) fiber, (C): Single mode (SM) fiber [32].
Index guided fibers need a higher refractive index in the fiber core, achieved by dop-ing the core with elements like germanium and phosphorus to increase the refractive index or doping the cladding with elements like fluorine and boron which decrease the refractive index [33, 34]. Light guiding in fibers with large core diameters may be explained by TIR with common ray optics. However, in the used SM fibers the core diameter is in the range of the guided mode wavelength thus ray optics by TIR are not a sufficient solution anymore and the light guiding has to be described by wave optics. The propagation of EM waves in waveguides and fibers can be derived from the Maxwell equations leading to the Helmholtz-equation
~ ∇2· ~E = n2 c02 ∂2 ∂t2E~ (1.1) with ~∇2 = ∂2 ∂x2+ ∂2 ∂y2+ ∂2
∂z2, ~E as the electric field vector, n as the materials refractive
index and c0 as the speed of light in vacuum. While considering glass fibers, it is
advantageous to use cylindrical coordinates instead of cartesian coordinates:
∆U(ρ, ϕ, z) = ~∇2· U(ρ, ϕ, z) = 1 ρ ∂ ∂ρ ρ ∂U ∂ρ ! + 1 ρ2 ∂2U ∂ϕ2 + ∂2U ∂z2, (1.2)
with U as a placeholder for the electric field vector (same equations can be applied to the magnetic field vector). One of the possible solutions for the electrical field vector is [35]
~
E(ρ, ϕ) = (Et+ Ez·~ez)e−jβz. (1.3)
the longitudinal part of the electric field amplitude1, j denotes imaginary number
and β is the propagation constant which is defined as
β= k0neff, (1.4)
with neff as the effective mode index of the guided wave. This effective mode index
is defined as
ncladding< neff < ncore. (1.5)
It can further be shown [35], that the solution of the wave equation leads to the ’mode constraint’ for weak guiding (only refractive index variation, ∆n ≈ 10−3):
κ2+ γ2 = V2 (1.6)
Here, V2is the so called normalized frequency which describes the number of guided
modes within the fiber and is given by
V = 2πrcore λ0
q
ncore2− n2cladding = k0rcoreNA, (1.7)
with λ0 as the vacuum wavelength, k0 as the wavenumber, NA as the numerical
aperture, ncore and ncladding as the refractive index of the core and the cladding,
respectively. Single mode guiding is only attainable if the V-parameter is less than 2.405. However, the V-parameter should not be smaller than approx. 1.5. Otherwise high losses may occur if the fiber is disturbed [35]. From equation 1.6 the values of
κ and γ can be further expressed as [35] κ= rcore q k2 0n2core− β2 (1.8a) γ = rcore q β2− k2 0n2cladding. (1.8b)
1.3 Glass science basics
1.3.1 Structure of glass
Amorphous glasses, like silica (SiO2) and germania (GeO2), are one of the most
studied binary (MX2) materials [36, 37]. Amorphous glasses are distinguished from
crystalline materials (figure 1.3.1,A) by a nonperiodic atomic structure of randomly distributed tetrahedra (SiO4) which are arranged as so called rings (figure 1.3.1,B).
Additionally, the 3- and 4-membered rings in silica glass are called D2 and D1 defects, respectively.
1.3 Glass science basics
Figure 1.3.1: 2-dimensional structure of crystalline silica (A) and amorphous silica
(B). White circles represent silicon 4+ ions whereas black dots
repre-sent oxygen 2- ions [32].
For the crystalline silica, the molecular bonding angles of the Si-O-Si structure have specific values for each polymorph (e.g. α-quartz = 143.61◦) whereas the binding
angles for amorphous silica vary between 120◦ and 180◦ [36].
1.3.2 Temperature dependence of fiber optic glass properties
Different structures for crystalline glasses (e.g. silica) exist, also known as poly-morphs, depending on the athmospheric conditions as temperature and pressure. These polymorphs range from the most common thermodynamically stable α-quartz (rhombohedral crystal symmetry) over tridymite (orthorhombic symmetry) to α-cristobalite (tetragonal symmetry) and many other (see figure 1.3.2). Under stan-dard cooling conditions (very slow cooling, low and constant pressure), the glass would crystallize into an α-quartz. If such a sample would be heated, the initial
α-quartz would undergo phase changes as depicted in figure 1.3.2 resulting in new
forms. Swamy et al. showed that the phase diagram for crystalline and amorphous silica is identical [38]. If a non standard cooling process is used (e.g. rapid cooling of fibers), the glass does not have time to crystallize and hence the melt becomes an amorphous glass (structure depends on the temperature where the melt begins to solidify) [23].
Figure 1.3.2: Phasediagram of SiO2. At atmospheric pressure, different polymorphs
are possible depending on the temperature [32].
These polymorphs have the same chemical composition, but differ in their structure from the tetrahedral arrangement of the SiO2 to their neighbors resulting in
struc-tural changes as density, bonding distance, ring sizes, bonding and rotational angles. During heating, the thermodynamically stable α-quartz is transformed to β-quartz around 573◦C which has the same structure as α-quartz but with less distortion. If
the glass is heated to higher temperatures (867◦C) the β-quartz is transformed to
β-tridymite [36].
In case of network modifiers (dopants) added to the glass, the phase diagram changes and polymorphs are formed at different temperatures (decrease of melting point and glass transition temperature due to a disruption of the glass network) and pres-sures [36]. By adding dopants to the glass, Si-O bonds are ruptured depending on the modifier used [36]. This breakage results in so called bridging oxygens (Si-O-Si) and nonbridging oxygens Si-O−. If the dopant is similiar to silicon, e.g. germanium
which forms also GeO4 tetrahedra and a ring structure, less bonds are broken and
silicon in the tetrahedra are randomly substituted with germanium [37]. In addition, by adding germania into the silica network, the small SiO4 tetrahedral rings form
larger mixed rings of GeO4 and SiO4 [27], see figure 1.3.3. Amorphous germania
consists mainly of 6-membered rings connected to a random network and different bonding angles due to the higher mass of germania [39].
1.3 Glass science basics
Figure 1.3.3: Formation of mixed rings out of silica (yellow) and germania (red). As the bottom picture illustrates, 6-membered mixed rings are formed, while loosing 3- and 4-membered rings from silica and germania, re-spectively [27]. Note that this is for illustration and 4-membered rings are very unstable hence they are not very present in the glass net-work [39].
At higher temperatures, Henderson measured the breakage of mixed rings resulting in 3-membered GeO4 rings and 6-membered SiO4 rings [27]. However, by adding
different dopants, e.g. fluorine, the glass network becomes less distorted and more stable as the fluorine forms Si-F bonds which are stronger than Si-O bonds. Addi-tionally, fluorine substitutes OH-groups within the glass. Furthermore, the fluorine in the glass encourages structural relaxation during temperature processes [34,40].
(i) Refractive index (n)
The refractive index is the central optical property and probably the single most important parameter of a fiber material system. The refractive index dictated by the core portion of the irradiated fiber materials with and with out hydrogen loading is different and the FBG regeneration is effected thereof.
In a linear regime, the refractive index (n) as a function of temperature, considering
T0 and T as the starting and final temperature respectively, can be expressed as
n(T ) = n0 + dn dT(T − T0) ∴ dn dT = n(T ) − n0 T − T0
(iii) Coefficient of thermal expansion (CTE)
The coefficient of thermal expansion is a measure of the amount of volume change as a response to temperature or stress applied to a glass. For example, during fiber drawing process the differences in CTE could lead to net tensile stresses across core–cladding interface.
(iv) Fictive and glass transition temperature
For characterization of glasses, the so-called fictive temperature (Tf) is an important
parameter. It was introduced by Tool et al. [41] and is mostly used for theoretical calculations and comparison of samples. This temperature depends on the thermal history (e.g. the cooling rate during the fiber drawing process) of a glass and is therefore different for almost each geometry (e.g. fiber or bulk).
The fictive temperature Tf is defined as the temperature at which the extrapolated
glass line (which describes the state in which the glass behaves as a solid) intersects the extrapolated liquid line (which describes the state in which the glass behaves as a liquid), see figure 1.3.4. By altering the fictive temperature, the material proper-ties (e.g. density, RI, Young’s modulus [23]) of the final glass can be influenced.
Contrary to the fictive temperature, the glass transition temperature Tg is defined
as the temperature at which the extrapolated glass line and extrapolated liquid line cross for the minimal cooling rate which is the lowest cooling rate which still results in amorphous glass and not crystalline glasses. At this temperature (Tf, Tg),
mate-rial properties e.g. the CTE changes dramatically.
For slow cooling rates (fast enough to prevent crystallization) the glass melt starts to solidify in the α-quartz phase at Tg. For faster cooling, the glass melts starts
to solidify in a phase different from α-quartz at the fictive temperature. With increasing cooling rates, the solid state curve moves upwards resulting in a higher density as well as another intersection point of the extrapolated lines (Tf).
1.4 Enhancing photosensitivity
Figure 1.3.4: Dependency of the glass parameters on the temperature during the cooling process. As the temperature decreases the glass goes from its liquid state to the glassy state. The extrapolated lines of both states indicate the glass transition temperature for the minimal cooling rate and the fictive temperature for higher cooling rates [23].
Hence, in order to compare data from literature to measurements the sample needs to have the same thermal history (e.g. commercial products as fibers of the same type). Otherwise, the glasses might have different properties and are not compara-ble.
1.4 Enhancing photosensitivity
Using a telecommunication fiber for sensing applications does not only require low intrinsic losses at a certain optical window but in most cases also a certain photosen-sitivity of the fiber e.g. for UV inscription of FBGs. Because of the photosenphotosen-sitivity, fiber properties (e.g. the fiber’s core RI) can be altered by exposure to light2. In
common telecommunication fibers, the photosensitivity is achieved by doping the core with germanium, even though the effect of photosensitivity was already shown with other (rare-earth) elements [43, 44]. By adding of germanium during the fiber manufacturing process (fiber drawing), Ge − Si, Ge − Ge and Si − Si bonds are formed which are so-called ”wrong bonds” or germanium-oxygen deficient-center (GODC), respectively (see figure 1.4.1).
2In most cases UV light but also possible at higher wavelengths due to multiphoton absorption
Figure 1.4.1: Different types of defects which are related to the photosensitivity in optical glass fibers [29].
Those wrong bonds seem to be the most important bonds for the increase of the photosensitivity in the UV range due to breakage of the bonds during UV exposure resulting in reduced absorption bands (also known as bleaching) [45]. For FBG inscription, the absorption peak of about 240 nm (assigned to GeO, [46]) is commonly used although there are more efficient absorption peaks as for example at 185 nm (assigned to GeO2, [46]) as depicted in figure 1.4.2.
1.4 Enhancing photosensitivity
Figure 1.4.2: Different UV absorption bands in germania doped silica (10.7 wt.% Ge, circles) and germanium phosphosilicate (10 wt.% Ge, triangles) [46].
However, during UV exposure, the ”wrong bonds” break while releasing an electron and leaving a so called GeE0 defect3 (Ge atom with one unpaired electron bonded
to three oxygen atoms, see figure 1.4.1). As previous experiments have shown, GeE0
defects seem to be the biggest factor in the increase of the refractive index during the UV inscription of fiber Bragg gratings [48] as they correlate directly to the refractive index change, as depicted in figure 1.4.3.
Figure 1.4.3: Correlation between the amount of GeE0 centers and the change of the
RI during UV inscription (Laser fluence of 300 J/cm2) [48].
The UV induced reaction of the wrong bonds during the UV exposure is given by equation 1.9:
Ge − Ge hν
−→ GeE0 + GeO+3 + e (1.9a) Ge − Si hν
−→ GeE0 + SiO+
3 + e (1.9b)
The UV released electron moves within the conduction band of the glass where it might be trapped in color centres. Furthermore, the electron could move to an oxygen atom where the Ge − O bond is destroyed by capturing the free electron leaving a negative oxygen ion (non bridging oxygen hole center, NBOHC, see figure 1.4.1) together with another GeE0 (≡ Ge ) defect:
≡Ge− − O − Si −→ ≡ Ge + −O − Si ≡ (1.10) In addition, during the fiber drawing process the ”wrong bonds” can be ruptured by tensile strain resulting in Ge
..
Si and Ge..
Ge radicals, which are also known as ”drawing-induced defects” (DID, see figure 1.4.1) [49]. The amount of DID in-creases with increasing drawing speed during the fiber drawing process which creates additional tension [50].Hydrogen loading
Another way of increasing a fiber’s photosensitivity is by loading the fiber with hydrogen under high pressure before UV exposure. During the UV exposure, dif-ferent hydroxyl (OH) groups, namely Si − OH and Ge − OH, are formed within the fiber core (see equation 1.11) which are known to be temperature stable up to 1200◦C [51, 52]. These OH groups increase the refractive index [11]. For the
re-action of the glass network with the hydrogen molecules, different rere-actions were proposed [53, 54]. During the UV exposure of hydrogen loaded fibers, the following two step reaction of the glass network with the hydrogen was proposed [53]:
≡GeOT ≡−→ ≡hν Ge · · · OT ≡ (1.11a) ≡Ge · · · OT ≡ + H2 −→ ≡Ge + HOT ≡ + H (1.11b)
Here, the T stands for either a Ge or Si atom. During the UV exposure, Ge is excited into a higher energy state which is presented as ”· · · ”. Without the presence of hydrogen, the excited germanium would go back in its ground state after a short period of time [52]. But in the presence of hydrogen, the excited state can now react with the hydrogen to form a GeE0 (Tsai et al. stated that GeE0 generation is
more efficient with hydrogen [48]) defect, an OH group and atomic hydrogen. This atomic hydrogen can now either break GeO bonds, which are known to be weaker
![Figure 1.3.2: Phasediagram of SiO 2 . At atmospheric pressure, different polymorphs are possible depending on the temperature [32].](https://thumb-eu.123doks.com/thumbv2/123doknet/5005206.124773/32.892.244.569.81.388/phasediagram-atmospheric-pressure-different-polymorphs-possible-depending-temperature.webp)
![Figure 1.4.1: Different types of defects which are related to the photosensitivity in optical glass fibers [29].](https://thumb-eu.123doks.com/thumbv2/123doknet/5005206.124773/36.892.177.630.92.504/figure-different-types-defects-related-photosensitivity-optical-fibers.webp)
![Figure 1.4.3: Correlation between the amount of GeE 0 centers and the change of the RI during UV inscription (Laser fluence of 300 J / cm 2 ) [48].](https://thumb-eu.123doks.com/thumbv2/123doknet/5005206.124773/37.892.242.726.688.1030/figure-correlation-gee-centers-change-inscription-laser-fluence.webp)
![Figure 3.4.3: 3-fold ring in vitreous silica network. The black arrows illustrate the breathing motion of the 3-fold silica ring [88].](https://thumb-eu.123doks.com/thumbv2/123doknet/5005206.124773/57.892.347.640.467.766/figure-vitreous-silica-network-arrows-illustrate-breathing-motion.webp)
![Figure 3.4.4: Stress measurements in a silicon sample. A shift in the Si-Si Raman peak position represents tensile (negative shift) or compressive (posi-tive shift) stress [89].](https://thumb-eu.123doks.com/thumbv2/123doknet/5005206.124773/58.892.206.602.90.567/figure-stress-measurements-position-represents-tensile-negative-compressive.webp)
![Figure 3.6.1: Raman spectra for silica, germania and mixed glasses. The numbers stand for the content of silica in percent and the red stars indicate the Ge-O-Si bonds which are not present in pure silica and germania, respectively [27].](https://thumb-eu.123doks.com/thumbv2/123doknet/5005206.124773/60.892.193.630.85.524/figure-germania-content-percent-indicate-present-germania-respectively.webp)