Université de Montréal
The Determinants oflntergovernmental Transfers in Canada, 1981-2001
par Charles Thibault
Département des Sciences économiques Faculté des études supérieures
Mémoire présenté à la Faculté des études supérieures en vue de l’obtention du grade de Maîtrise
en Sciences économiques
février 2006
n
\J
Direction des bibliothèques
AVIS
L’auteur a autorisé l’Université de Montréal à reproduire et diffuser, en totalité ou en partie, par quelque moyen que ce soit et sur quelque support que ce soit, et exclusivement à des fins non lucratives d’enseignement et de recherche, des copies de ce mémoire ou de cette thèse.
L’auteur et les coauteurs le cas échéant conservent la propriété du droit d’auteur et des droits moraux qui protègent ce document. Ni la thèse ou le mémoire, ni des extraits substantiels de ce document, ne doivent être imprimés ou autrement reproduits sans l’autorisation de l’auteur.
Afin de se conformer à la Loi canadienne sur la protection des renseignements personnels, quelques formulaires secondaires, coordonnées ou signatures intégrées au texte ont pu être enlevés de ce document. Bien que cela ait pu affecter la pagination, il n’y a aucun contenu manquant.
NOTICE
The author cf this thesis oc dissertation has gtanted a nonexclusive license allowing Université de Montréal to reproduce and publish the document, in part or in whcle, and in any format, solely for noncommercial educational and research purposes.
The author and co-authors if applicable retain copyright ownership and moral rights in this document. Neither the whole thesis or dissertation, nor substantial extracts from it, may be printed or otherwise reproduced without the authcr’s permission.
In compliance with the Canadian Privacy Act some supporting forms, contact information or signatures may have been removed from the document. While this may affect the document page count, it does not represent any loss cf content from the document.
Université de Montréal Faculté des études supérieures
Ce mémoire intitulé
antsfgovernm talTrapersiÇanada, -2001
présenté par Charles Thibault
a été évalué par un jury composé des personnes suivantes
Alain Noêl président-rapporteur
François Vaillancourt directeur de recherche
Jorge Martinez-Vasquez (Georgia State University)
Ce mémoire analyse les déterminants des transferts du gouvernement fédéral canadien aux gouvernements provinciaux durant la période 1981-2001. Un estimateur à effets fixes pour chacune des années sous étude a été utilisé pour capter les mouvements dans la contrainte budgétaire fédérale. Les transferts per capita sont une fonction négative linéaire de la capacité fiscale des gouvernements provinciaux, une fonction positive linéaire du taux de chômage provincial, et une fonction négative linéaire du logarithme de la population. Les transferts sont aussi une fonction positive du vote pour le Parti Libéral. Toutefois ces quatre variables indépendantes sont fortement corrélées entre elles. Les données ne supportent pas l’hypothèse, qu’en préparation pour des élections, les parties au pouvoir transfèrent plus d’argent aux régions où la course est serrée. Les données ne supportent pas non plus l’hypothèse que la surreprésentation politique génère plus de transferts, du moins au niveau provincial.
Mots clés : transferts intergouvernementaux; achat de votes; politique Canadienne
Abstract
This thesis examines the determinants of Canadian Federal Government transfers to provincial governments from 1981 until 2001. Year fixed effects were used to capture shifts in the federal government’s budget constraint. Per capita transfers are a negative linear function of per capita provincial govermnent tax receipts, a positive linear
function ofa province’s unemployment rate, and a negative linear function of provincial log population. Federal transfers are also a positive function of the Liberal Party vote share. However, all four controls are strongly correlated amongst themseÏves. There is little evidence that federal transfers are used strategically in the run-up to an election to purchase “swing” provinces. There is also little evidence to support the idea that political per capita over-representation generates higher transfers once the population size is controlled for, at least on the provincial level.
Key words: intergovernmental transfers; intergovernmental grants; vote purchasing; Canadian politics
Remerciements
I would like to thank Prof. François Vaillancourt for guiding me through this exercise. He clearly places students at the top of his list of priorities, and they certainly benefit from his advice. His comments and attention to detail, even at the penultimate step, have greatly increased the quality ofthis work. Merci à vous.
1
Université de Montréal
The Determinants oflntergovernmental Transfers in Canada, 1981-2001
par Charles Thibault
Département des Sciences économiques Faculté des études supérieures
Mémoire présenté à la faculté des études supérieures en vue de l’obtention du grade de Maîtrise
en Sciences économiques
février 2006
Résumé
Ce mémoire analyse les déterminants des transferts du gouvernement fédéral canadien aux gouvernements provinciaux durant la période 1981-2001. Un estimateur à effets fixes pour chacune des années sous étude a été utilisé pour capter les mouvements dans la contrainte budgétaire fédérale. Les transferts per capita sont une fonction linéaire négative de la capacité fiscale des gouvernements provinciaux, une fonction linéaire positive du taux de chômage provincial, et une fonction linéaire négative du logarithme de la population. Les régions qui ont voté pour le gouvernement au pouvoir reçoivent plus de transferts. Toutefois, ces transferts supplémentaires ne proviennent pas des transferts principaux. Les données ne supportent pas l’hypothèse, qu’en préparation pour des élections, les parties au pouvoir transfèrent plus d’argent aux régions où la course est serrée. Les données ne supportent pas non plus l’hypothèse que la surreprésentation politique génère plus de transferts, du moins au niveau provincial.
Mots clés transferts intergouvernementaux; achat de votes; politique canadienne
Abstract
This thesis examines the determinants of Canadian Federal Government transfers to provincial governments from 1981 until 2001. Year fixed effects were used to capture shifts in the federal government’ s budget constraint. Per capita transfers are a negative linear function of per capita provincial government tax receipts, a positive linear
function ofa province’s unemployment rate, and a negative linear function of provincial log population. Politically, regions that support the government in power receive more transfers. These additional transfers are not distributed through the main transfer mechanisms, however. There is little evidence that federal transfers are used
strategically in the run-up to an election to purchase “swing” provinces. There is also little evidence to support the idea that political per capita over-representation generates higher transfers once the population size is controlled for, at least on the provincial level.
Key words: intergovernmental transfers; intergovernmental grants; vote purchasing; Canadian politics
111 TABLE 0F CONTENTS LIST 0F TABLES IV LIST 0F FIGURES V 1. INTRODUCTION 2. LITERATURE REVIEW
Relevance ofthe research question 3
Literature rcview 4
Boex and Martinez-Vazquez (2004) 5
Normative determinants 7
Fiscal and economic determinants 8
Political determinants 12
Population 15
Alternative methodsofestimation 15
3. INSTITUTIONAL MECHANISMS AND MODEL 20
Data sources 20
A note on the sampleandperiod selection 20
Some basics on Canada 22
Types oftransfers in the Canadian federal arrangement 24
Composition oftransfers 25
Stability of per capita grants 28
Calculating the value ofthe Québec Abatement 29
The Equalization transfer 30
The Principle of Equalization 31
The mechanics ofEqualization 32
Sizeandimportance ofEqualization transfers 36
I-Jealthcare funding, social funding,andthe CHST 39
Political modeling 41
Political institutional framework 42
Recent flistory 43
Definition ofpolitical variables 49
Estimator 53
Correcting for serial corretation and heteroscedasticity 55
Choice of variables 55
Justifying the linearity assumptions 56
Alberta: one possible source of bias 59
Discarding the provincial fixed effects estimator 61
Justify’ing the year fixed effects estimator 64
Endogeneity of per capita income and per capitataxrevenues; 2SLS 66
4.RESULTS
Results ofthe core model 67
Total trans fers 67
Equalization 71
Healthcareandsocial welfare transfers 72
“Other” transfers and comparison 75
Results ofthe iterative procedure: political variables 77
Discussion ofresults 83
5. CONCLUSION
BIBLIOGRAPHY 90
APPENDIX 1: ESTIMATED VALUE 0F THE QUÉBEC ABATEMENT 93
APPENDIX 2: MATRIX FORM 0F EQUALIZATION PAYMENTS 94
APPENDIX 3: TWO-STAGE LEAST SQUARES ESTIMATION 96
LIST 0F TABLES
TABLE 1: TABLE 1 TAKEN F ROM BOEX AND MARTINEZ-VAZQUEZ(2004) 6 TABLE2: BASIC STATISTICS ON CANADIAN PROVINCES,2001, SORTED fROM EAST TO WEST 23 TABLE3: GENERAL TRANSFER COMPONENTS IN2001, BILLIONS 0F DOLLARS 25 TABLE4: BASIC CHARACTERISTICS 0f FEDERAL GOVERNMENT TRANSFERS, 1981-2001,SORTED FROM
EAST TO WEST 27
TABLE5: “EQUALIzATION” PAYMENTS, 198 1-2001 3$
TABLE6:NUMBER 0F SEATS* AND PERCENTAGE POPULAR VOTES FOR EACH 0F THE MAJOR PARTIES [N
CANADA, 1981-2001 46
TABLE7: “CUMULATIVE” NUMBER 0F SEATS AND “CUMULATIVE” VOTE SHARES PER PROVINCES FOR ALL
ELECTIONS HELD1981-2001 4$
TABLE8: $UMMARY STATISTICS 0F POLITICAL MEASURES 53
TABLE9: RESULTS 0F THE “CORE” MODEL ESTIMATION, TOTAL TRANSFERS 68 TABLE 10:RESULTS 0f THE “CORE” MODEL ESTIMATION, “EQUALIZATION” TRANSFERS 71 TABLE 11: RESULTS 0F THE “CORE” MODEL ESTIMATION, HEALTHCARE AND SOCIAL TRANSFERS 74 TABLE 12: RESULTS 0F THE “CORE” MODEL ESTIMATION, “OTHER” TRANSFERS AND COMPARATIVE
ANALYSIS 76
TABLE 13: RESULTS 0F THE ITERATIVE SUBSTITUTION 0F POLITICAL VARIABLES, “SWING” MODEL 79 TABLE 14: RESULTS 0F THE ITERATIVE SUBSTITUTION 0F POLITICAL VARIABLES, “CONSTITUENTS” MODEL: $1 TABLE 15: RESULTS 0F THE ITERATIVE SUBSTITUTION 0F POLITICAL VARIABLES, PARTISAN ANALYSIS $2 TABLE 16: RESULTS 0F THE ITERATIVE SUBSTITUTiON 0F POLITICAL VARIABLES, OVER-REPRESENTATION:
$3
TABLE 17:COMPARATIVE RESULTS FOR CANADA $7
TABLEA 1:VALUE 0F THE 13.5% QUÉBEC PERSONAL INCOME TAX ABATEMENT FOR HEALTHCARE ON A
PER CAPITA BASIS, 1981-2001 93
TABLEA 2:CALCULATI0N 0F EQUALIZATION FOR 19 82-1 983,TAKEN FROM PERRY(1 997) 94 TABLEA 3: 2SLSREGRESSION RESULTS 0F THE “CORE” ECONOMIC MODEL 99
TABLEA4- 1: RESULTS 0F POLITICAL ESTIMATION, “SWING” MODEL, 1/4 102 TABLEA4- 2: RESULIS 0F POLITICAL ESTIMATION, “SWING” MODEL,2/4 103 TABLEA4- 3: RESULTS 0F POLITICAL ESTIMATION, “SWING” MODEL,3/4 104 TABLEA4-4: RESULTS 0F POLITICAL ESTIMATION, “SWING” MODEL,4/4 105 TABLEA4- 5: RESULTSOFPOLITICALESTIMATION, “CONSTITUENTS” MODEL, 1/2 106 TABLEA4- 6: RESULTS 0F POLITICAL ESTIMATION, “CONSTITUENTS” MODEL,2/2 107 TABLEA4-7: RESULTS 0f POLITICAL ESTIMATION, PARTISAN ANALYSIS, 1/1 10$ TABLEA4- 8: RESULTS 0F POLITICAL ESTIMATION, POLITICAL OVER-REPRESENTATION, 1/1 109
V
LIST 0F FIGURES
FIGURE1: REAL(1992 DOLLARS) FEDERAL PER CAPITA GRANTS, CANADIAN WEIGHTED AVERAGE 2$ FIGUREII:GRAPHICAL REPRESENTATION 0f PER CAPITA EQUALIZATION PAYMENTS 33 FIGUREIII:EQUALIzATI0N PAYMENTS AND FISCAL CAPACITY, 1999 34 FIGUREIV: REAL PER CAPITA TRANSFERS PLOTTED AGAINST REAL PER CAPITA PROVINCIAL OWN
REVENUES 58
FIGUREV: REAL PER CAPITA TRANSFERS PLOTTED AGAINST LN(POPULATION) 58 FIGUREVI: REAL PER CAPITA TRANSFERS PLOTTED AGAINST THE UNEMPLOYMENT RATE 59
FIGUREVII: OLSBIAS 0F A PIECE-WISE LINEAR FUNCTION 60
FIGUREVIII: PER CAPITA TRANSFERS OVER TIME TO EACH 0F THE TEN PROVINCES 63 FIGUREIX: REAL PER CAPITA DE-TRENDEDGDP OVER TIME FOR EACH 0F THE TEN PROVII’ICES 63 FIGUREX: REAL PER CAPITA TRANSFERS AND FITTED VALUES PLOTTED AGAINST REAL PER CAPITA
PROVINCIAL OWN REVENUES 65
FIGUREXI: REAL PER CAPITA TRANSFERS PLOTTEDAGAINSTTHENUMBEROFMPS PER100,000
1. INTRODUCTION
This thesis examines the deterrninants of Canadian federal government cash transfers to provincial governments during the period 198 1-2001.
The primary objective is to estimate political influence in the transfer system, controlling for normative considerations and using an estimator that correctly accounts for institutional mechanisms in place. It has been pointed out, by Wallis (1996) for
example, that if federal politics drive the allocation of resources the case for the centralization ofthe fiscal system is weakened.
This thesis also has a comparative objective: it was primarily motivated by a comparative paper written by Boex and Martinez-Vazquez (2004). They present an international comparison of the determinants of intergovernmental grants. Their paper does not include the case of Canada, so this thesis will serve to add to the international comparative literature. This paper will also serve to support the simple empirical model they propose, although some important issues about estimation are brought up.
The choice of the estimation procedure is quite important. It must attempt to capture the institutional rnechanisms in place. The transfer system’s major components must be estimated without bias, their functional forms correctly expressed. Only this
way can political influence be detected.
Using a linear model, real per capita transfers are a negative function of provincial government per capita fiscal capacity, a positive function of the provincial unemployment rate, and a negative function of the log population. Ihis model, lias an R-Square of 0.80.
I test four separate political models.
Two of these models are pitted directly against one another in an attempt to describe strategic vote purchasing behaviour. The first is the “swing” model whereby in
the run-up to an eÏection the party in power will transfer monies to regions where there
are many swing voters. The second model of political behaviour, the “constituent”
model, suggests that parties in power will transfer monies to regions that support them. I also test whether provincial level political over-representation generates more transfers per capita, ah else being equal.
2
finally, I use party vote shares to see if voting for any one of Canada’s major parties generates additional per capita transfers.
The main political resuit is that the regions that voted for the party in power received extra transfers.
This thesis is divided into tbree main chapters. Chapter 2 is a literature review. It starts by explaining the pertinence of this exercise. Chapter 3 presents some basics on Canada. I also discuss the transfer system and describe the two main transfers, the Equalization transfer and healthcare transfers. This will lead to the development of an estimation strategy that correctly accounts for the institutions in place. Chapter 4 presents the econometric resuits.
2. LITERATURE REVIEW
Relevance of the research question
The research topic is relevant considering the importance of federal transfers in the
Canadian national fiscal system.
f irst, consider the absolute magnitude of transfers. In 2000, direct (cash) grants
from the central government to the provinces were $30 billion’. This represents 15% of
the federal government’s budget. This is a non-negligible fraction of federal public
expenditures.
Second, consider the importance of transfers in provincial government budgets. Transfers represent 30% or more of total provincial governrnent revenues for half of the provinces during the period under study, as will be shown in the next chapter.
Third, consider the overali importance of provincial governments in the national provision of public goods and services. Canadian provinces are responsible for delivering key programs, most notably education and healthcare. In fiscal year 2000,
the federal government had expenditures of $200 billion. Combined, the ten provinces and three territories spent together $230 billion. Provincial expenditures in healthcare,
education, and social security (in order of importance), totaled more than $150 billion. Even taking into consideration local (municipal) government spending, provincial governments account for almost 45% of total public expenditures in Canada.
f inally, another characteristic of the transfer architecture in Canada is that
transfers ftow from the higher levels of government to the lower levels of government. Here, one simple example will suffice. In 2001, the federal level transferred over
$7,300 million to the Ontario provincial government. The Ontario provincial government, for its part, transferred $12,915 million to more local instances of government. Yet the Ontario provincial government transferred only $52 million to the federal government, and local govemments transferred a total of $1 million to the government of Ontario.
4
Overali, the point is that tax field occupation by certain levels of government and the division of expenditure responsibilities between these same levels of government are
j
ointly determined. Economic efficiency, cost-rninimization, administrative feasibility, and appropriate revenue/expenditure matching may push the collectionlspending equilibrium in different directions. In the Canadian case, it seems as though the optimal fiscal arrangement is one where more central levels of government occupy and administer the main (lucrative) tax fields only to redistribute, through transfers, a portion of this money to more local instances of government. So the transfer from the federal to the provincial governments is an important part of the overall national fiscal system and certainly an important policy tool.b conclude the discussion on the relevance of the research topic, I use the words of Wallis (1996) who puts it quite well:
Intergovernmental grants have become a major part of the fiscal structure. They exist for social and economic reasons that reflect the interests of the electorate, for public finance reasons that reflect the benefits from centralized collection of revenues and decentralized administration of expenditures, as well as political reasons. Grants represent tangible benefits that can be delivered by politicians. For all these reasons grants will continue to be used for a long time, and their determinants will reflect the complex interaction of economic, fiscal, and political forces.
Literature review
The review of the literature is organized as follows. I first present the resuits from Boex and Martinez-Vazquez (2004), as their paper is the central piece of literature to which this thesis responds. I will then discuss the main normative determinants, some of the principle fiscal and economic determinants, as well as present the relevant political determinants present in the literature. I will finally look at two specific papers that offer alternative procedures in estimating political influence.
Boex and Martinez- Vazquez (2004)
Boex and Martinez-Vazquez (2004) state,
[...]
The general empirical approach followed by the incidence studies in theliterature is basically identical. The empirical studies that analyze the distribution of intergovermnental grants across subnational jurisdictions generally consider that the per capita amount of grants received by some local government i (PC GRANT) is determined by four factors, including local expenditure needs (NEEDS), some measure of revenue capacity or revenue effort (REVENUE), a variety of political factors (POLITICS), and/or the relative population size of the jurisdiction (POP). This relationship my be represented in linear form as:
PC GRANT = + f31NEEDS + r32REVENUE + f33POLITIC$1 + 134POP +
They identify 12 papers that analyze intergovernmental grants, or rather they look at 12 different countries. The Boex and Martinez-Vazquez (2004) review shows that the kind ofmodel they examine can generate an adjusted R-Square of 0.9.
Some of the studies use state/province dummies in cross-sectional analysis, so it should not be so surprising that these R-Squares should be so high. The comparative results they present are shown in Table 1 here:
6
Table 1: Table 1 taken from Boex and Martinez-Vazquez (2004)
Expenditure Fiscal capacity Political Population R2
needs power size
Argentina Pop.density: - Income: - Political rep.: + Population: - 0.8$
Political support: +
Australia Exp needs ratios: us Political rep: + ns 0.90
+
Brazi] ns Income: + Political rep.: + ns 0.90
Indonesia Poverty: + GRP: + ns ns 0.23
Reg. prices: +
Israe] Dependent Local deficit: + Political Population: - 0.64
population: + support: +
Japan Urban: ns Income: + Political rep.: + ns 0.97
Mexico HDI: + HDI: + Political rep.: + ns 0.79
Political support: +
Nigeria Poverty: NS Fiscal capacity: ns Population: - 0.63
Pop Density: NS +
School-aged: NS
Russïan Social service Profits: - Spec.Status: + Population: - 0.62
Federation delivery index: + Political
support:
-Tanzania Poverty: + HI-1 expend: + Urban: + Population: - 0.52 School-aged: +
Uganda Pop density: + Poverty: - ns Population:- 0.62
Poverty:
-United Urbanization: - Income: + Political ns 0.73
States support: +
Sources: Argentina (Porto and Sanguinetti 2001); Australia (Worthington and Dollery
199$); Brazil and Mexico (Kraemer 1997); Indonesia (Brodjonegoro and Martinez
Vazquez 2004); Israel (Alperovish 1984); Japan (Meyer and Naka 1999); Nigeria (Alm
and Boex 2001); Russian Federation (Treisman 1996); Tanzania (Boex 2003); Uganda
(LGf C 2003); and the United States (Wallis 1996)
Source: Boex and Martinez-Vazquez (2004)
Note: ns: not significant
Note: HDI: Human Development Index Note: GRP: Gross Regional Product
Normative determinants
Boex and Martinez-Vazquez (2004, 467) state “[...] The empirical literature broadly
supports the normative notion that local govemments with higher expenditure needs should receive larger transfers.
What exactly are these normative notions? The most important one is presented here.
Horizontal Eguity:
One of the main roles of government is to transfer wealth (or revenue) from the
rich to the poor. This can be accomplished through direct transfers to individuals (i.e. welfare, old age pensions, family allowances). Another policy instrument is the transfer from the central level of government to “poor” provincial governments.
The classic reference is Buchanan (1950) who argues for the equalization of fiscal “residua” across provinces for individuals of equal revenue. A fiscal residuum is the difference between what a citizen receives in benefits and what he/she pays in taxes.
The residuum is also referred to as the “net fiscal benefit”.
What’s important is that an individual who earns, say $35,000, receive the same
net fiscal benefit (residuum) regardless of the province he lives in. A rich person should
not be penalized by lower than average public services because his neighbours are poor. The unemployed should not have the opportunity to ‘free rid& by moving to areas of greater prosperity that offer more public services. So transfers from the federai
government, by allowing poorer provinces to supply more public goods than they could
on their own, may help “equalize” the residua of individuals of equal position (i.e. of
the same revenue) in different provinces.
Yet Boex and Martinez-Vazquez (2004, 469) point out: “Perhaps one of the more surprising facts uncovered by the current comparison of international practices is the finding that the impact of local revenue capacity on intergovernmental grants is generally positive. In almost ail countries reviewed, wealthier local governments
8
receive greater intergovernmental transfers while poorer local governments receive smaller transfers”. So the coefficient on the REVENUE variable is sometimes positive, although we would expect a negative relationship.
They attribute this counter-intuitive resuit to this notion of “net fiscal incidence”. Imagine that a rich province generates an average of $4 per person in taxes for the central government, while another poorer one generates only $1. Central government revenues are thusly $5. Let’s say the central government transfers $3 to the rich province and $2 to the poor province. Redistribution has occurred even though the richer province received more money. Income redistribution cannot be measured by how much more a poor province receives in relation to another in absolute terms, but rather it must be measured by how much more it receives in relation to how much it contributes to the central treasury. Thus, say Boex and Martinez-Vazquez (2004, 470), “even in countries where we find a positive relationship between subnational revenue capacity and intergovernmental grants, on balance the system of intergovernmental fiscal relations might in fact stiil be redistributive when considering both the incidence of revenue collections together with the incidence of transfer flows”.
It is possible, though, that this problematic resuit may be due to incorrect econometric specification, which we shall discuss at some length later on. For now it will suffice to say, as Wallis (1996, 19) does, that “The effects of income and urbanization on grants appear to be perverse in a simple pooled-cross sectional regression, but inclusion of fixed effects and accounting for simultaneous grants and local expenditures solves the problem.”
fiscal and economic determinants
It is not quite evident at first to see why a (federal) government should transfer money or tax points to sub-national govermrients if expenditure obligations and tax revenues are well aligned to begin with. Indeed, if municipalities, provinces, and federal governrnents tax exactly what they need in order to fulfiil their obligations towards their
citizens, one may question the role or necessity of transfers. Unfortunately, this ideal situation is rarely, if ever, achieved —and politics do get in the way.
This section provides both theoretical arguments as to why transfers should exist and factual examples of why transfers do exist. This section is not a review of the extensive literature on fiscal relations in a federal setting. It is intended to provide the non-specialist with some basic theory and real-world examples. There are many more determinants than are listed here. Those that are highuighted were kept because they are most relevant for the Canadian case and the exercise at hand.
Efficiency:
Economists are often concerned with market efficiency. Traditional market failures such as monopolies or externalities may best be addressed through national legislation. Yet transfers may correct certain other types of rnarket failure, for example failure in the labour market (described further on).
Administrative costs:
In some cases, particularly for small provinces, total administrative costs may be lowered if the federal government collects a province’s taxes (sometimes for a fee) and then hands over the rnoney. Such is the arrangement between 9 of Canada’s 10 provinces for which the federal government collects personal income tax, and 7 of Canada’ s 10 provinces for which the federal government collects corporate income tax. One province, Québec, collects its own personal income and business taxes, so that residents and businesses must file two incorne tax returns. The Canadian federal government also collects provincial sales taxes in three of the four3 Atiantic provinces, while in Québec the provincial government collects the federal sales tax and surrenders the monies to the central level. In these arrangements administrative duplication is eliminated, reducing the cost of tax collection and increasing absolute yields. Some benefits may also arise from the national harmonization of the tax system.
Such arrangements do flot count as transfers here. Rather they are simply administrative agreements.
10
Ment goods:
A ment good is one that an “outside analyst” views as important but is flot considered important by the local population. Vaillancourt (1999) proposes that “a given service may be seen as a ment good by a majority of the national population but not by a majority in each subnational jurisdiction”. Either way, sub-national governments wiJl under-provide these public services as cornpared to the quantity that is considered “optimal” from a national perspective.
Vaillancourt (199) suggests this is behind minority language education in Canada, as financed through the Officiai Languages Act. This piece of legislation provides funding for French language primary and secondary education in Canada’s nine English speaking provinces, and provides funding for English language education in french-speaking Québec. Ontario, for example, lias a francophone minority that is 500,000 strong, and New Brunswick has a francophone minority community of almost 250,000 individuals, a full third of its population (Paillé 2000).
Externalities:
Sub-national governments may sometimes engage in activities that generate externalities for the nation or immediate neighbours. Central governments may transfer money to sub-national governments that produce negative externalities in order to get them to stop or reduce these harmful activities. In the case of positive externalities, for example in post-secondary education, transfers would encourage the province to increase the levei of beneficial activities.
Labour mobility:
The mobility of labour, particularly that of coilege graduates, may justify central government intervention in higher education. Indeed, obtaining a college degree greatly increases an individual’s mobility, especially in the first few years afier graduation (Burbridge and Finnie 2001). This becomes problematic for pubiicly funded higher education, especially if education is the responsibility of sub-national governments: the human capital financed by the state/province leaves. In this case, it may be appropriate
for the central government to intervene in funding higher education, as the benefits of this higher education spreads around the country - yet are being paid for by local
taxpayers. $tates/provinces that have net migratory outflows4 will thusly under-provide higher education as compared to what is considered optimal on a national level. Thus transfers from the central to the sub-national government may correct for this problem.
This reasoning leads us to an interesting theory for Québec. If french speakers are less nationally (or internationally) mobile than their English counterparts in the rest of Canada, then the natural consequence is that universities in Québec should receive fewer transfers from the federal government in this domain5.
Broadway and Flatters (1982) also suggest that “free migration [may] eventually lead to an inefficient allocation of labour over the federation” if there are variations in net fiscal benefits across provinces. In this case equalization can correct this inefficiency (in addition to responding to equity arguments). The fact that migrants respond to net fiscal benefits implies that migrants in this environment do not behave in such a way to equalize the marginal product of labour across the country; they base their mobility on the incorrect signal. The equalization of the marginal product of labour across provinces describes its optimal allocation. It is undesirable that workers migrate in response to differentials in net fiscal benefits, since this movement will reduce the marginal product of labour in zones of immigration and increase it in zone of emigration, taking us away from the optimal allocation (if this optimal allocation were already achieved). Thus Equalization will allow labourers to respond to the correct market signal, namely the marginal product of labour.
It is not clear how a state/province with net migratory inflows would behave. One could posit that this sub-national government would also underprovide higher
education. On the other hand it need not invest in its local population if enough human capital is being “imported”.
Bird and Vaillancourt (2004) suggest this idea as it pertains to overall labour rnobility. Francophones face greater obstacles when moving, namely they do not speak the local language (English) if they were to migrate outside Québec. Thus there are fewer chances that migratory externalities will arise from this group.
12
Foïltical determinants
In this section I present the main classes of political determinants. I first start with one counter-example to show how rich the literature is.
Silencing dissenting regions:
Treisman (1996) examines the factors that influence grants and transfers in post Soviet Russia. Much like this study, he examines social needs, fiscal capacity, and political representation but finds that the most significant determinants are of a political nature. He says: “If a region’s leaders declared sovereignty as early as 1990, this seems to have earned it on average about 18,600 roubles6 per inhabitant in additional transfers and tax breaks in 1992.”
He also remarks that if a region voted heavily against Bons Yeltsin in the 1991 election, it received more per capita grants in 1992. Moreover, if a region’s workers imposed a costly strike, it also received higher per capita grants. “Together, these results suggest that in the early Post-Soviet period, challenging Moscow — whether by
elite declaration, mass action or public voting—paid off far better than complaisance”.
Policy coercion:
Policy coercion is most notably achieved in developed countries through the use of conditional or matching grants. Matching grants are widely used in the United States for example, as noted by Wallis (1996).
In a conditional grant, the central government offers a transfer as long as the money is spent on programmes meeting specific criterion (ex. hospital infrastructure development). This is a way for federal governments to achieve ambitious national objectives without having to increase their own payroll significantly and it allows some (optimal) local variation in distribution methods. By accepting this transfer, sub
6
In June 1992, the exchange rate was 125 roubles/USD$1. So this amount would have been the equivalent ofUSD$130, or about CAD$ 110. Note that immediately after exchange rate liberalization in 1992 Russia experienced massive hyperinflation. Russia also had a currency crisis in 1998.
national governments understand that this money must be earmarked for certain specific expenditures.
Matching grants add a slight nuance: in these grants central governments match provincial expenditures on a dollar-for-dollar basis for certain specific programmes. Total federal outlays usually have a limit for each province. Matching grants thusly provide an incentive for sub-national governments to align their expenditures with the federal government’s policy objectives. In Canada, matching grants have been called “shared-cost programmes” (Perry 1997, 173).
An important point to note is that matching grants or shared cost programs generally favour richer provincial or state governments. Indeed, the more a sub national government spends, the more grants it cari receive, and the governments that can afford to spend more are generally richer. In Canada, this has been one ofthe major criticisms of (the now defunct) shared-cost programmes, since poor provinces “could neither afford to accept nor to reject such grants” (Perry 1997, 204).
Political over-representation:
This is one of the most well-known and well-documented political determinants of intergovernmental transfers. From Table 1 it is clear that this factor is influential in at least 5 countries. Boex and Martinez-Vazquez (2004) say: “In virtually all countries reviewed with district-based political systems, disproportionate political representation (greater representation per capita) consistently results in greater per capita intergovernmental transfers.”
Political over-representation occurs in two ways. The first when provinces (or states) of a country each send the same number of representatives to a legislative chamber. This typically occurs in the upper chamber of a bi-camerai legislative system. In the United $tates, for example, each state sends two Senators to the Senate. This naturally leads to greater per capita political representation for less populous states.
The second way in which political over-representation is induced is when small provinces are allocated a minimum number of representatives. This is the case in Canada with Prince Edward Island, which is guaranteed at least 4 MPs (Evans 2005).
14
Porto and Sanguinetti (2001) suggest that the first effect is generally stronger than the second. It can be added that the first effect becomes more important as the policy input of the upper chamber increases.
Atlas et al. (1985) documents this effect in the United $tates. Porto and Sanguinetti (2001) document this effect in Argentina.
Most recently, Evans (2005) measured this effect for Canada. He does flot, however, look at transfers, which is the exercise here. He examines federal expenditures and levels of taxation. There is indeed some variation in average representation per capita across Canadian provinces, but there is an even greater variability in representation per capita within each province. He finds a positive effect of over-representation, even controlling for income per capita. He estimates, using provincial-level data (there are three estimations on three different data sets) that one fewer person per electoral riding generates an extra $0.03 per person in spending. At the mean electoral district size this is an increase of $2,880 in total. He also finds that districts with fewer people are taxed less, even controlling for per capita income.
Purchasing “swing” regions in preparation for an election:
This theory was formally developed by Lindbeck and Weibull (1993) and Dixit and Londregan (1996). Henceforth I will refer to this model as the “swing” model. This theory states that in the Iead-up to an election the party in power wiIl transfer monies to regions where the race is tight, in other words “swing” regions (or where there are many swing voters). This strategy maximizes the marginal political payoff of transfers. Indeed, it makes no sense to throw money at states/provinces one knows one will lose, but it can certainly help turn the tide if poiis show the party in power is onÏy slightly behind.
Dahlberg and Johansson (2002) state that the Lindbeck-Weibull/Dixit Londregan model “further predicts grants to be targeted at regions with low income, since voters with low income have higher marginal utility of income and thus can be more easily persuaded to vote for a party promising them high transfers than high income earners”.
Rewarding constituents:
This theory was formaily developed by Cox and McCubbins (1986). I will refer to it henceforth as the “constituent” model. This mode! proposes that central governments allocate transfers to regions where they already have high support. Indeed, a risk-averse government wili transfer money to its supporters, somewhat less to intermediate regions (“swing” regions), and flot at ail to regions where there is high opposition.
Boex and Martinez-Vazquez (2004, 470) state: “furthermore, greater political support in a region of the national government is aimost aiways rewarded by greater grants as well”.
Population
Boex and Martinez-Vazquez (2004, 470) state: “A final factor that influenced the allocation of intergovernmenta! resources with impressive consistency is the size of the subnational jurisdiction’s population. In every empirical country study in which population was inc!uded as an independent variable, local governments with larger population received significant!y fewer per capita grants”.
In the case of population density, it is argued that iower population densities increase the per capita cost of delivering public services, such that a geographically uniform distribution of public services requires larger per capita transfers to less populated areas.
Alternative methods of estimation
The Boex and Martinez-Vazquez (2004) paper suggests a linear estimator. This is flot the only possible estimation strategy available. This section presents in a hile more detail two papers that offer alternative estimation procedures and the rationale behind their estimators.
16
Wallïs (1996):
This paper analyses the allocation of grants in die United States. The main contribution of this paper to the literature is econometric. What’ s more, this paper uses panel formatted data — many of the papers reviewed by Boex and Martinez-Vazquez
(2004) use cross-sectional data only.
It will be useful to paraphrase the paper here:
One model of the grant process pictures federal government officials structuring grant allocations to maximize the value of those grants to themseÏves and/or their constituents. Congress decides the formula under which some grants will be allocated and the executive branch has discretionary control in the awarding of other grants. This translates into estimating an equation ofthe form:
(1) FG1=a+f3E+yP+E
where fG1 is per capita federal grants to state i, E and P are vectors of economic and political variables; and the error term, E, is a normal white
noise error.
Equation (1) is not. however, an accurate representation of how the grant allocation process actually works. Grants are typicalÏy allocated through a series of formulas that include factors like population, income, or highway mifeage, as well as measures of state (or local) financial participation.
[...]
At one extreme, with strict matching, federal grants are simply a linear function of state expenditures.[...]
Many grants fall short of strict, open ended matching formulas, but many involve some attempt to reward states that make a larger effort to cooperate with the federal goals by rewarding those states with larger per capita grants. States also differ in ways not captured by economic or political variables, or captured only imperfectly. These persistent differences between states produce significant differences in state fiscal activity, as well as persistent differences in gains. These “fixed effects” can be controlled for if we have a panel data set that varies over time.A more appropriate7 set of estimating equations are:
(2) FG1, = +f31SX1 + [2E1, + fl3P1, + E. + E, + E
(3) SX1, = + 2fG, + ÀZ1, + +E1 + E, + E
‘
where ï subscripts refer to states and t refers to time, $X is state expenditures, Z is a vector of variables explaining state expenditures, and
Eg’S are the errors for the state expenditure equation.
If equation (1) is estimated when equations (2) and (3) are true then equation (1) estimates will suffer from several defects. One will be omitted variable bias. This may be a problem for ail variables, but it turns out to be particularly important for some of the political variables. The political variables tend to be stable over significant periods of time and are correlated with s, and s,. The coefficients on the political variables, therefore, are sensitive to the specification of the error term. Second, even if state and local expenditures are included as economic variables in equation (1), the estimates will suffer from simultaneity bias. This turns out to be important for a number of coefficients, the most important being per capita income.
[...]
If states with higher incomes tend to spend more on social welfare, then estimates of equation (1) will tend to show that states with higher incomes receive higher grants, in direct contradiction to the stated goals.”Thus anytime a fiscal system contains large conditional or matching grants a two-stage least squares estimation (2SLS) approach is warranted. Simultaneity bias is a well-known econometric problem, and the 2SLS estimation procedure is its standard solution.
Islam and Choudhury (1990) test the exogeneity of grants to Ontario municipalities and find that OLS and 2SLS estimates differ significantly, indicating the presence of an endogenous variable (spending). Thusly the issue of simultaneity bias must be taken into account.
Dahlberg and Johansson (2002):
Dahlberg and Johansson (2002) examine the distribution of an ecological sustainable development grant to municipalities in Sweden. I discuss this paper because it pitted political behavioural models against one another.
In this paper the authors look at the distribution of a “specially designed support program intended to support, by means of intergovernmental grants, local investment programs aimed at an ecological sustainable development and to increase municipal employment”. Municipalities had to apply to the grant program. Only municipalities
1$
were eligible. Projects had to be submitted with fuily detailed proposais, contribute to ecologically sustainable development, and increase employment in the rnunicipality.
This transfer was apt for vote-purchasing anaiyses for three reasons. First these transfers were allocated a few months before the Swedish elections. Second, there was no expiicit formula determining how the grants shouid be allocated. The government in power decided which of the applying municipalities received a grant and in what amount. Third, it was easier to “disentangle any possible strategic use of grants from the equity and efficiency purposes typically attached to intergovernmental grants”. In other words they did not have to control for traditional normative considerations as they focused on a single transfer.
In this paper they tested whether the Lindbeck-Weibull/Dixit-Londregan “swing” model best fitted the central government’s behaviour or whether the Cox McCubbins “constituents” model was more appropriate.
Dahlberg and Johansson (2002) employed a probit estimator as their econometric strategy. They estimated the probability that a municipality received a grant given certain independent variables. They first ran the model with variables that captured the effects of the CM model. They then run the sarne model, except that political variables were replaced by metrics that captured the LW/DL model.
The data did not support the Cox-McCubbins model: some variables were significant but of incorrect sign. Yet there was evidence to support the Lindbeck Weibull/Dixit-Londregan model of government behaviour.
Other8 than the tightness of the race, the authors find that lower unemployment rates, higher environmental ratings, and a larger number of green party voters ail increase significantly the probability of receiving a grant. It is interesting then that a
Dahlberg and Johansson (2002) add several important nuances to the debate taken from the literature, although this discussion is relegated to a footnote. Some papers suggest that the absolute amount of resources transfened is not what matters most to the electorate but rather the number ofprojects (i.e. the number of different transfers) is what counts. The literature also allows for electorate “awareness” of monies
transferred, and the literature suggests a positive relationship between the number of projects and electorate awareness. Thus with “awareness” a role for the media is implicitly allowed.
program designed to create employment and help the environment is exploited by those cities that have no employment problems and are already clean. This may be due to endogenous selection: richer cities have the resources to draft interesting proposais, or cities already deeply concerned with the environment are the most iikely to apply for such a “sustainable development” program.
Overali, their approach differs from the one here in its scope. Dahlberg and Johansson (2002) look at vote purchasing behaviour of one particular grant mechanism. They daim their approach is appropriate since the equity or efficiency arguments usually involved are absent. The task of this thesis is to correctly control for the usual efficiency/equity mechanisms in political estimates.
20
3. INSTITUTIONAL MECHANISMS AND MODEL
In this chapter I present some basics on Canada and on its transfer system. Presentation of the main transfers will inform us on how to control for the institutional mechanisms.
I will also discuss the political institutions. This will allow correct modeling of political variables in the Canadian context.
I will then present the four variable linear model. Three variables are fiscal or economic in nature. The fourth is political.
Data sources
The main fiscal and economic data are from Statistics Canada. They are (with the specific series number):
- f ederal to provincial government transfers: CANSIM 384-0011
- Provincial government revenues and expenditures: CANSIM 384-0004
- Provincial GDP, nominal prices: CANSIM table 384-0001 - Population: CANSIM 051-0005
- Other provincial data, namely unemployemt: CANSIM 384-0013
In all, there are 210 observations in the data set, each of the ten provinces for 21 years.
Electoral district (riding) level data for every federal election since 1979 were provided by the Libraiy of Parliament.
A note on the sample and period selection
The sample ends in 2001 because at the tirne of writing this was the most recent available and reliable data. Equalization transfers, for example, are only final at best two years after first disbursement.
The choice of the start date was made considering changes to national accounting practices. The way in which provincial GDP was calculated changed in 1981g. It was flot thought of as convenient to have to transform or convert older versions of GDP figures into new or vice-versa. So the data was selected to ensure consistency.
The sample also includes only the ten Canadian provinces. Canada also lias 3 territories (Yukon, Northwest Territories, Nunavut). Nunavut was born on April 1, 1999, so the territory is new. Tax and transfer arrangements with these territories are different. Indeed, the tenitories have their own financing deals, which means we would have to properly control for these institutions when examining the political aspects. In terms of per capita transfer payments, these three territories received an average of $17,050 in 2001. This sum of money is substantially greater than the $500-$2,800 figure for the provinces’0. Yet because ofthe small population this amounts to less than 4% of total federal transfer monies during our sample period. Moreover, the total population for these three territories isjust shy of 100,000 inhabitants”. The economic activity there, considering its remoteness, does flot significantly add to the dynamics of the Canadian economy (although the discovery and exploitation of diamonds and ou might change this). Yukon is close to Alaska, but Canada’s economic activity is mainly chaimeled through a west-east corridor parallel to the southern US border. Lastly, these three territories send only one Member of Parliarnent each (Evans 2005), so an analysis of strategic political behaviour will be of little value.
Finally, the time period under study is suitable for analysis because it has been a time of relative stability in the transfer system (in terms of per capita amounts). It is quite appropriate here to take one moment’s pause to present the historical forces that have brought us to where we are today. The period 1981-2001 does not exist in a vacuum.
In 2002 Statistics Canada decided to review provincial economic accounts by adopting the chain Fischer formula. These changes were to extend retro-actively to 1981. $ee Statistics Canada website, “Latest development in the Canadian economic accounts”, released November 7, 2002.
‘
22
Perry (1997, 99) describes the three broad periods of the postwar ear. Between 1947 and 1957, Ottawa and the provinces entered into “tax rentai” agreements, whereby the federal government iiteraiiy “rented” tax bases for fixed amounts. 1957 saw the start of tax sharing, whereby the federai government and provinces shared personai and corporate income taxes, with provinces being aliocated an ever-increasing portion of the pie. In the third and final phase’2, “After the conclusion of the negotiations for the 1977-1982 period, the federai government wouid no longer offer additional tax room to the provinces. In fact, Ottawa was not in a position to offer the provinces additionai resources in any form. The federai government turned instead to fine-tuning the cash transfers to ensure that it was abie to meet its minimum objectives in the most economicai fashion”. This fine-tuning is the state of affairs today.
Some basics on Canada
The following tables presents some basic economic and demographic statistics on Canadian provinces, sorted from Canada’s eastern most to western most provinces.
Table 2: Basic statistics on Canadian provinces, 2001, sorted from east to west Real* per capita provincial Real* GDP government own (millions Real* per revenues (excludes Real* per capita of $CAD) Population capita GDP transfers) cash transfers Newfoundland and Labrador (NL) 12,400 525,380 23,557 3,702 2,809 Prince Edward Island (PE) 3,030 136,393 22,206 3,803 2,813 Nova Scotia (NS) 22,700 933,527 24,347 3,505 2,137 New Brunswick (NE) 18,100 749,715 24,156 4,088 2,323 Québec** (QC) 203,000 7,374,065 27,499 5,130 1,386 Ontario (ON) 395,000 11,800,000 33,537 4,537 582 Manitoba (MB) 30,800 1,148,525 26,792 4,894 1,845 Saskatchewan (SK) 29,300 1,003,688 29,169 4,777 1,437 Alberta (AB) 132,000 3,028,773 43,516 6,513 620 British Colombia (EC) 115,000 4,055,195 28,390 4,952 695 Canada 961,330 30,755,261 31,268 4,967 1006 Source: Author’s calculations from Statistics Canada data. See Data sources section for data sources. * 1992 dollars ** Includes the 13.5% abatement of the basic federal incorne tax. See Calcutating the value ofthe Qué bec abaternent for explanations.
24
The reader should note severai elements from this table. ‘[lie richest province by far is Alberta, with GDP per head of $43,000. Alberta is fortunate enough to hold vast ou and naturai gas reserves (the second largest inthe world after Saudi Arabia’3). It recently managed to pay off ail of its provincial debt’4. Ontario is Canada’s second richest province, with GDP per head of $35,000. Ontario, however, is far more populous and thus has total GDP almost four times that of Alberta’s. Ontario’s economy is twice as large in absolute terms as Canada’s second largest province, Québec, and contributes 40% of Canada’s total output. Québec, British Colombia, and Saskatchewan follow with GDP per head of around $28,000. Canada’s four eastern most provinces are also its poorest. GDP per head in these provinces is in the $23,000 range.
A quick glance at the data indicates that Canada’ s transfer system is equalizing, i.e. the poorest regions receive the most per capita transfers.
Types of transfers in the Canadian federal arrangement
In Canada, there are two main types of transfers from the federal government to local (provincial/municipal) governments, although other arrangements are possible:
- Cash transfers
- Tax point “transfers”
In the first case, money is simply transferred. Cash transfers may be conditional or une onditional.
In the second case, the central authority leaves a certain “tax space” and permits the sub-national government to fill the void. for example, imagine a province that has a 10% sales tax, half of which is imposed by the province, the other haif of which is imposed by the federal govermTlent; both levels of government tax the same transaction at 5%. The central government may, instead of transferring cash, reduce its sales tax by, say, 2% so
‘
The Econornist. September 101h 2005. Volume 376, no.8443. Pg.37.
14
that the province can raise its sales tax by 2%. So money no longer changes hands, but the federal government has foregone some revenues to the province’s benefit.
The transfer data here are cash transfers only, with the exception of Québec which receives a tax point transfer in lieu of cash (see Calculating the value of the Québec abatement).
Composition of transfers
For this study, transfer data was taken from Statistics Canada. These transfers, as defined by Statistics Canada, are:
- Canada Assistance Plan - Statutory grants
- Taxation agreements (=Equalization) - Postsecondary education grants
- Contributions under the Hospital Insurance Act - Health Resources Fund
- Regional economic expansion payments
- Official languages
- Contributions under the Crop Insurance Act - Canadian Health and Social Transfer
- Miscellaneous current transfers - Medicare
- Transfers to provincial universities
Two transfer categories represent 80% of total transfers in Canada at the end of the period of observation. They are Equalization and healthcare transfers (see Table 3).
Table 3: General transfer components in 2001, billions of dollars
Transfer Amount (Sbillions) Share
Equalization 12.2 34%
Healthcare and social’5 16.7 46%
Other 7.2 20%
TOTAL 36.1 100%
Source: Author’s calculations from Statistics Canada data
15$y4
26
Thusly particular attention will be paid to the functional form of the Equalization transfer and healthcare transfers.
Transfers to provincial universities, although they are flot direct transfers to provincial governments, are included in the analyses. The mobility of highly qualified researchers and the positive externalities they generate for Canada as a whole are sound economic reasons for federal intervention. These monies are in addition to what provinces give Canada’s public universities (there are no private universities of significance in Canada). One could suggest that the federal government is intruding on provincial jurisdiction (education). for these reasons this transfer is included in the calculations.
The following table provides summary statistics on transfers from the central level of government to provincial governments. The table is ordered from the eastern most to the western-most province. The rnetrics are: per capita transfers, measured in Canadian Dollars’6, and in nominal terms; transfers as a percent of total provincial goverment revenues including transfers (so that 50% means the provincial government receives as much money from Ottawa as it is able to collect in “own source” taxes on its territory); and transfers as a percent of provincial GDP.
16
D
D
Table 4: Basic characteristics of federal government transfers, 1981-2001, sorted from east to west. Per capita transfers Transfers as a percent of total Transfers as a percent (nominal dollars) provincial government provincial GDP revenues (includïng transfers) Mean Mean Mean Province (yearly) Min. Max. (yearly) Min. Max. (yearly) Min. Newfoundland and Labrador (NL) 2527 1355 3845 46.9% 41.8% 51.4% 15.7% 11.6% Prince Edward Island (P11) 2274 1484 3226 45.2% 36.9% 55.5% 14.1% 10.3% Nova Scotia(NS) 1779 1121 2451 39.6% 33.6% 47.6% 9.8% 7.9% NewBrunswick(NB) 1974 1165 2665 39.1% 32.8% 48.1% 11.1% 8.6% Quebec** (QC) 1292 800 1598 25.8% 20.5% 31.5% 6.1% 4.9% 7.6% Ontario (ON) 586 363 809 14.4% 8.6% 18.2% 2.2% 1.3% 2.9% Manitoba(MB) 1520 843 2117 29.6% 23.6% 33.6% 7.0% 5.7% 8.5% Saskatchewan (SK) 1208 585 1789 22.6% 16.5% 3 1.4% 5.4% 3.7% 8.4% Alberta (AB) 702 389 1057 12.5% 7.4% 19.8% 2.3% 1.3% 3.7% Britisli Colombia (BC) 661 404 833 13.8% 7.7% 19.1% 2.8% 1.6% 3.8% Source: Author’s calculations from Statistics Canada data ** Includes the 13.5% abatement of the basic federal income tax2$
Stability of per capita grants
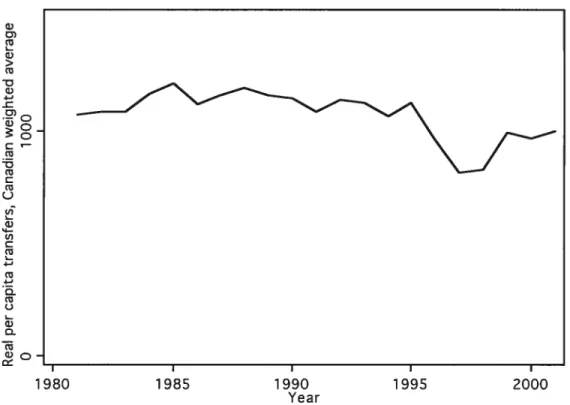
Figure I: Real (1992 dollars) federal per capita grants, Canadian weighted average
D) (1 L > 1980 1985 1990 1995 2000 Year
Source: Author’s calculations from Statistics Canada data
One property of the transfer system, as suggested by Perry’s (1997) daim that Canada is in a state of “fine tuning”, is that the overali level of per capita transfers have been relatively stable over the period under study. It is clear, though, that the years 1997 and 1992 have significantly lower per capita grants. Indeed, the Canadian federal government was attempting to reduce its budget deficit during that time period. The years 1996, 1999, 2000, and 2001 also seem to have a lower level of per capita grants, although the difference is flot as marked. Since 2001 there has been an up-tick in federal transfers.
This, however, does flot mean that littie activity was taking place. Indeed, some transfers were merged with others, whilst large transfers were sometimes spiit into two. Yet the overail federal commitment was stable over time. Recently, the stability of provincial transfer income has become an explicit policy target for the federal government, particularly with respect to Equalization payments.
Calculating the value of the Québec Abatement
In 1964 the federal government put in place an allowance mechanism for 16 and 17-year-olds that remained in school or were incapacitated (Finances of the Nation, 8:15). Québec already had such a program in place and received, instead of cash payments, a 3% tax point transfer. The federal program eventually came to an end. In order to avoid “the complete revision of the Québec income tax structure” (Finances of the Nation, 8:15), the federal government continued to allow the 3-point abatement under the condition that it recoup the entirety of this abatement.
In 1965 Québec received’7 a tax point transfer of 13.5% of the basic federal personal income tax instead of cash payments for healthcare and social welfare expenditures.
So Québec receives, in total, a 16.5% in tax point transfer that the 9 other provinces do flot receive. 0f these 16.5% tax points, 3 percentage points are returned to the federal governrnent, so that the total abatement (in real terms) is 13.5% of the basic federal tax. This tax point transfer is collected by Québec in lieu ofcash.
Note should be taken that this tax transfer was designed to be revenue neutral: Québec receives exactly the same total amount under the abatement than what it would have received had it accepted the cash transfer. Here, political forces (Québec’s aspiration towards seif-determination and demands for fiscal autonomy) influenced the type of transfer, flot its absolute amount.
The value of the abatement was calculated using the federal government’s personal income tax receipts (CANSIM series v689062: Federal Goverrnent: Direct taxes from persons). A simple algebraic manipulation will clarify how the value of the abatement was calculated’8. Let R represent the value of the basic federal personal income tax base, C the Canadian government’s receipts from this base in Québec, and
Q
the value of the Québec abatement. Then,
17
Received or negotiated for.
30
C= 0.$35R R = C/0.$35
Q
0.165R =Q
= 0.165C10.835 = 0.1976CThus rnultiplying the federal government’s receipts from the personal income tax base by 0.1976 will give us the value of Québec’s total abatement, including the 3% it remits to the federal government. Multiplying the federal government’s receipts from the personal income tax base by 0.1616 will give us the value of Québec’ s abatement for healthcare and welfare only.
The real per capita value of the Québec abatement has grown by a yearly average of 2.4%. Please see Appendix 1 that presents the value of this tax point abatement.
Throughout this thesis, the total value (16.5%) of Québec’s abatement will be removed from the province’s “own source” revenues. Then the 13.5% tax point transfer will be treated as a cash transfer. The 3% tax point transfer for the discontinued Youth Allowance program is removed from Québec’s own revenues but flot included in cash transfers since the value of this abatement is returned to the federal government in its entirety. This will allow consistent treatment ofthe data: the 13.5% transfer is revenue neutral and other provinces receive the value of this abatement in cash.
This section on the value of Québec’s tax point transfer shows how important it is to correctly “control” for the institutional mechanisms in place.
The Equalization transfer
The Equalization transfer is one of three major transfer programmes in Canada. It accounts for nearly a third of all federal transfers in Canada. Indeed, it is such an important principle in Canadian federalism that it is enshrined in the Constitution Act of
1982. The Equalization transfer thusly deserves sorne attention, particularly since “[ahi provinces recognize this program as the cornerstone of Canadian federalism”9.
In 2004 the Equalization transfer underwent some reforms, with more to corne in 2006 as an expert panel is examining the transfer. The discussion that follows pertains to the Equalization program during the 1981-2001 time period only.
The Frinciple ofEquaÏization
The Constitution Act of 1982 states in section 36(2):
Parliament and the government of Canada are committed to the principle of making equalization payments to ensure that provincial governments have sufficient revenues to provide reasonably comparable levels of public services at reasonably comparable levels of taxation.
It has been noted that although the principle of Equalization is constitutionally protected, the program in its current forrn is not. The Parliament could achieve the objective described above with another policy instrument, or it could use another forrnula.
Equalization ensures that poor provinces will not have to resort to extraordinarily high levels of taxation in order to provide public services cornparable to that of other richer Canadian provinces. What underlies the above statement is the idea that the level of public services should be somewhat uniform or cornparable within a federation. Buchanan (1950, 589) states: “An individual should have the assurance that wherever he shouid desire to reside in the nation, the over-all fiscal treatment which he receives will be approximately the same.” The Equalization transfer is clearly based on normative factors (as has been discussed above).
An important feature of Equalization is that it is unconditional: provinces may use this transfer to finance whichever expenditures they so choose.
19
British Columbia, Ministry of Finance, “Statement by the Honourable Merv Leitch, Provincial Treasurer of Alberta, on Behalf of All Provincial Ministers of finance and Provincial Treasurers, at the Meeting of Ministers of Finance and Provincial Treasurers, Ottawa, December 6 and 7, 1976”, in British Columbia Budget, January 24, 1977, at 36.
32
The mechanics ofEqualization
Simply and generally put, the Equalization formula, until the reforms of 2004, brings provinces up to the “national fiscal capacity average”. The Equalization payment compensates for, on a dollar-for-dollar basis, the difference between a standard measure of per capita fiscal capacity and a province’s actual per capita fiscal capacity. So, for example, if provincial governments are able to collect an average of $6,000 per person through taxes but one particular province is only able to collect $5,000 per person (using average tax rates), then the federal government will fil! in the void by providing an equalization transfer of $1,000.
The following equation, in which equalizationjercapita1,1 is a province’s per capita equalization entitlement in yeart, describes the transfer:
tper capita standard fiscal capacity - per capita provincial own revenues, if standards>actual
equalizattoiz.percapita I
t O, othenvise
The total transfer is the per capita entitlement multiplied by the province’s population.
Figure II: Graphical representation of per capita equalization payments Per Capita Equalization entitiement
National standard NL: $4,000
• P.
Per capita fiscal capacity National Standard
The following graph shows how close to reality this graphical representation really is. The national standard (as computed by this author from macroeconomic data) in the year shown is $5350.
34
Figure III: Equalization payments and fiscal capacity, 1999
Q Q, o u) L 4-u) C o c N w 4-o JJL ‘PEI u c’j L- NB Q.) NS MB SKQC 0N BCAB I I I I 0 2000 4000 6000
Real per capita provincial own revenues
The scatter points do no exactly fali on the theoretical une because provinces deviate from the “national average” rate of taxation. Provinces are free to set rates as they wish. So for example we can see that Ontario has a lower per capita fiscal yield than the other large provinces. This is because despite a larger base Ontario imposes lower rates of taxation. Any province that sets taxes above the average rate will lie to the right (or above) the theoretical une prescribed above; any province that sets taxes below the average rate will lie to the left (or below) the theoretical line.
I shall now explain in more detail the computation of Equalization payments20. for the purposes of this exposition, the subscript I represents a province, and the subscript
j
represents a tax base. Tax rates in province ï on goodj
are denoted by r.20
would like to thank Sean Keenan, of finance Canada, for his helpful comments and corrections.
The tax base2’ for r is denoted by b, so that total revenues accruing from this tax, also called the yieÏd, is the product of r, and b.
for each tax, the total yieid over ail 10 provinces is computed. The total base is also computed over the 10 provinces. The division of the total national yield by the total national base gives the average tax rate, ai, for each tax category:
ru b V]: arj=
Note that the above formula produces a base-weighted average.
Here, an important interpretation of the equalization formula is worth taking a moment for. Once the mechanism is understood, it becomes clear that the equalization transfer is flot revenue equalizing, but base equalizing. It compensates provinces for tax bases they have only Iimited access to (for example corporate income). Moreover, compensation is determined on the basis of how, on average, Canadian provinces exploit this base.
Now, a per capita standard measure of each tax base is created. This standard measure, sm, is a simple average of the per capita tax bases for the five “middle income provinces”: Québec, Ontario, Manitoba, Saskatchewan, and British Columbia.
V]: smj=L
i=ONQC,SK,MB,BCP P
for each province, the difference between this standard per capita measure and its own per capita fiscal capacity is calculated. Note that what is used to calculate fiscal capacity is flot a province’s actual rate of taxation but the weighted average tax rate
21
The base ofa tax is what the tax rate is appiied to. Taxable income (with some adjustments) is the base for income tax, for example. Other bases include the sales of goods and services, or the value of residential and commercial property.


![Figure IV: Real per capita transfers p]otted against real per capita provincial own revenues o o-Q ‘t Q](https://thumb-eu.123doks.com/thumbv2/123doknet/7653350.237720/71.918.187.757.137.543/figure-real-capita-transfers-against-capita-provincial-revenues.webp)


