LOIS MAINVILLE
QUEBEC'S FAMILY POLICY
An Evaluation Using Regression Discontinuity Design
Mémoire présenté
à la Faculté des études supérieures et postdoctorales de l'Université Laval
dans le cadre du programme de maîtrise en économique
pour l'obtention du grade de Maître es arts (M.A.)
FACULTE DES SCIENCES SOCIALES
UNIVERSITÉ LAVAL
QUÉBEC
2013
Résumé
Comme le nombre familles dont les deux parents travaillent augmente, plus d'enfants
fréquentent la garderie. En 1997, le Québec a implémenté sa politique familiale qui promet
une place en garderie subventionnée à tous les enfants sous l'âge de 5 ans. L'étude évalue
les effets de la politique familiale sur l'utilisation des garderies, l'offre de travail des mères
et la situation des enfants et de la famille, comme le comportement des enfants, le style de
discipline et le fonctionnement de la famille, avec un modèle de type « regression
discontinuity ». L'étude démontre des augmentations dans l'utilisation des garderies et
l'offre de travail des mères ainsi que des améliorations chez les enfants et la famille.
Malgré les améliorations au Québec, les études précédentes trouvent qu'il y a détérioration
relative au reste du Canada qui suggère que la situation au Québec ne s'améliore pas aussi
rapidement que le reste du Canada.
Abstract
With an increasing number of families with both parents working, children are now
spending more time in daycare. In 1997, Québec introduced its current family policy
which promises every child under the age of 5 a space in low-fee daycare. The study
evaluates the effects of the family policy on childcare use, maternal labour supply and a
variety of family outcomes, including child behaviours, parenting styles and family
functioning through a regression discontinuity design. Findings show increases in
childcare usage and maternal labour supply as well as improvements in child and family
outcomes. Although outcomes are improving within Québec, previous studies show that
child and family outcomes are declining relative to other provinces suggesting that
Quebec's outcomes are not improving as rapidly as the rest of Canada.
Contents
C o n t e n t s iii List of Tables iv List of F i g u r e s v 1 I n t r o d u c t i o n 1 2 Q u e b e c ' s Family Policy 4 3 E a r l y C h i l d h o o d P r o g r a m s : O v e r v i e w of I m p a c t s 83.1 Effects on Childcare Use 9 3.2 Effects on Maternal Labour Supply 9
3.3 Child Outcomes 11 3.4 Parent and Family Outcomes 12
4 M e t h o d o l o g y a n d D a t a 14
5 R e s u l t s 20
5.1 Effects on Childcare Use 21 5.2 Effects on Maternal Labour Supply 22
5.3 Effects on Child Outcomes 23 5.4 Effects on Parent and Family Outcomes 24
6 C o n c l u d i n g R e m a r k s 32
List of Tables
4.1 Summary Statistics - 1 Year Sample 19 4.2 Summary Statistics - 6 Month Sample 19 5.1 Childcare Usage and Maternal Labour Supply Estimation Results . . . 22
5.2 Hyperactivity-Inattention Scores Estimation Results 26 5.3 Emotional Disorder - Anxiety Scores Estimation Results 26
■ )
5.4 Indirect Aggression (Opposition) Estimation Results
5.5 Physical Aggression Scores Estimation Results 27 5.6 Prosocial Behaviour Scores Estimation Results 28 5.7 Peabody Picture and Vocabulary Test (PPVT) Estimation Results . . 28
5.8 Ineffective Parenting Styles Scores Estimation Results 29
5.9 Family Dysfunction Scores Estimation Results 29 5.10 Consistent Parenting Behaviour Scores Estimation Results 30
5.11 Averse Parenting Style Scores Estimation Results 30 5.12 Maternal Depression Scores Estimation Results 31 5.13 Relationship Satisfaction Scores Estimation Results 31
List of Figures
Chapter 1
Introduction
Chapter 1. Introduction 2
According to the 2001 census, around 65 percent of Québec mothers with children under the age of 6 worked1. With such a large proportion of mothers working, a
high demand for childcare is present. In 1997, the government of Québec began the implementation of its current family policy which includes direct subsidies to daycare centres in order to provide every child under the age of 5 a place in daycare at a low-fee of $5 per day per child. The purpose of this study is to evaluate the effects of Quebec's low-fee childcare networks on childcare use, maternal labour supply and child and family outcomes, such as child behavioural scores, parenting styles and family functioning scores, through a regression discontinuity (RD) design with data from the National Longitudinal Survey on Children and Youth (NLSCY).
The goals of Quebec's family policy are to increase mother's labour force participa-tion, allow women to reconcile the needs of the home and the workplace, and to create equality of opportunity among children (Baker et al., 2008, Lefebvre et al., 2011). Child-care subsidies have dramatically increased since 1997, accounting for over $2 billion of the province's public funds in the 2012-2013 budget (Conseil du trésor, 2012). There is also evidence that low-fee daycare facilities across lack of quality standards which puts into question whether the objectives of Quebec's family policy are being met (Japel et al., 2005).
There are several advantages to publically funding early childhood programs. First, by providing equal endowments, children are on an equal level when they start school. This creates equality of opportunity, which reduces poverty, social assistance depen-dency, dropout rates, and crime in the long-run. Secondly, the increased participation of mothers in the workplace increases the tax base and decreases social assistance depen-dency among mothers. Finally, the public funding and monitoring of childcare corrects for liquidity constraints and imperfect information about the quality of care that may prevent parents from optimally investing in their child's development (Baril et al., 2000; Blau and Currie, 2006; Currie, 2001).
Several studies have focused on the effects of early childhood programs on chilcare use, mothers' labour supply and child development. However, few studies have eval-uated the effects of Quebec's low-fee system. Furthermore, no studies have used an RD design to evaluate early childhood programs. Baker et al. (2008) and Lefebvre et al. (2011) have found, using difference-in-difference approaches, that Quebec's low-fee system has increased childcare use and maternal labour supply with mixed results
'Source: Labour Force Activity (8), Presence of Children by Age Groups (11), Age Groups (5A), Marital Status (7C) and Sex (3) for Population 15 Year and Over Living in Private Households for Canada. Provinces, Territories, Census Metropolitan Areas and Census Agglomerations, 2001 Census - 20% Sample Data. Ottawa: Statistics Canada, May 14, 2003. 2001 Census of Canada. Catalogue number 95F0378XCB2001004.
Chapter 1. Introduction 3
concerning child development.
Overall, results in the current study differ from previous studies both in terms of the direction and size of the impact of the family policy. We find that childcare usage and maternal labour supply have increased, and that child and family outcomes have improved in households that are eligible for subsidized childcare relative to households that are not eligible for subsidized daycare. Our results show that follwing the family policy, outcomes improve for children eligible for low-fee spaces relative to children who we're not eligible for low-fee spaces in Québec. Relative to previous studies our results show that although the family policy has improved outcomes in the province, outcomes have not improved as rapidly as in the rest of Canada.
The current study will present Quebec's family policy and childcare system in Chap-ter 2 and a littérature review on childcare, maChap-ternal labour supply and child develop-ment in Chapter 3. Chapter 4 will present the methodology used to evaluate Quebec's family policy. Finally, Chapter 5 will present the study's results follwed by concluding remarks in Chapter 6.
Chapter 2
Chapter 2. Quebec's Family Policy 5
Beginning in 1997, several changes were made to Quebec's childcare and education system in order to increase mothers' employment and decrease poverty. Major changes included reform to the tax system, provision of full-time kindergarten and subsidies to daycare facilities. First, provincial universal child allowances were replaced with fam-ily allocations adjusted to household income. Secondly, provision of kindergarten in a public school setting for children aged 5 on September 30th changed from part-time to full-time. In addition, before and after school care was provided to kindergarten and elementary school aged children for $5 per day per child. Finally, the provincial gov-ernment began the implementation of subsides to daycare facilities in order to provide every child in Québec aged 0-4 years a space in day care at a low-fee of $5 per day. Following the impementation of the family policy, the Québec Parental Insurance Plan was introduced in 2006 offering parental leave to both salaried and both self-employed parents (Ministère de l'emploi et de la solidarité sociale Québec, 2009). In 2004, child-care fees were raised to $7 per day per child (Baker et al., 2008; Japel et al., 2005, Lefebvre, 2004; Lefebvre et al., 2011). The implementation of low-fee spaces was made as follows (Japel et al., 2005; Lefebvre et al., 2011):
• September 1st, 1997: children aged 4 on September 30th, 1997 are eligible; • September 1st, 1998: children aged 3 and 4 on September 30th, 1998 are eligible; • September 1st, 1999: children aged 2, 3 and 4 on September 30th, 1999 are
eligible;
• September 1st, 2000: all children aged 0 to 4 on September 30th, 2000 are eligible.
Quebec's working parents have many childcare options in daycare facilities and in home settings. Daycare centres regulated by the Act Respecting Childcare Centres and Childcare Services include non-profit centres, also known as "centres de la petite enfance" (CPE), and for-profit daycare centres. In addition, regulated childcare in a home setting is also available. Childcare providers offering services regulated by the act sign agreements with the province to receive subsidies to offer low-fee spaces. Parents also have the option of sending their children to daycare facilities, nursery schools and babysitters that are either regulated or unregulated but which do not benefit from subsidies (Japel et al., 2005).
There are currently waiting lists for low-fee spaces due to the popularity of the program. In order to reduce pressure on the low-fee childcare system, the provincial government offers up to $9,000 in refundable tax credits adjusted to family income to parents with children aged 7 or under who send their children to non-subsidized
Chapter 2. Quebec's Family Policy 6
childcare. Households with family income as high as $150,000 can benefit from this credit. When the program began in 1997. 76,715 spaces were offered at a low fee (Lefebvre et al.. 2011). As of October 31. 2012. 218,247 subsidized daycare spaces were available across the province representing 89 percent of Quebec's 252,556 total daycare spaces (Ministère de la famille et des aînés, 2012a). In November 2012, the provincial government announced the creation of 28,000 additional subsidized daycare spaces across the province in order to increase the total number of subsidized spaces to 250,000 by the end of 2016 (Ministère de la famille et des aînés, 2012b). On average, daycare subsidies are valued at around $9,000 per space for a total of over $2.0 billion across the province (Conseil du trésor, 2012; Lefebvre et al., 2011). As of 2010, 51 percent of children in Québec aged between 0 to 4 were attending regulated daycare1
(Ministère de la famille et des aînés, 2012c). Since the implementation of the 1997 family policy, 98 percent of 5 year olds attended kindergarten on a full-time basis (Lefebvre et al., 2011).
Lefebvre (2004) outlines certain issues with Quebec's public daycare system:
• Lack of flexibility: Children must be registered to daycare full-time and hours are often structured to accommodate the standard Monday to Friday work week. Therefore parents working odd hours or part-time are not accommodated. • Inequality between choices of care: Working parents who do not use childcare do
not get the same benefits (subsidies and tax credits) as the parents who use childcare.
• Usage of public care by high-income families: Low-fee spaces are mostly used propo-tionately more by higher-income parents. While only 49 percent of Québec chil-dren come from two parent families with annual income of more than $60,000, they consist of 58 percent of the low-fee spaces. On the other hand, 26 percent of children are from families with annual income of less than $40,000 and represent 18 percent of the low-fee spaces. A similar unequal distribution can be observed for dual and single parent families.
• Children in disadvantaged situations: These children would benefit the most from early childhood programs. However, as mentioned in the previous point, they do not benefit from the low-fee spaces. Furthermore, no additional government programs target these at-risk children.
Percentage computed using Statistics Canada 2010 population data for 0 to 4 year olds in Québec. Source: Statistics Canada. Table 051-0001 - Estimates of population, by age group and sex for July 1, Canada, provinces and territories, annual (persons unless otherwise noted), CANSIM (database)
Chapter 2. Quebec's Family Policy 7
• High usage of non-parental care: The increase in maternal employment led to an increase in the time children spent in non-parental care. This may pose develop-mental issues for children especially under the age of three.
• Quality: Several studies have shown that many of Quebec's low-fee facilities are of poor quality. Japel et al.(2005) find that 61 percent of low-fee facilities meet the minimum standards. Furthermore, children from disadvantaged families are more likely to attend the facilities that do not or barely meet standards.
Other Canadian provinces have not followed Quebec's policy. However, British Columbia and Ontario are currently extending kindergarten for 5 year olds on a full-time basis to all elementary public schools by the 2012-13 and 2015-16 academic years respectively (Lefebvre et al., 2011).
When evaluating the impacts of early childhood programs, one must clearly distin-guish between early childhood intervention and childcare. Early childhood intervention programs, such as Head Start in the United States, are programs targeting children at risk of having a poor development. These programs are administered from the child's birth to the time the child starts school. On the other hand, childcare, such as Quebec's low-fee system, is non-parental care offered formally via daycare centres and pre-schools or informally through babysitters or relatives in a home setting (Waldfogel, 2002).
Chapter 3
Early Childhood Programs:
Overview of Impacts
Chapter 3. Early Childhood Programs: Overview of Impacts 9
Studies by Lefebvre et al. (2011) and Baker and al. (2008) focus on the effects of Quebec's daycare subsidies on childcare use, maternal labour supply and child outcomes. Both these studies use difference-in-difference methods, comparing Québec with the rest of Canada, with data from Statistic Canada's National Longitudinal Survey on Children and Youth (NLSCY). Both studies consider the post-policy period to begin in the third cycle of the NLSCY (1998-99 survey). Many other studies, reviewed below, examine the effects of childcare on mothers' employment and child outcomes.
3.1 Effects on Childcare Use
The effect of the Québec family policy is positive and significant on childcare use in Québec. Lefebvre et al. (2011) estimate that daycare usage increases through the NLSCY cycles. More specifically they estimate an increase of 2.5 hours per week for children aged 1-4 in 1998-99, rising to 10.7 hours per week increase in 2006 for the same group of children. The authors suggest that this gradual increase is caused by the gradual implementation of the childcare subsidies (Lefebvre et al., 2011). Baker et al.(2008) estimate that childcare use in Québec increased by 14 percentage points relative to the rest of Canada following the new policy.
3.2 Effects on Maternal Labour Supply
Many studies have established sa negative relationship between childcare costs and maternal employment (Jacobsen, 2007). Using data from the NLSCY, Baker and al. (2005) estimate the elasticity of maternal labour supply at -0.236 relative to childcare costs.
However, the net effect of childcare on maternal employment depends on the struc-ture of the labour market and how the different policies interact with each other. In theory, family allowances decrease labour supply, by increasing non-employment in-come, while parental leave increases employment since new mothers usually do not have to look for a new job after having a child. Childcare subsidies increase labour sup-ply by making care more affordable (Jacobsen, 2007). Dex and Walter (1992) provide an interesting comparison of how the different aspects of family policies affect maternal employment differently in Britain and France. In Britain, part-time work is much more common, British women also work for most of their lives but with periods of no partic-ipation in the labour force. In contrast, French women show a more continuous work
Chapter 3. Early Childhood Programs: Overview of Impacts 10
pattern in their lives. In France, women who do not work come from the lower-skilled groups with large families that benefit from family allowances, as the family allowance structure in Britain creates incentive for mothers to work part-time. Differences in the public provision of childcare may explain why high-earning French women work full-time on a consistent basis (Dex and Walter, 1992).
In Québec, the family policy has increased maternal labour force participation sig-nificantly. Lefebvre et al. (2011) find that Quebec's family policy increased labour force participation of mothers with children aged 1-4 by 8 percentage points in 1998-99. The effect on labour force participation for this group of mothers is positive and significant across the entire sample with the exception of the 2000-01 cycle of the NLSCY due to an economic downturn. The effects are larger for university educated single mothers (Lefebvre et al., 2011). Using data from Statistic Canada's Survey of Labour and In-come Dynamics (SLID), Lefebvre et al. (2008) find a similar 8 percentage point increase among mothers with at least one child aged 1 to 4 in 2002. Furthermore, the study finds that Quebec's family policy increased hours worked by 231 hours per year and increased weeks worked by 5.1 weeks annually (Lefebvre and Merrigan, 2008). Baker et al. (2008) estimate a similar effect on maternal labour force participation for mar-ried mothers. They estimate a 7.7 percentage point increase in maternal labour force participation in Québec relative to the rest of Canada with the effects being largest for women working between 30 and 40 hours per week (Baker et al., 2008).
Baker et al.(2008) notice that only half of the increase in subsidized daycare can be explained by the increase in maternal labour force participation. According to the authors, two factors could explain this phenomenon. First, non-working mothers may be using childcare. Second, women who previously used informal childcare may not have reported use of non-parental care during the survey. The authors verify these suggestions by dividing the sample into 4 groups: working women who use childcare, working women who do not use childcare, working women using childcare and non-working women not using childcare. They find a 4.8 percentage point decrease among women who work but do not use childcare and a 12.5 percentage point increase among women who work and use childcare leading to the 7.7 percentage point net increase in childcare. As the increase in maternal labour force participation rate and the increase in childcare use are not equal, the effects of Quebec's family policy are a mix of an increase in maternal employment and a shift from informal to formal childcare (Baker et al., 2008). When observing weeks worked, Lefebvre et al. (2011) suggest that an income effect can reduce the labour supply of mothers who are willing to work in the absence of childcare subsidies.
Chapter 3. Early Childhood Programs: Overview of Impacts 11
3.3 Child Outcomes
Extensive research on the effects of maternal employment and childcare on child and family outcomes has been conducted in the fields of psychology, anthropology, sociology and economics, which shape public policy regarding childcare (Waldfogel, 2003). The studies reviwed in this section all use difference-in-difference methods.
Lefebvre and Merrigan (2002) estimate the relationship between childcare and child development using the Peabody Picture and Vocabulary Test (PPVT) results found in the 1994-95 cycle of the NLSCY across Canada. The authors find that childcare has small positive effects PPVT scores for four and five year olds. Moreover, the study finds that P P V T scores do not diverge depending on the method of care. However, the study identifies children who may have deficiencies when starting school by evaluating the effects of certain characteristics on PPVT scores. The authors find PPVT scores to be higher for children with many siblings (3-5 points higher), older mothers (4-5 points higher), more educated mothers (6-8 points higher) and from families with both bio-logical parents (6 points higher). Furthermore, children from immigrant families (4-12 points lower) and single parent households (4 points lower) tend to score lower (Lefeb-vre and Merrigan, 2002). A more recent study by Lefeb(Lefeb-vre and al. (2011) evaluates the effects of spending more time at a low-fee daycare. They find that Quebec's low-fee policy has a negative impact for 4 and 5 year olds P P V T scores, relative to the rest of Canada. In the case of 4 year olds the effect is not significant. However concerns are raised for children with a low-educated mother, due to the larger negative effects on P P V T scores. The authors find that equality of opportunity was not achieved through the Québec system of subsidized care (Lefebvre et al., 2011).
Baker et al. (2008) find similar non-significant effects on PPVT scores in Québec relative to the rest of Canada due to the lack of 4 year olds in the sample. However, the study reveals important findings on child behaviour, child health and parental health. They found that scores measuring hyperactivity, anxiety, aggression and opposition increased in Québec relative to the rest of Canada following the Québec family policy. The deterioration of child behaviour may be explained by reporting issues and the rapid transition towards subsidized care in Québec. Moreover, working parents may report behaviours that non-working parents do not. Similarly, childcare providers may report behaviours that parents do not. When observing health impacts on children, the study finds a 5.5 percentage point decrease in the probability of children being in excellent health relative to the rest of Canada following the Québec policy. The study finds that there is an increase in probability of having nose, throat and ear infections but no change in asthma and physical injuries. Therefore, poor health outcomes are a result
Chapter 3. Early Childhood Programs: Overview of Impacts 12
of a higher rate of exposure to communicable illnesses. The study also finds negative effects on parent-child interactions, as well as a decrease in the health of parents (Baker et al.. 2008).
Contrary to Québec subsidized daycare, Canadian children attending early child-hood education programs seem to have positive developmental effects. Using the 1996-97 cycle of the NLSCY, Lipps and Yiptong-Avila ( 1999) compare the effects of attending non-parental care such as pre-school, playgroups, mother-child programs, daycare and being cared for by a paid non-relative, to parental care on kindergarten and first grade academic scores. Their study finds that early childhood care outside the home has a greater positive impact on academic performance than being cared for in the home regardless of family income and maternal education levels. Furthermore, children who attend pre-schools and kindergartens rather than daycare perform better academically, specifically in mathematics, reading and writing.
The authors also compare PPVT scores. They find that reading to a child increases PPVT scores by 5 points regardless of family income and maternal education levels. Children attending non-parental care score 2 points higher than those who do not at-tend. Furthermore, children whose mothers have a post-secondary degree and family income of more than $40,000 score 11 points higher. The study suggests that a combina-tion of reading to the child, attending non-parental care, having a good family income and educated mother increases PPVT scores by 18 points (Lipps and Yipton-Avila, 1999).
Although extensive research on the effects of early childhood programs on child-care usage, maternal labour supply and child outcomes has been performed in various fields including economics, psychology, anthropology and sociology, there are few stud-ies examining the effects of Quebec's low-fee network. Of the existing research on Quebec's family policy, Baker and al. (2008) do not take into account single mothers. Furthermore, the existing studies on Quebec's low-fee childcare system use difference-in-difference methods leaving the robustness of the results via alternative methods un-verified.
3.4 Parent and Family Outcomes
Baker and al. (2008) study the effects of Quebec's family policy on parent and parenting outcomes using scores computed within the NLSCY. They find a 8.7 percent increase in ineffective parenting scores and a 2.4 percent increase in averse parenting scores while
Chapter 3. Early Childhood Programs: Overview of Impacts 13
consistent parenting scores have decreased by 3.6 percent. The authors also find that the policy had negative outcomes on parental health. More specifically, they find a decrease in the probability of fathers being in excellent health of 2.9 percentage points relative to the rest of Canada, as well as an increase in mothers' depression scores. However, the authors do not find a significant effect of the policy on the probability of mothers being in good health (Baker et al., 2008).
Chapter 4
Chapter 4. Methodology and Data 15
In the administration of programs, eligibility requirements are imposed in order to determine which individuals receive treatment. Regression Discontinuity (RD) designs use these thresholds to evaluate the impact of a program (Khandker et al., 2010; Imbens and Lemieux, 2008). In the current study, children eligible for low-fee daycare spaces are compared to children who were not eligible for low-fee spaces in order to evaluate the impact of Quebec's family policy. The eligibility threshold is determined by the children's birthdates. When the program was implemented in 1997, children aged four on September 30th were eligible for a low-fee space while other children were not (Baker et al., 2008; Japel et al., 2005; Lefebvre et al., 2011). Therefore children born October 1st, 1992 or later had access to low-fee spaces while children born before this date did not.
As illustrated in Figure 1, the main concept behind RD designs is to exploit the discontinuity in treatment in order to evaluate the impact of the programs (Cameron and Trivedi, 2005). To ensure comparability, the sample must consist of observations around the cutoff point as they would experience similar results in the absence of the program (Khandker et al., 2010). In the case of our study, the threshold is determined using the child's birthdate. The discontinuity will occur on October 1st, 1992. On September 30th, 1997, a child born October 1st, 1992 was four years old while a child born September 30th, 1992 was five years old. These children have similar character-istics and would have had the same outcomes if Quebec's family policy did not exist since they are only a day apart in age. The comparison of these two sets of children will be the local average treatment effect of low-fee daycare.
S
i n
o
Regression Discontinuity Example
1 4 Actual data No treat (low) Treat (high) 5 Selection variable S
Chapter 4. Methodology and Data 16
In a sharp RD design, the only factor determining treatment is the eligibility require-ment. In a fuzzy RD design, factors other than the eligibility criteria may determine whether an individual receives treatment. As a result, individuals ineligible to partici-pate in the program may be in the treatment group while others eligible for treatment may be in the control group (Cameron and Triverdi, 2005; Imbens and Lemieux, 2005; Khandaker and al.. 2010: Woolridge. 2010). In our sample, it appears that there are children over the age of 4 on September 30th. 1997 attending low-fee daycare despite their ineligibility based on the assumption that all licensed providers in the NLSCY re-ceive subsidies. In theory, the effect of attending subsidized daycare should be evaluated using a fuzzy RD design. However, it is difficult to distinguish which providers recieved subsidies as there is no explicit category for Quebec's low-fee daycares in the NLSCY. Furthermore, there are few of these children who attended despite their ineligibility. Therefore, we adopt a sharp RD design.
Our model of interest is:
Y% = a + (3 Birthdayi + 7 A; + et (4.1)
where Yi represents the outcome of individual i (daycare usage, maternal labour supply, child outcomes). Birthdayi represents the number of days the child was born from the eligibility cutoff. For example, a child who is born on the eligibility cutoff of October 1st, 1992 will have Birthdayi equalling zero. A child born September 30th, 1992 will have Birthdayi value of -1 while a child born October 2nd, 1992 will have a Birthdayi value of + 1 . Xt consists of socio-economic control variables. These controls
include the parents' education levels, the age of the parents at the birth of the child, the parents' immigration status, family composition, the number of siblings, the sex of the child and the size of the region. The parameter of interest (3 measures the average treatment effect of Quebec's Family Policy. We thus estimate the following model:
Y = a0 + PoBirthdayi + 70Xt + tu Birthdayi < 0 (4.2)
Chapter 4. Methodology and Data 17
The average treatment effect is thus given by:
T = E{Y+\Birthday - 4 0 ) - E(Y-\Birthday y 0) = a1 - a0 (4.4)
The average treatment effect measures the outcomes for children who were eligible for low-fee spaces relative to those who were not. The average treatment affect captures the impacts on children who both attended subsidized daycare and those who did not as parents of eligible children that did not attended subsidized daycare recieved refundable childcare tax credits. To obtain the average treatment effect on the treated, the effect of attending low-fee daycare relative to not being eligible for low-fee daycare, we divide (3.4) by the proportion of children attending subsidized daycare across the province. In 1997, there were 74,058 subsized spaces and 94,674 eligible children which represents a 78 percent low-fee daycare participation rate (Lefebvre et al., 2011). The precise specification of the model depends on the type of the outcome variable Y. If Y is continuous, the model is estimated by OLS. If Y consists of count data, the model is estimated by a Poisson regression. Finally, if Y is discrete, the model is estimated with a probit regression. /? is estimated with a quadratic, cubic and quartic Birthday to verify functional form.
Data from the third cycle (1998-1999) of the NLSCY is used to estimated the effects of Quebec's family policy. The NLSCY is a survey administered every two years by Statistics Canada and Human Resources and Skills Development Canada that tracks the development of children in Canada from birth to young adulthood. The survey includes data on child health, physical development, learning, behavior, and on the child's social environment (Statistics Canada, 2010). The 1998-1999 cyle of the NLSCY is used as the data contained in the time of surveying corresponds with the implementation period of the family policy.
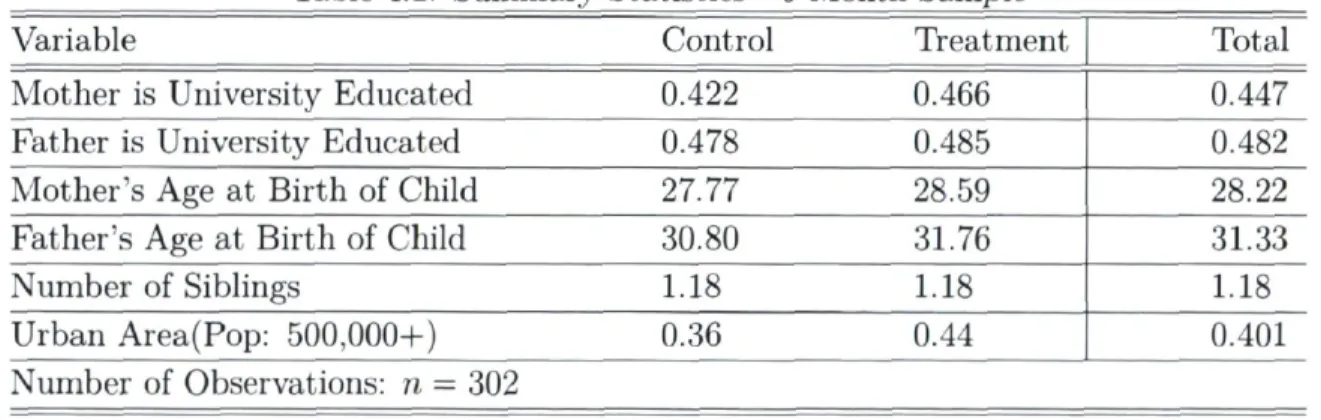
To evaluate the effects of the policy on childcare use, the survey contains data on the number of hours of week spent in childcare. To evaluate the effects of the policy on maternal labour supply, data on whether the mother participates to the labour force and the number of weeks worked is available. To evaluate the effects of the policy on child outcomes, scores on hyperactivity-inattention, emotional disorders, prosocial behavior, physical aggression, indirect aggression and Picture and Vocabulary (PPVT) scores are available. Furthermore, the health status of the child is also available. Finally, to evaluate the effects of the policy on family outcomes, scores on parenting style, family dysfunction, maternal depression and relationship satisfaction are available. Tables 3.1 and 3.2 present summary statistics for the control variables in the 1 year sample and 6
Chapter 4. Methodology and Data 18
month sample, respectively. The characteristics of children in the control and treatment groups are similar as they are all born with the same year or 6 months depending on the window of estimation.
Chapter 4. Methodology and Data 19
Table 4.1: Summary Statistics - 1 Year Sample
Variable Control Treatment Total Mother is University Educated 0.447 0.422 0.427 Father is University Educated 0.470 0.420 0.430 Mother's Age at Birth of Child 27.97 28.47 28.39 Father's Age at Birth of Child 30.54 31.90 31.66 Number of Siblings 1.25 1.23 1.23 Urban Area(Pop:500,000-r-) 0.289 0.541 0.496 Number of Observations: n = 1397
Table 4.2: Summary Statistics - 6 Month Sample
Variable Control Treatment Total Mother is University Educated 0.422 0.466 0.447 Father is University Educated 0.478 0.485 0.482 Mother's Age at Birth of Child 27.77 28.59 28.22 Father's Age at Birth of Child 30.80 31.76 31.33 Number of Siblings 1.18 1.18 1.18 Urban Area(Pop: 500,000+) 0.36 0.44 0.401 Number of Observations: n = 302
Chapter 5
Results
Chapter 5. Results 21
Overall, results differ from previous studies both in terms of the direction and size of the impact of the family policy. Previous studies used a difference-in-difference approach consisting of comparing Québec children with children from other provinces before and after the family policy. These children were not necessarily born in the neighborhood of the eligibility threshold, children aged 4 years of age on September 30th, 1997. The RD design compares children living in Québec born within a year of the eligibility threshold. These differences in control and treatment groups yield different outcomes. Although Québec children's outcomes fall compared to children from the rest of Canada, children from Québec eligible for subsidized daycare under the family policy have improved outcomes relative to their counterparts not eligible for low-fee spaces under the family policy. Contary to previous studies, we find improvements in child and family outcomes following the family policy. The difference in outcomes between the previous literature and the current study implies that the family policy has led to improving outcomes in the province however these improvements are not as large in Québec relative to the rest of Canada.
There is an important trade-off when choosing the window of estimation. Although we are closer to the eligibility threshold, eliminating other factors that may affect out-comes, using a six month window dramatically reduces the sample size from 1397 ob-servations to 302 obob-servations as seen in Tables 3.1 and 3.2 respectively. However, enlarging the window to obtain a larger sample results in a bias in our estimator, i.e. the outcome is affected by other factors than program eligibility. For example, labour market changes due to an economic downturn.
5.1 Effects on Childcare Use
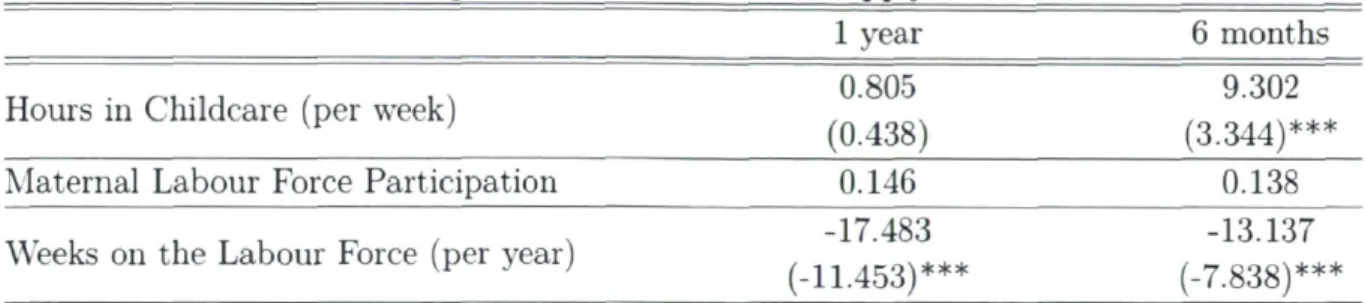
Similarly to other studies using difference-in difference approaches, there is an increase in daycare usage following the family policy when estimating the model using an RD design. Table 4.1 shows the effects of the family policy on childcare usage. Although there is no significant increase or decrease in the number of hours per week spent under non-parental care using the sample of children whose birthdates fall within one year of the eligibility threshold, there is a significant increase of 9.3 hours per week for the sample of children whose birthdates fall within 6 months of the eligibility threshold. This effect obtained from the RD design is greater than the initial effect, found using a difference-in-difference approach, of 2.5 hours per week relative to the rest of Canada in the Lebfebvre and al. (2011) study. This result represents the average treatment effect, i.e. relative to children who were not eligible for low-fee daycare under the family policy. Dividing the average treatment effect by 78 percent, the percentage of children
Chapter 5. Results 22
Table 5.1: Childcare Usage and Maternal Labour Supply Estimation Results
1 year 6 months
H . n, .1, , .* 0.805 9.302
Hours in Childcare (per week) . , . ...
VF ; (0.438) (3.344)***
Maternal Labour Force Participation 0.146 0.138 Weeks on the Labour Force (per year) -17.483 -13.137
(-11.453)*** (-7.838)" (*) significant at the 10% level; (**) significant at the 5% level: (***) significant at the 1% level.
attending low-fee daycare when the policy was introduced, we obtain the treatment effect on the treated which consists of the change in daycare usage for eligible children who attented low-fee daycare. The average treatment effect on the treated shows an increase of 11.2 hours per week spent under non-parental care for children attending low-fee daycare relative to childrne who were not eligible for childcare subsidies. The results found in the current study show a much greater initial increase in childcare usage.
5.2 Effects on Maternal Labour Supply
The effects of the family policy on maternal labour supply are summarized in Table 4.1. Using the sample of children whose birthdays are within one year of the eligibility threshold, there is a 14.6 percentage point increase in the labour force participation rate of their mothers. Using the sample of children whose birthdays are within 6 months of the eligibility threshold, there is a 13.8 percentage point increase in the labour force participation rate of mothers. This represents the average treatment effect or the increase in the labour force participation rate of mothers with children who were eligible for subsidized childcare under the family policy relative to mothers whose children were not eligible for these low-fee spaces.
The current study finds a decrease in the number of weeks worked per year for mothers whose children were eligible for subsidized childcare under the family policy. Lefebvre and al. (2011) suggest an income effect may reduce the labour supply of mothers without an associated decrease in the labour force participation of mothers since mothers can reduce their labour supply by reducing the amount of time on the labour market rather than leaving the labour market altogether. This income effect occurs when mothers who would work without a family policy reduce their labour supply due to the income saved through low-fee childcare (Lefebvre and al., 2011).
Chapter 5. Results 23
Although Lefebvre and al.(2011) make the hypothesis of an income effect, they find an increase in the number of weeks worked of mothers in Québec relative to the rest of Canada following the family policy indicating there is no income effect. The current study suggests an income effect as women whose children were eligible for subsidized daycare decrease weeks worked per year by 17.5 weeks and 13.1 weeks relative to mothers whose children were not eligible for subsidized childcare under the family policy, for the 1 year and 6 month sample respectively.
5.3 Effects on Child Outcomes
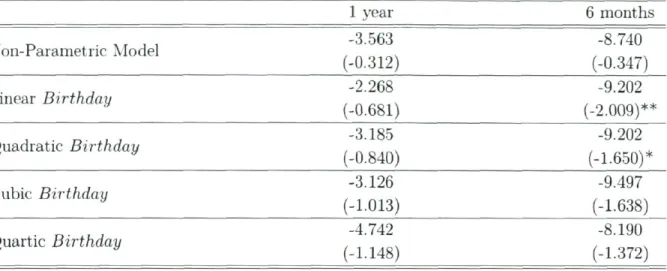
Table 4.2 summarizes the results for hyperactivity-inattention scores. Using a RD design, the current study finds a 8.2 to 9.5 point decrease in hyperactivity-inattention scores1 for children who were eligible for subsidized daycare relative to children who
were never eligible for subsidized daycare in the OLS model for the 6 month sample. However, the only statistically significant results is a decrease of 9.2 points in the OLS quadratic model. Although there are decreases of 2.2 to 4.7 points in the one year sample, there are no significant results in this sample. Baker and al. (2008) find a non-significant increase in hyperactivity-inattention scores for children aged 2-3 years.
Scores measuring the presence of emotional disorders have also decreased in Québec following the family policy when evaluating the effects using a RD design. Results found in Table 4.3 show that, relative to children who were never eligible for low-fee daycare under the family policy, there was a 5.9 point decrease in emotional disorder scores2 for children who were eligible for subsidized daycare under the family policy
using the cubic model in a 6 month sample. Baker and al. (2008) find a non-significant increase in emotional disorders scores of 0.12 points for children aged 2-3 years of age.
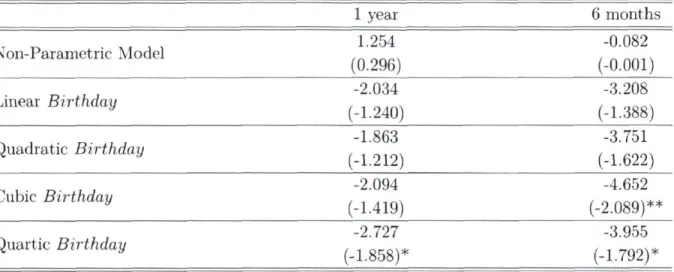
Table 4.4 outlines the results found for indirect aggression. Indirect aggression has also been on the decline in Québec when using a RD design. Using the 6 month sample, the current study finds a 4.7 point decrease in indirect aggression scores5 in children
who were eligible for subsidized daycare under the family policy. Baker and al. (2008) find a non significant 0.98 point decrease in emotional disorders for children aged 2-3 years of age.
Following the family policy, there is no significant or strong findings with regards ^yeractivity-inattention: 0-16 point scale
2Emotional disorders: 0-16 point scale 3Indirect aggression: 0-10 point scale
Chapter 5. Results 24
to impacts on physical aggression scores1 and prosocial behaviour scores'. Results for
the effects on physical aggression and prosocial scores as summarized in Tables 4.5 and 4.6.
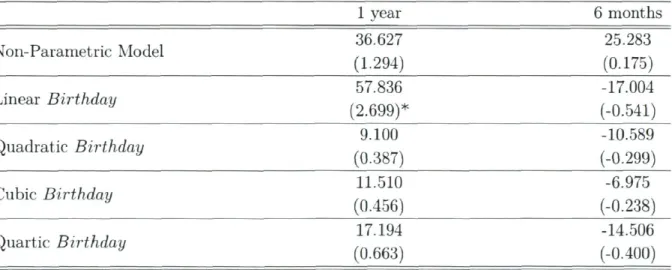
Similar to previous studies, estimating the impact of the family policy on PPVT scores'1 using and RD design does not yield significant results. More specifically, the
current study finds very volatile results with regards to P P V T scores with scores de-creasing by 17 points to inde-creasing by 57 points. Reasons for this volatility could be explained by a large number of missing PPVT scores in the sample. Results for PPVT scores are summarized in Table 4.7.
5.4 Effects on Parent and Family Outcomes
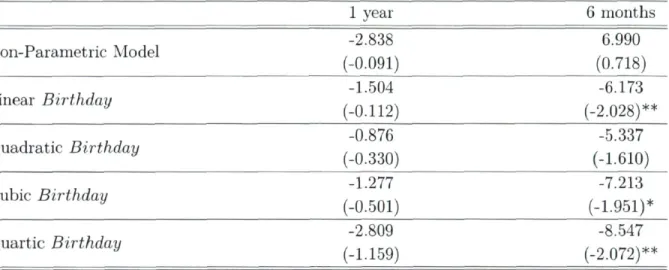
When estimating the effect of the family policy on family outcomes using an RD design, significant improvements occur in the areas of ineffective parenting, family functioning and relationship satisfaction between the parents. Ineffective parenting scores are com-puted using responses to survey questions concerning discipline. Ineffective parenting scores' have declined in Québec following the family policy. Results in Table 4.8 show that using the sample of children whose birthdays are within six months of the eligibility threshold, there is a significant 6.2 to 8.5 point decrease in ineffective parenting scores for children who were eligible for daycare subsidies under the family policy relative to children who were never eligible for these subsidies, depending on the model used to estimate the RD design. These results contradict previous studies who find a 0.73 point decrease in ineffective parenting scores in Québec relative to the rest of Canada (Baker and al., 2008).
Similarly to ineffective parenting, family dysfunction scores8 also significantly
de-creased in Québec following the family policy. As outlined in Table 4.9, using the 6 month sample, there is an estimated increase of 12.4 points in family dysfunction scores of children eligible for subsidized daycare relative to children who were never eligible. Previous studies have estimated family dysfunction to have only increased by 0.42 points relative to the rest of Canada following the family policy (Baker and al., 2008).
4Physical aggression: 0-12 point scale 5 Prosocial behaviour: 0-20 point scale 6PPVT scores: 160 point scale
ineffective parenting: 0-25 point scale
Chapter 5. Results 25
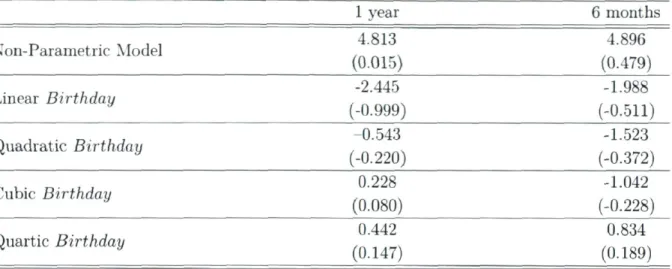
No conclusions can be made with regards to consistent0 and averse10 parenting
scores as the changes are not significant. Maternal depression scores" are declining in the RD design, however the results are not significant. Results for consitent and average parenting scores as well as maternal depression are summarized in Tables 4.10, 4.11 and 4.12 respectively.
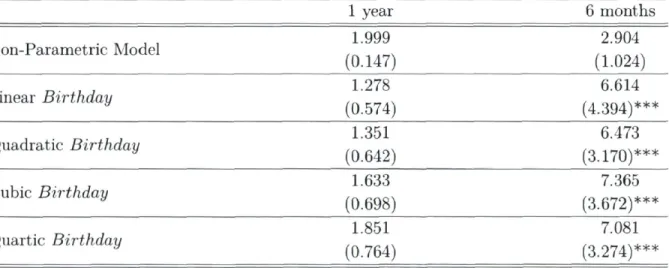
Finally, the effect of the family policy on the level of satisfaction of the mother's relationship with her partner are shown in Table 4.13. Following the implementation of the family policy, relationship satisfaction scores12 have increased by 6.6 to 7.4 points
for the parents of children who were eligible for subsidized childcare when using the 6 month sample. The nature and size of the relationship is greater than in the study undertaken by Baker and al. (2008) which found a 0.422 point decrease in relationship satisfaction relative to the rest of Canada.
9Consistent parenting: 0-20 point scale 10Averse parenting: 0-20 point scale nMatenral depression: 0-36 point scale 1 Relationship satisfaction: 0-11 point scale
Chapter 5. Results 26
Table 5.2: Hyperactivity-inattention Scores Estimation Results
1 year 6 months ~ ^ ~ • w J i -3.563 _-8.740 ~~ Non-Parametric Model . „ „„ . , (-0.312) (-0.347) T - D - * U J '2-2 6 8 "9-2 0 2 Linear Birthday , „ „. . . . (-0.681) (-2.009)** T , ~ , , -3.185 -9.202 Quadratic Birthday ^ ^ ( . ^ p ) * Cubic Birthday £ ^ ( l e S S ) . _ . , , -4.742 -8.190 Quartic Birthday { _ ^ ^ ^
(*) significant at the 10% level; (**) significant at the 5% level; (***) significant at the 1% level. 0-16 point scale: higher scores indicate hyperactive-inattentive behaviour.
Table 5.3: Emotional Disorder - Anxiety Scores Estimation Results
1 year 6 months
Z i T • * , : . , -5.010 -5.162
Non-Parametric Model . „ „ , , „ „ _ . , (-0.013) (-0.215) 7 -2.673 -3.821 Linear i?zrt7u% ^ ^ (.1.307) ^ j o- L J - 2 -8 2 0 4-0 3 9 Quadratic jfrrthfay ^ ^ ( i .5i9 ) P K" R *!.,# "2-9 7 7 -5'8 8 0 Cubic Birthday (-1.436) (-1.748)* „ . , , 4.078 -5.316 Quartic Birthday ^ ^ ( 1 3 5 2 )(*) significant at the 10% level; (**) significant at the 5% level; (***) significant at the 1% level. 0-16 point scale: higher scores indicate presence of behaviour associated with anxiety and emotional disorder.
Chapter 5. Results 27
Table 5.4: Indirect Aggression (Opposition) Estimation Results
1 year 6 months
Non-Parametric Model ^ ^ (.Q.Q01)
-2.034 -3.208
Linear Birthday ^ 4 0 ) (-1.388)
^ , „ , , -1.863 -3.751
Quadratic SirfMay
(_ i .
2 1 2 )(-1.622)
^ , • o - , , - 2 -0 9 4 "4-6 5 2Cubic Birthday
^
^
(.
2.089)**
-2.727 -3.955
Quartic Birthday ^ ^
R^
(*) significant at the 10% level; (**) significant at the 5% level; (***) significant at the 1% level. 0-10 point scale: higher scores indicate the presence of behaviours associated with indirect aggression.
Table 5.5: Physical Aggression Scores Estimation Results
1 year 6 months
XT r , . w J , -1-2 8 1 -1-7 0 2Non-Parametric Model
^
^
(.
0,
324)
„ , , -0.265 -0.902
Linear Birthday ^ 2 0 ) (-0.466)
^ j ■ o - - J - ° '4 5 2 -1 0 1 9Quadratic Birthday
^
^ (-Q.536)
^ , „ , , 0-389 -0.805
Cubic Birthday ^ 8 7 ) (-0.281)
„ , , -0.403 -0.487
Quartic Birthday
(_
Q^
{_
Qm)(*) significant at the 10% level; (**) significant at the 5% level: (***) significant at the 1% level. 0-12 point scale: higher scores indicate the presence of conduct disorders and physical aggression.
Chapter 5. Results 28
Table 5.6: Prosocial Behaviour Scores Estimation Results
1 year 6 months Non-Parametric Model -12.941 -13.032 (-1.213) (-1.112) Linear Birthday 1.731 3.017 (0.526) (0.547) Quadratic Birthday 1.972 3.432 (0.620) (0.645) Cubic Birthday 2.365 2.560 (0.808) (0.458) Quartic Birthday 2.230 1.635 (0.618) (0.272) (*) significant at the 10% level; (**) significant at the 5% level; (***) significant at the 1% level.
0-20 point scale: higher scores indicate prosocial behaviour.
Table 5.7: Peabody Picture and Vocabulary Test (PPVT) Estimation Results
1 year 6 months ™ ™ ■ », j i 36.627 25.283 Non-Parametric Model (1,294) (0.175) „ , , 57.836 -17.004 Linear B i r t h d a y ( 2.699)* (-0.541) ~ , „ , , 9.100 -10.589 Quadratic Birthday ^ ^ (- Q ,2 9 9 ) « , ~. , , 11.510 -6.975 Cubic Birthday .„ ,„„,. (0.456) (-0.238) ~ ~ , , 17.194 -14.506 Quartic Birthday ^ ( Q 4 Q Q )
(*) significant at the 10% level; (**) significant at the 5% level; (***) significant at the 1% level. 160 point scale
Chapter 5. Results 29
Table 5.8: Ineffective Parenting Styles Scores Estimation Results
1 year 6 months Z ~~~ w , i -2.838 6.990 Non-Parametric Model ^ ^ ( 0.7i8 ) „ , , -1.504 -6.173 Linear Birthday ^ ^ ) (-2.028)** ~ , n , , -0-876 -5.337 Quadratic Birthday ^ ^ (-1.61Q) -1.277 -7.213 Cubic Birthday { _ ^} } (-LQ51)* „ , , -2.809 -8.547 Quartic Birthday ^ ^ ^ ^ ^ (*) significant at the 10% level; (**) significant at the 5% level; (***) significant at the 1% level.
0-25 point scale: higher score indicates hostile/ineffective parent-child interactions.
Table 5.9: Family Dysfunction Scores Estimation Results
1 year 6 months XT T. w , , 4-392 18.346 Non-Parametric Model ^ 7 ^ ( 1,6 7 7 )* „ . , , -0.411 -12.413 Linear Birthday { _ ^ } (-2.213)** -3 339 -9 922
Quadratic Birthday ^ ^ (_i,646)*
^ , . „ , , -2.882 -11.899 Cubic Birthday ^ 9 J (-1.725)*
„ , , -3.179 -11.901
Quartic Birthday ^ ^ R ^
(*) significant at the 10% level; (**) significant at the 5% level; (***) significant at the 1% level. 0-36 point scale: higher score indicates family dysfunction.
Chapter 5. Results 30
Table 5.10: Consistent Parenting Behaviour Scores Estimation Results
1 year 6 months Z, xT" • w J , 4.813 4.896 Aon-Parametnc Model . _ _ . (0.015) (0.479) Linear Birthday . , (-0.999) (-0.511) _ , . „ . a. . -0.543 -1.523 Quadratic Birthday ^ ^ (.0.372) Cubic Birthday ^ ^ n T- O- , W ° -4 4 2 ° -8 3 4 Quartic iftrtMay (Q ^ ( Q ^
(*) significant at the 10% level; (**) significant at the 5% level; (***) significant at the 1% level. 0-20 point scale: higher score indicates consisting parenting behaviour.
Table 5.11: Averse Parenting Style Scores Estimation Results
1 year 6 months XT T. • », J , 2-169 2.098 Non-Parametric Model . . , . (0.206) (0.218) „ . , , 0.736 -0.716 Linear Birthday ,n . „. (0.606) (-0.311) ^ j • D- ,L J ° -4 6 8 ° -0 5 5 Quadratic Birthday ^ ^ ( 0.0 2 7 ) _ , . „ , , 0.236 -1.002 Cubic Birthday ^ ^ (.Q.469)
*"*"*"» g ££)
(*) significant at the 10% level; (**) significant at the 5% level; (***) significant at the 1% level. 0-20 point scale: higher score indicates punitive/averse parent-child interactions.
Chapter 5. Results 31
Table 5.12: Maternal Depression Scores Estimation Results
1 year 6 months XT T. », , , -13.358 -8.880 Non-Parametric Model . n , _ . . „ „„„, (-0.806) (-0.379) ~ „ . , , -0.497 -1.463 Linear Birthday ^ ^ (-0.2 6 2 ) ^ , „ , , -1.520 0.788 Quadratic iftrf May (-Q.363) (0.117))
_ , „ . , . -2.536 -3.404 Cubic Birthday ^ ^ (-Q.5Q7)
„ , , -0.082 -2.358
Quartic Birthday {jQm) {_Qm)
(*) significant at the 10% level; (**) significant at the 5% level; (***) significant at the 1% level. 0-36 point scale: higher score indicates presence of depression symptoms.
Table 5.13: Relationship Satisfaction Scores Estimation Results
1 year 6 months 1 999 2 904 Non-Parametric Model ^ ^ ( i ^ ) ,» , , 1-278 6.614 Linear Birthday ,n r„A\ IA ™,\*** (0.574) (4.394)*** ~ \ ~ T T 1.351 6.473 Quadratic Birthday (p.642) (3.170)*** ^ , „ . , , 1.633 7.365 Cubic Birthday ^ ^ (3.672)*** „ , , 1.851 7.081 Quartic Birthday ^ ^ ^ ^
(*) significant at the 10% level; (**) significant at the 5% level; (***) significant at the 1% level. 0-11 point scale: 0 being completely dissatisfied and 11 being completely satisfied.
Chapter 6
Chapter 6. Concluding Remarks 33
With an increasing proportion of mothers with young children participating in the workforce, a high demand for childcare is present. In 1997, the government of Québec began the implementation of its current family policy which includes direct subsidies to daycare centres in order to provide every child under the age of 5 a place in daycare at a low-fee of $5 per day per child to the parents. This price was raised to $7 per day per child in 2004. The goals of the family policy are to increase mothers' labour force participation, balance the needs of the home and the workplace and to create equality of opportunity among children (Baker and al., 2008; Lefebvre and al., 2011).
The study evaluted the effects of the Québec family policy on childcare use, maternal labour supply and child and family outcomes using an RD design in order to evaluate whether the goals of the family policy are being acheived. Few studies have examined the effects of the family policy. Furthermore, no studies to our knowledge have used RD designs to evaluate the impacts of early childhood programs. Using data from the NLSCY, the RD design was implemented with various model specifications to verify the robustness of the results. Furthermore, the results were estimated using a sample of children born within a year of the eligibility treshold and a sample of children born within 6 months of the eligibility treshold.
Results show that daycare use and maternal labour supply increased for children who were eligible for subsidized childcare under the family policy relative to children who were never eligible for these subsidies. Furthermore, child and family outcomes have improved for these children. Overall, outcomes differ in relationship and/or size from previous studies. This suggests that outcomes are improving in Québec although they are not improving as rapidly as the rest of Canada according to previous studies. Long-term effects of the family policy can not yet be estimated for Québec as the first group of children eligible for low-fee spaces recently celebrated their twentieth birthdays in October 2012. Havnes and Mogstad (2011) estimate the long-term effects of a universal daycare network for Norway as this Scandanavian country has had a universal childcare system in place since the late 1970s. The authors find an increase in education and income levels for adults in their thirties who have attended these subsidized childcare facilities as children. Furthermore, the authors find a decrease in social assistance dependency and delays in marriage and childbirth for these children (Havnes and Mogstad, 2011). Future data could determine if the objectives of the family policy were fully met by evaluating the adult outcomes for children who first attended low-fee daycare. However, it must be noted that outcomes between Québec and other systems, such as Norway's, may diverge due to policy, system and social differences.
Bibliography
[1] Baker, M., Gruber, J. and Milligan, K. (2005) "Universal Childcare, Maternal Labour Supply and Family Well-Being." National Bureau of Economic Research Working Paper #11832.
[2] Baker, M., Gruber, J. and Milligan, K. (2008) "Universal Childcare, Maternal Labour Supply and Family Well-Being." The Journal of Political Economy 116(4): 709-745.
[3] Baril, R., Lefebvre, P. and Merrigan, P. (2003)"Québec Family Policy: Impact and Options." Choices Family Policy 6(1): 1-52.
[4] Blau, D. and Currie, J. (2006) "Pre-School, Day Care and After-School Care: Who's Minding the Kids?" In E.A. Hanushek and F. Welsh (Eds.) Handbook of the Economics of Education, Volume 2 (pp. 1163-1278) New York: North Holland. [5] Cameron, A. and Trivedi, P. (2005) Microeconometrics: Methods and Applications.
Cambridge, UK: Cambridge University Press.
[6] Conseil du trésor (2012) "Volume IV. Plan annuels de gestion des dépenses des ministères et organismes pour l'année financière se terminant le 31 mars, 2013." Budget de dépenses 2012-2013. Retrived from: www.tresor.gouv.qc.ca/budget-de-depenses/budget-de-depenses-2012-2013/.
[7] Currie, J. (2001) "Early Childhood Education Programs." Journal of Economie Perspectives 15(2): 213-238.
[8] Dex, S. and Walters, P. (1992) "Franco-British Comparisons of Women's Labour Supply and the Effects of Social Policies." Oxford Economic Papers 44(1): 89-112. [9] Havnes, T. and Mogstad, M. (2011) "No Child Left Behind: Subsidized Child
Care and Children's Long-Run Outcomes.'Mmencan Economic Journal: Economic Policy 3 May 2011: 97-129
[10] Imbens, G. and Lemieux, T. (2008) "Regression Discontinuity Designs: A Guide to Practice." Journal of Econometrics 142(2): 615-635.
BIBLIOGRAPHY 35
[11] Jacobsen, J.P. (2007) The Economics of Gender. Maiden, MA: Blackwell Publish-ing.
[12] Japel, C , Tremplay, R. and Côté, S. (2005) "Quality Counts! Assessing the Quality of Daycare Services Based on the Quebec Longitudinal Study of Child Develop-ment." I R P P Choices 11(5).
[13] Khandker, S., Koolwal, G. and Samad, H. (2010) Handbook on Impact Evaluation: Quantitative Methods and Practices. Washington, DC: The World Bank.
[14] Lefebvre, P. and Merrigan, P. (2002) "The Effect of Childcare and Early Education Arrangements on Developmental Outcomes of Young Children." Canadian Public Policy 28(2): 159-186.
[15] Lefebvre, P. (2004) "Quebec's Innovative Early Childhood Education and Care Policy and its Weaknesses." Policy Options March 2004: 52-57.
[16] Lefebvre, P. and Merrigan, P. (2008) "Child-care Policy and the Labour Supply of Mothers with Young Children: A Natural Experiment from Canada." Journal of Labour Economics 26(3): 519-548.
[17] Lefebvre, P., Merrigan, P. and Roy-Desrosiers, F. (2011) "Quebec's Childcare Uni-versal Low Fees Policy 10 Years After: Effects, Costs and Benefits." Centre In-teruniversitaire sur le Risque, les Politiques Économiques et l'Emploi Working Paper #11-01.
[18] Lipps, G. and Yipton-Avula, J. (1999) "From Home to School - How Canadian Children Cope." Culture Tourism and the Centre for Education Statistics Catologue No. 89F0117XIE.
[19] Ministère de l'emploi et de la solidarité sociale (2009) "Qu'est-ce que le Régime québécois d'assurance parentale?" Retrived from: http://www.rqap.gouv.qc.ca/a_propos_regime/information__generale/index.asp. [20] Ministère de la famille et des aînés (2012a) "Nombre de services de garde et
de places sous permis: État de situation au 31 octobre, 2012." Retrieved from: http://www.mfa.gouv.qc.ca/fr/publication/Documents/places_0.pdf.
[21] Ministère de la famille et des aînés (2012b) "Création des 28,000 nou-velles places." Retrieved from: http://www.mfa.gouv.qc.ca/fr/services-de-garde/nouvelles-places/creation__nouvelles places/Pages/index.aspx.
[22] Ministère de la famille de des aînés (2012c) "Profil des utilisateurs - Sit-uation en 2010." Retrived from: http://www.mfa.gouv.qc.ca/fr/services-de-garde/portrait/profil-utilisateurs/Pages/index.aspx.
BIBLIOGRAPHY 36
[23] Nelson. J. (2003) "The Childcare Economics Conundrum: Quality versus Afford-ability." In K.S. Moe (Ed.) Women, Family, and Work (pp. 124-141). Maiden, MA: Blackwell Publishing.
[24] Statistics Canada (2010) "National Longitudinal
Sur-vey on Children and Youth (NLSCY)." Retrieved from: http://www23.statcan.gc.ca:81/imdb/p2SV.pl?Function=getSurveySDDS=44501ang =endb=imdbadm=8dis=2.
[25] Waldfogel, J. (2002) "Child Care, Women's Employment, and Child Outcomes." Journal of Population Economics 15(6): 524-548.
[26] Waldfogel, J. (2003) "Work and Family Research: A Public Policy Perspective." In S.M. Bianchi, L.M, Casper and R. Berkowitz King (Eds.) Work, Family, Health and Well-Being Mahwah, NJ: Lawrence Erlbaum Associates Publishers.
[27] Woolridge, J. (2010) Econometric Analysis of Cross Section and Panel Data Cam-bridge, MA: The MIT Press.