HAL Id: inserm-00145547
https://www.hal.inserm.fr/inserm-00145547
Submitted on 15 Oct 2007HAL is a multi-disciplinary open access
archive for the deposit and dissemination of
sci-L’archive ouverte pluridisciplinaire HAL, est destinée au dépôt et à la diffusion de documents
Oestrogen signalling inhibits invasive phenotype by
repressing RelB and its target BCL2.
Xiaobo Wang, Karine Belguise, Nathalie Kersual, Kathrin Kirsch, Nora
Mineva, Florence Galtier, Dany Chalbos, Gail Sonenshein
To cite this version:
Xiaobo Wang, Karine Belguise, Nathalie Kersual, Kathrin Kirsch, Nora Mineva, et al.. Oestrogen signalling inhibits invasive phenotype by repressing RelB and its target BCL2.. Nature Cell Biology, Nature Publishing Group, 2007, 9 (4), pp.470-8. �10.1038/ncb1559�. �inserm-00145547�
Oestrogen signaling inhibits invasive phenotype by repressing RelB and its target BCL2
Xiaobo Wang1, Karine Belguise1, Nathalie Kersual3, Kathrin H. Kirsch1, Nora D. Mineva2,
Florence Galtier3, Dany Chalbos3, and Gail E. Sonenshein1,4
1 Departments of Biochemistry, and 2Pathology and Laboratory Medicine and the Women’s
Health Interdisciplinary Research Center, Boston University School of Medicine, Boston, Massachusetts 02118, USA.
3 Inserm, U540, Montpellier, F-34090 and Univ. Montpellier I, Montpellier, F-34000, France.
4 Correspondence should be addressed to G.E.S. (email: [email protected])
Aberrant constitutive expression of c-Rel, p65 and p50 NF-κB subunits has been reported
in over 90% of breast cancers1,2. Recently, we characterized a de novo RelB NF-κB subunit
synthesis pathway, induced by the cytomegalovirus (CMV) IE1 protein, in which binding of p50/p65 NF-κB and c-Jun/Fra-2 AP-1 complexes to the RELB promoter work in synergy
to potently activate transcription3. While RelB complexes were observed in mouse mammary tumors induced by either ectopic c-Rel expression4 or carcinogen exposure5, little is known about RelB in human breast disease. Here, we demonstrate constitutive de
novo RelB synthesis is selectively active in invasive estrogen receptor (ER)α negative breast
cancer cells. ERα signaling reduced levels of functional NF-κB and Fra-2 AP-1 and
inhibited de novo RelB synthesis, leading to an inverse correlation between RELB and ERα
HAL author manuscript inserm-00145547, version 1
HAL author manuscript
gene expression in human breast cancer tissues and cell lines. Induction of Bcl-2 by RelB promoted the more invasive phenotype of ERα negative cancer cells. Thus, inhibition of de
novo RelB synthesis represents a new mechanism whereby ERα controls epithelial to
mesenchymal transition (EMT).
To begin to assess the involvement of RelB in breast cancer, we selected the ZR-75,
MCF-7, and T47D ERα positive, and Hs578T and MDA-MB-231ERα negative human breast
cancer cells, and the low expresser NF639 mouse mammary tumor line. Immunoblot analysis of whole cell protein extracts (WCEs) confirmed the expected profile of ERα (Fig. 1a, upper
panel). Abundant levelsof RelB protein were seen in Hs578T and MDA-MB-231cells, while
RelB was extremely low in ZR-75, MCF-7 and T47D cells; NF639 cells had an intermediate level (Fig. 1a, upper panel). Total levels of RelB and ERα proteins were found to display an inverse relationship (Fig. 1b). The difference in RelB expression in the cell lines was even more striking when the nuclear compartment was examined (Fig. 1a and b, lower panels).
Levels of RELB mRNA were also much higher in ERα negative vs positive breast cancer cells (Fig. 1c). To test whether an inverse correlation similarly exists in primary human breast
cancers, a microarray gene expression dataset obtained from 295 patients6 and publicly available
at Oncomine.org was analyzed. The levels of RELB mRNA were significantly higher in ERα
negative vs ERα positive breast cancers (Fig. 1d) (p-value = 3.9 e-11 by Student t-test), consistent
with the cell line data. Analysis of microarray datasets from three other studies confirmed this
inverse correlation, including one7 with similar numbers of patient samples (p-value is 2.7 e-7).
Thus, RELB mRNA levels correlate inversely with ERα status in primary human breast cancers.
In de novo RelB synthesis mediated by the CMV IE1 protein, induction of binding of active c-Jun/Fra-2 AP-1 and p50/p65 NF-κB complexes to one distal AP-1 and two proximal κB elements, respectively, was shown to synergistically activate the RELB promoter in NIH 3T3 and
smooth muscle cells3; whereas, c-Jun/c-Fos AP-1 was inactive. EMSA showed that ERα
negative or low cells displayed much higher basal levels of AP-1 and NF-κB binding compared
to the ERα positive lines, as previously reported1,8 (Fig. 1e). Immunoblot analysis detected
higher nuclear levels of Fra-2, c-Jun, and Fra-1 in ERα negative or low vs ERα positive cells; whereas JunB, and to a lesser extent JunD and c-Fos, were elevated in ERα positive cells (Fig. 1f).
To test for de novo RelB synthesis, transfection analysis was performed with the RELB promoter and vectors expressing various AP-1 subunits in Hs578T cells, which display
constitutive p50/p65 NF-κB activity9. Ectopic expression of c-Jun or Fra-2 alone led to an
approximate 6- or 3-fold activation of RELB promoter, respectively (Fig. 2a), while the combination induced RELB promoter activity by ~26-fold (Fig. 2a). Similar synergy was seen in MDA-MB-231 and NF639 cells, whereas only an additive effect on RELB promoter activity was seen in the three ERα positive cells (Fig. 2b). Expression of c-Fos alone or in combination with c-Jun was unable to substantially induce RELB promoter activity. Somewhat surprisingly Fra-1,
which was moderately active in NIH 3T3 cells3, failed to induce RELB promoter activity (Fig.
2a).
To test whether the synergy seen was indeed due to the high endogenous NF-κB activity in ERα negative cells, the NF-κB inhibitory protein IκB-α was co-expressed in Hs578T and MCF-7 cells. IκB-α expression strongly blocked the synergy between c-Jun and Fra-2 in Hs578T cells, while having little effect in MCF-7 cells or on c-Jun and Fra-2 alone (Fig. 2c).
When a RELB promoter construct with mutation of the κB elements was analyzed, the co-expression of c-Jun and Fra-2 led to activation that was only additive in ERα negative cells (Fig. 2d), confirming the role of NF-κB in the observed synergy.
To test directly the roles of c-Jun and Fra-2 in MDA-MB-231 and Hs578T cells, si-JUN or si-FRA2 was used, which successfully reduced endogenous c-Jun and Fra-2 levels when added alone or in combination (Fig. 2e). Knockdown of c-Jun alone had little effect on RelB expression in MDA-MB-231, but substantially decreased RelB levels in Hs578T cells. An ~30-40% reduction in RelB levels was seen in both lines upon knockdown of Fra-2 alone. When both AP-1 subunits were reduced, an ~50-90% decrease in RelB levels occurred (Fig. 2e), confirming the role of Jun/Fra-2 heterodimers in activation of endogenous RelB. Lastly, the ability of c-Jun/Fra-2 and p50/p65 to act in synergy was tested directly using reduced suboptimal doses of each expression vector. A potent induction of the RELB promoter activity was observed in both ERα negative and positive cells (Fig. 2f). In contrast, Fra-2 and JunB, which are highly
expressed in ERα positive cells, were unable to induce RELB promoter activity (data not shown).
Thus, c-Jun/Fra-2 AP-1 and p50/p65 NF-κB complexes, which are highly expressed in ERα negative or ERα low breast cancer cells, work in synergy to induce de novo RelB synthesis.
To assess the role of ERα in de novo RelB synthesis, MCF-7 and T47D cells were treated
with the anti-estrogen ICI 182,780, which inhibits estrogen-dependent ERα function10 and
decreases ERα protein levels11 (Fig. 3a). ICI 182,780 treatment increased RelB protein and
RNA levels (Fig. 3a), and induced both NF-κB and AP-1 DNA binding and activity (Figs. 3b, 3c, Supplementary Information, Fig. S1a1-a4). Similarly, siRNA-induced knockdown of ERα substantially increased RelB levels in MCF-7 cells (Fig. 3d).
The effects of ectopic ERα expression were assessed in MDA-MB-231 and Hs578T cells in the presence of 17β-estradiol (E2). Activation of ERα signaling substantially decreased RelB protein levels in MDA-MB-231 (61.8%) and Hs578T (47.4%) cells (Fig. 3e). To test the effects of active ERα on de novo RelB synthesis, RELB promoter constructs were used in MDA-MB-231 cells. Mutation of either the κB or AP-1 site partially reduced basal promoter activity, and the double mutation resulted in an ~90% reduction, confirming the roles of the two factors in control of RELB promoter transcription. Ectopic ERα signaling resulted in strong repression of the WT RELB promoter, but only partial or no inhibition of the promoters with mutations in either the κB or AP-1 site, or with a double mutation, respectively was seen (Fig. 3f). Thus, ERα
signaling effectively represses RELB promoter activity driven by NF-κB and AP-1.
While the mechanisms mediating repression of NF-κB by ERα have been extensively
studied12, little is known about how ERα represses AP-1. We noted that ERα negative cells have
higher levels of Fra-2 compared to positive ones, which led us to hypothesize that ERα signaling represses Fra-2 expression, and thereby AP-1 activity. Consistent with this hypothesis, inhibition of ERα in MCF-7 cells led to an increase in Fra-2 levels, while c-Jun was unaffected (Fig. 3g). Conversely, ectopic ERα signaling in MDA-MB-231 or Hs578T cells decreased Fra-2 expression (Fig. 3h). Knockdown of ERα in MCF-7 cells led to an increase in Fra-2 at day 1, which preceded the increase in RelB levels that were noted after 2 days (Fig. 3i). Similarly, induction of ERα signaling in MDA-MB-231 decreased Fra-2 levels after 1 day, preceding the decrease in RelB levels detectable after day 2 (Fig. 3j). Thus, repression of Fra-2 by ERα plays a substantial role in inhibition of de novo RelB synthesis.
Highly invasive and metastatic breast cancers are frequently ERα negative13-15. To test the role of RelB in invasive phenotype, Hs578T cells with knockdown of RelB
(Hs578T/si-RELB) or control sense RelB cells (Hs578T/si-Control) were prepared (Fig. 4). Expression of
Snail, the repressor of E-cadherin gene (CDH1) transcription, was decreased in Hs578T/si-RELB cells at both the mRNA and protein level (Figs. 4a, 4b). Furthermore, levels of the epithelial markers E-cadherin and γ-catenin were increased in Hs578T/si-RELB cells (Fig. 4b). A substantial decrease in fibronectin protein expression, a mesenchymal marker, was also observed. Importantly, Hs578T/si-RELB cells displayed decreased motility (Fig. 4c), and ability to form invasive colonies in Matrigel (Fig. 4d). Thus, RelB expression is required for maintenance of mesenchymal phenotype of ERα negative Hs578T breast cancer cells.
To determine whether ectopic expression of RelB can promote a more mesenchymal phenotype in ERα positive breast cancer cells, MCF-7 were transfected with pcDNA3-RELB expression vector or parental pcDNA3 EV DNA (MCF-7/RELB and MCF-7/EV, respectively),
and several independent stable clones (MCF-7/RELB) expressing elevated RelB levels isolated
(Fig. 4e-h). RelB overexpression was sufficient to lead to a marked decrease in E-cadherin levels (Fig. 4e, and see immunofluorescence in Supplementary Information, Fig. S3). RelB also increased levels of fibronectin, and vimentin, another mesenchymal marker (Fig. 4e). Stable RelB overexpression resulted in a more than 5-fold increase in migration of MCF-7 cells (Fig. 4f), enhanced cell scattering (Fig. 4g), and increased invasion through Matrigel [1.7-fold; 0.43 ±0.08 vs 0.25 ±0.06]. RelB overexpression also led to increased colony size in Matrigel (Fig. 4h); although, it was insufficient to allow for branching colony formation. Lastly, induction of RelB led to a more invasive gene profile within 48 h (Fig. 4i), and to a 4.7-fold increase in
migration (not shown). Thus, RelB expression in ERα positive breast cancer cells decreases epithelial and increases mesenchymal characteristics.
To further monitor the oncogenic effects of RelB expression, cells were subjected to irradiation and RelB was found to greatly promote resistance to killing (X.W., K.B., H. Ying, Z.X. Xiao, G.E.S., manuscript in preparation). This led us to examine the effects of RelB on
expression of the pro-survival Bcl-2 protein, product of an NF-κB p50/RelA target gene16.
Inhibition of RelB led to a decrease in Bcl-2 protein levels in Hs578T cells, while ectopic RelB induced its expression in MCF-7 cells (Fig. 5a, upper panels). Consistently, endogenous Bcl-2 levels were higher in the ERα negative Hs578T and MDA-MB-231 lines compared to ERα positive ZR-75 and MCF-7 cells (Fig. 5b). To begin to test for transcriptional activation of the
BCL2 gene by RelB, we first confirmed that RelB levels controlled BCL2 mRNA expression
(Fig. 5a, lower panels). The BCL2 gene has a TATA-less major P1 promoter, responsible for
95% of BCL2 gene transcription, and a minor P2 promoter20. In Hs578T cells, co-transfection of
the WT BCL2 P1 reporter construct with the si-RELB vector, led to an ~5-fold decrease in its activity compared to the sense control (Fig. 5c). Furthermore, the activity of the WT BCL2 P1 promoter was potently induced upon co-transfection of vectors expressing RelB and p52 in either Hs578T cells (Fig 5d) or ZR-75 cells (see Supplementary Information, Fig. S2c). Induction of P1
promoter activity by NF-κB in B cells has been shown to be mediated indirectly via
protein-protein interaction with CREB, which is bound to a cyclic AMP response element (CRE) at bp –
1535 to –155217. When the CRE mutant and WT constructs were compared, the activity of the
mutant BCL2 construct in Hs578T cells expressing the si-control vector was significantly lower (Fig. 5c), and was unable to be substantially activated upon ectopic expression of RelB/p52 in
either Hs578T cells (Fig 5d) or ZR-75 cells (see Supplementary Information, Fig. S2c). Thus, RelB regulates BCL2 promoter activity in breast cancer cells.
Recent evidence has correlated enhanced Bcl-2 levels with progression to a metastatic
phenotype in prostate cancer18, leading us to hypothesize Bcl-2 mediates the effects of RelB.
Ectopic Bcl-2 expression in MCF-7 and ZR-75 cells substantially decreased expression of E-cadherin and γ-catenin, while levels of the upstream regulator RelB were unaffected; migration of MCF-7 cells was enhanced (Figs. 5e, 5f). We then tested the ability of ectopic Bcl-2 to reverse the effects of inhibition of RelB in Hs578T cells. Ectopic Bcl-2 decreased expression of E-cadherin and γ-catenin, and essentially restored the ability of Hs578T/si-RELB cells to migrate and to form colonies with invasive phenotype in Matrigel (Fig. 5g-i). Lastly, knockdown of Bcl-2 decreased the ability of the Hs578T cells to form invasive colonies and to migrate (Fig. 5j-k), in association with increased E-cadherin and γ-catenin (Fig. 5l). Together, the data argue that Bcl-2 is a critical mediator of invasive properties induced by RelB.
Here, we show the ability of ERα to reduce AP-1 and NF-κB binding and activity, and thereby to suppress de novo RelB synthesis, which represents a new mechanism whereby receptor signaling maintains a more epithelial phenotype. The effects on AP-1 were mediated, in large measure, via inhibition of Fra-2. Thus, transcriptional regulatory mechanisms control RelB NF-κB activation and function. While early reports of RelB function implicated this subunit in
mediating signals in the adaptive immune response19, recent studies have provided evidence for a
role of RelB in cancer. We noted that several mammary tumors in MMTV-c-Rel transgenic mice
expressed elevated nuclear levels of RelB4, and p52/RelB complexes were induced in mouse
mammary tumors following carcinogen treatment5. p50/RelB was observed in mucosa-associated
lymphoid tissue lymphomas, and these complexes inhibited apoptosis induced upon DNA
damage20. RelB was the most frequently detected NF-κB subunit in the nuclei of prostate cancer
tissue, correlated directly with Gleason score21, and played a radioprotective role in aggressive
prostate cancer cells22. In the present study, higher levels of RelB seen in ERα negative breast
cancer cell lines and human breast cancers suggest an important role for RelB in advanced breast carcinomas. Consistent with our observations, RelB was recently implicated in inflammatory
breast disease23.
Huber and coworkers reported that NF-κB activity was essential for the induction and
maintenance of EMT and metastasis of Ras-transformed epithelial breast cells by TGF-β124. We
demonstrated that elevated NF-κB activity is critical for maintenance of EMT in a c-Rel-driven
mammary tumor cell line following carcinogen treatment25. For the first time, we elucidate a
critical role of RelB in EMT in breast cancer cells, and identify Bcl-2 as an important downstream mediator. RelB/p52 complexes were shown to induce BCL2 P1 promoter activity. Protection from apoptosis by such genes as BCL2 has recently been proposed to play an
important role in promoting metastasis18. For example, ectopic expression of Bcl-2 in breast
cancer cells increased their ability to metastasize to the lung26. Our data indicate a role for Bcl-2
in negative regulation of epithelial markers. Interestingly, Bcl-2 has recently been shown to
promote the degradation of IκB-α and thereby induce NF-κB activity in cardiac myocytes27. This
suggests a feed-forward mechanism, i.e., induction of Bcl-2 further enhances NF-κB activity,
which promotes a mesenchymal phenotype. Experiments are in progress to test this model in breast cancer cells. ERα was previously shown to inhibit EMT via its control of MTA3 levels
and repression of SNAI1 gene transcription28. Our findings indicate inhibition of de novo RelB
synthesis represents an additional mechanism by which ERα can control EMT, which provides a unifying model for the observed involvement of NF-κB and AP-1 activities in EMT. Future
studies exploring the role of RelB as a biomarker or in therapeutic approaches for treatment of metastatic breast disease are warranted.
METHODS
Cell culture and treatment conditions. The NF639 cell line was derived from a mammary
gland tumorin an mammary tumor virus (MMTV)-ERBB2 transgenic mouseand cultured as
described29. ERα positive MCF-7, T47Dand ZR-75 cells, and ERα negative Hs578T and
MDA-MB-231 cellswere purchased from the American Type Culture Collection (ATCC, Manassas,
VA)and maintained in standard culturing medium as recommended by ATCC. Cultures were
stripped of endogenoussteroids by successive passages in phenol red free medium containing
10% dextran-coated charcoal (DCC)-strippedfetal bovine serum (FBS) (DCC-FBS) (2 days),
and then 3% DCC-FBS (3 days)30. MCF-7 cell lines containing pcDNA3 or pcDNA3-RELB and
Hs578T cell lines containing human pRELB-siRNA or control pRELB sense (si-Control) were
established as described5 and grown in the presence of 400 µg ml-1 G418 (Sigma, St. Louis, MO)
or 1 µg ml-1 puromycin (Sigma), respectively. MCF-7 and Hs578T/si-RELB cell lines containing
pBABE and pBABE-Bcl-2 were established by retroviral infection, as described31, and used 24 h
post infection. Hs578T cells carrying pSM2c-sh-BCL2 (V2HS_111806, Open Biosystems) or scrambled control were established by retroviral infection, as above. MCF-7 cells containing
inducible C4bsrR(TO) or C4bsrR(TO-RelB) were established as described32. Expression of RelB
was induced by treatment with 1 µg/ml doxycycline for 48 h and analyzed as described. Where indicated, cells were treated with 1 µM ICI 182,780 or equivalent volume of vehicle ethanol (Tocris Cookson, Ellisville, MO). E2 was purchased from Sigma.
Plasmids and transfection analysis. The human 1.7 kB RELB promoter driving a luciferase
reporter in pGL3 basic vector (p1.7 RELB promoter-Luc) and the pcDNA3-RELB construct containing human RELB cDNA sequence in the pcDNA3 expression vector were as described
previously3. The pC4bsrR(TO-RelB) construct was generated by subcloning the Relb cDNA into
the Eco RI restriction site of the doxycycline inducible pC4bsrR(TO) retroviral vector. The p1.7
RELB promoter-Luc vectors containing either wild type (WT), or mutant NF-κB (κB-Mut), or
AP-1 (AP1-Mut) elements alone or with the double mutation (DM) were as prepared previously3.
The thymidine kinase promoter-driven luciferase reporterplasmid controlled by six reiterated κB
sites, was kindly provided by G. Rawadi (Hoechst-Marion-Roussel, Romainville, France). The thymidine kinase promoter-driven chloramphenicol acetyl transferase (CAT) plasmid controlled
by five copies of the TPA responsive elements (TRE), was as described previously3. The NF-κB
p50 or p65 constructs in pMT2T expression vector were as reported3. The IκB-α construct
containing IκB-α SS32/36AA mutant in pRC-β-actin expression vector, was as reported5. The
c-Jun, c-Fos, Fra-1, and Fra-2 AP-1 family member constructs in the pCI expression vector were as
reported3. pRELB sense and pRELB-siRNA containing control or si-RELB oligonucleotides in
pSIREN-RetroQ vector, were described previously33. The human full-length BCL2 constructs in
pcDNA3 or pBabe were as reported34. The SV40 β-galactosidase (β-gal)reporter vector was as
reported3. For transfection into six well and P100 plates, 3 or 10 µg total DNA was transfected,
respectively. For transient transfection, cultures were incubated for 48 h in the presence of DNA and Fugene6 (Roche Diagnostics Co., Indianapolis, IN) or Geneporter2 (Gene Therapy System Inc., San Diego, CA) Transfection Reagent. All transient transfections were performed a minimum of three times, in triplicate. For stable transfection, cells were incubated for 48 h with
DNA and GenePorter2 before adding 10 µg ml-1 blasticidin, 400 µg ml-1 G418, or 1 µg ml-1
puromycin, as appropriate, for stable selection. CAT and luciferase assays were performed as
described2,4. Co-transfection of the SV40-β-gal expression vector was used to normalize for
transfection efficiency, as described4. Sequences of FRA2, JUN, and GFP siRNA duplexes have
been previously described35. For the RelB repression studies, the ERα siRNA duplex
(Dharmacon, Chicago, IL) targeted the following sequence: AAGATCCTGAAACAGAGCATG (sense strand). Transfections (100 nM final) were carried out using Oligofectamine (Invitrogen, Carlsbad, CA), in Optimem serum-free medium, 24 h after plating. When multiple transfections were performed, cells were re-plated 48 h after transfection (dilution 1:2). For kinetics studies,
cell extracts were processed for immunoblotting 48 h after the last transfection. ERα validated
Stealth™ RNAi and Stealth RNAi negative controls from Invitrogen were used. Duplexes (0.9 nM final) were introduced in cells using Lipofectamine RNAiMAX reagent (Invitrogen) by reverse transfection according to the manufacturer’s protocol. Similar results were obtained with the 2 different ERα duplexes. The BCL2 P1 promoter constructs with WT or mutant CRE sites
were as described17.
Immunoblot analysis, antibodies, and immmunofluorescence. WCEs (total protein extracts)
were prepared in RIPA buffer (10 mM Tris [pH 7.5], 150 mM NaCl, 10 mM EDTA, 1% NP-40,
0.1% SDS, 1% sodium sarcosyl, 0.2 mM phenylmethylsulfonylfluoride, 10 µg ml-1 leupeptin, 1
mM dithiothreitol). Nuclear extracts were prepared as previously described29. Immunoblotting
was performed as we have described29. Antibodies against NF-κB members: p65 (sc-372) and
RelB (sc-226), or AP-1 members: JunB (sc-46), JunD (sc-74), c-Fos (sc-7202), Fra-1 (sc-183), Fra-2 (sc-604), Bcl-2 (sc-492), or against Snail (Snai1, sc-10432) or Lamin B (sc-6217), were purchased from Santa Cruz Biotechnology (Santa Cruz, CA). Antibodies against c-Jun and ERα
were purchased from Cell Signaling (Danvers, MA) and NeoMarker (Fremont, CA), respectively. The E-cadherin, fibronectin, and γ-catenin antibodies were purchased from BD Transduction Lab (Franklin Lakes, NJ), and the β-actin (AC-15) and cyclin D1 (Ab-3) antibodies were from Sigma and Oncogene (Boston, MA), respectively. Immunofluorescence was
performed as we have published previously25.
EMSA. Nuclear extracts were prepared and samples (5 µg) subjected to binding and EMSA as
described2. The sequences of the oligonucleotide containing the consensus AP-1 element and
NF-κBelement upstream of the c-Myc promoter are as follows:
AP-1, 5'-GATCCGCTTGATGACTCAGCCGGAAG-3';
NF-κB, 5'-GATCCAAGTCCGGGTTTTCCCCAACC-3'. The Oct-1 sequence is as reported
previously2.
RT-PCR and Northern blot analysis. RNA, isolated using Trizol reagent (Invitrogen), was
quantified by measuring A260. A260:A280 ratios were between 1.8 and 2. RNA samples were treated with RQ1 RNase-free DNase (Promega Corporation, Madison WI). For reverse transcriptase (RT)-PCR, 1 µg RNA was reverse transcribed with Superscript RNase H-RT in the presence of 100 ng of random primers (Invitrogen). PCR for SNAI1 was performed in a Thermal Cycler for 20 cycles as follows: 94°C for 30 sec, 55°C for 30 sec and 72°C for 30 sec, and for
BCL2 for 30 cycles as follows: 94°C for 30 sec, 60°C for 30 sec and 72°C for 45 sec. The
primers specific for human SNAI1 are as follows: sense (5’-GAAAGGCCTTCAACTGCAAA-3’) and antisense (5’-TGACATCTGAGTGGGTCTGG-3’. The primers specific for human BCL2 are: sense CATTTCCACGTCAACAGAATTG-3’) and antisense
AGCACAGGATTGGATATTCCAT-3’). As a loading control, PCR for GAPDH was performed in a Thermal Cycler for 15 cycles: 94°C for 30 sec, 55°C for 30 sec and 72°C for 30 sec. RNA
samples (20 µg) were subjected to Northern blot analysis,as described3. The 2.1-kb Eco RI
inserts of thehuman RELB or mouse Relb cDNA expression vectors were used as probes.
Matrigel outgrowth assays. Cells (2×10⁴) were suspended at 4°C in Matrigel (0.2 ml, 6.3 mg
ml-1) (BD Biosciences, Bedford, MA), an extracellular matrix extracted from
Engelbreth-Holm-Swarm mouse tumors, and added to a pre-set Matrigel layer in 24-well plates as described25. The
top Matrigel cell layers were covered with culture medium containing 10% FBS.
Migration and invasion assays. Suspensions of 1 to 2.5×10⁵ MCF-7 or Hs578T cells were layered, in triplicate, in the upper compartments of a Transwell (Costar, Cambridge, MA) on an 8-mm diameter polycarbonate filter (8 µm pore size), and incubated at 37°C for the indicated times. All migration assays were performed two to three times, in triplicate. For invasion assays, filters were precoated with 60 µg of Matrigel. Migration of the cells to the lower side of the filter was evaluated with the acid phosphatase enzymatic assay using p-nitrophenyl phosphate and OD410nm determination. The mean ± SD are presented. All invasion assays were performed two times, in triplicate.
Gene expression and statistical analysis. The Van de Vijver_Breast carcinoma microarray
dataset (reporter number NM_0065096) was accessed using the ONCOMINETM Cancer Profiling
Database (www.oncomine.org). The dataset includes 69 ER negative and 226 ER positive human primary breast carcinoma samples. Box plots, depicting the distribution of RELB expression
within each ERα group and a Student t-test giving a p-value for the comparison of RELB
expression between the two ERα groups were obtained directly through the Oncomine 3.0
software. The line within the box represents the median expression value for each group, and the
upper and lower edges of the box indicate the 75th and 25th percentile of the distribution,
respectively. The lines (whiskers) emerging from each box extend to the smallest and largest observations; the black dots outside the ends of the whiskers are outlier data points.
ACKNOWLEDGEMENTS
We thank Finn-Eirik Johansen, Carlos V. Paya, Stanley Korsmeyer, and Linda M. Boxer for cloned DNAs, T. Akagi for the inducible retroviral vector, and P. Leder for the NF639 cell line. These studies were supported by NIH grants ES11624 and CA36355.
REFERENCES
1. Nakshatri, H., Bhat-Nakshatri, P., Martin, D. A., Goulet, R. J., Jr. & Sledge, G. W., Jr.
Constitutive activation of NF-kappaB during progression of breast cancer to hormone-independent growth. Mol Cell Biol 17, 3629-39 (1997).
2. Sovak, M. A. et al. Aberrant nuclear factor-kappaB/Rel expression and the pathogenesis
of breast cancer. J Clin Invest 100, 2952-60 (1997).
3. Wang, X. & Sonenshein, G. E. Induction of the RelB NF-kappaB subunit by the
cytomegalovirus IE1 protein is mediated via Jun kinase and c-Jun/Fra-2 AP-1 complexes.
J Virol 79, 95-105 (2005).
4. Romieu-Mourez, R. et al. Mouse mammary tumor virus c-rel transgenic mice develop
mammary tumors. Mol Cell Biol 23, 5738-54 (2003).
5. Demicco, E. G. et al. RelB/p52 NF-kappaB complexes rescue an early delay in mammary
gland development in transgenic mice with targeted superrepressor IkappaB-alpha expression and promote carcinogenesis of the mammary gland. Mol Cell Biol 25, 10136-47 (2005).
6. van de Vijver, M. J. et al. A gene-expression signature as a predictor of survival in breast
cancer. N Engl J Med 347, 1999-2009 (2002).
7. Wang, Y. et al. Gene-expression profiles to predict distant metastasis of
lymph-node-negative primary breast cancer. Lancet 365, 671-9 (2005).
8. Philips, A. et al. FRA-1 expression level modulates regulation of activator protein-1
activity by estradiol in breast cancer cells. Mol Endocrinol 12, 973-85 (1998).
9. Romieu-Mourez, R. et al. Roles of IKK kinases and protein kinase CK2 in activation of
nuclear factor-kappaB in breast cancer. Cancer Res 61, 3810-8 (2001).
10. Hyder, S. M., Chiappetta, C., Murthy, L. & Stancel, G. M. Selective inhibition of
estrogen-regulated gene expression in vivo by the pure antiestrogen ICI 182,780. Cancer
Res 57, 2547-9 (1997).
11. Oliveira, C. A. et al. The antiestrogen ICI 182,780 decreases the expression of estrogen
receptor-alpha but has no effect on estrogen receptor-beta and androgen receptor in rat efferent ductules. Reprod Biol Endocrinol 1, 75 (2003).
12. Kalaitzidis, D. & Gilmore, T. D. Transcription factor cross-talk: the estrogen receptor and
NF-kappaB. Trends Endocrinol Metab 16, 46-52 (2005).
13. Horwitz, K. B. Mechanisms of hormone resistance in breast cancer. Breast Cancer Res
Treat 26, 119-30 (1993).
14. Johnston, S. R. et al. Changes in estrogen receptor, progesterone receptor, and pS2
expression in tamoxifen-resistant human breast cancer. Cancer Res 55, 3331-8 (1995).
15. Rochefort, H. et al. Estrogen receptor mediated inhibition of cancer cell invasion and
motility: an overview. J Steroid Biochem Mol Biol 65, 163-8 (1998).
16. Catz, S. D. & Johnson, J. L. Transcriptional regulation of bcl-2 by nuclear factor kappa B
and its significance in prostate cancer. Oncogene 20, 7342-51 (2001).
17. Xiang, H., Wang, J. & Boxer, L. M. Role of the Cyclic AMP Response Element in the
bcl-2 Promoter in the Regulation of Endogenous Bcl-2 Expression and Apoptosis in Murine B Cells. Mol Cell Biol 26, 8599-606 (2006).
18. Mehlen, P. & Puisieux, A. Metastasis: a question of life or death. Nat Rev Cancer 6,
449-58 (2006).
19. Burkly, L. et al. Expression of relB is required for the development of thymic medulla
and dendritic cells. Nature 373, 531-6 (1995).
20. Stoffel, A., Chaurushiya, M., Singh, B. & Levine, A. J. Activation of NF-kappaB and inhibition of p53-mediated apoptosis by API2/mucosa-associated lymphoid tissue 1 fusions promote oncogenesis. Proc Natl Acad Sci U S A 101, 9079-84 (2004).
21. Lessard, L., Begin, L. R., Gleave, M. E., Mes-Masson, A. M. & Saad, F. Nuclear
localisation of nuclear factor-kappaB transcription factors in prostate cancer: an immunohistochemical study. Br J Cancer 93, 1019-23 (2005).
22. Josson, S. et al. RelB regulates manganese superoxide dismutase gene and resistance to
ionizing radiation of prostate cancer cells. Oncogene (2005).
23. Van Laere, S. J. et al. Nuclear factor-kappaB signature of inflammatory breast cancer by
cDNA microarray validated by quantitative real-time reverse transcription-PCR, immunohistochemistry, and nuclear factor-kappaB DNA-binding. Clin Cancer Res 12, 3249-56 (2006).
24. Huber, M. A. et al. NF-kappaB is essential for epithelial-mesenchymal transition and
metastasis in a model of breast cancer progression. J Clin Invest 114, 569-81 (2004).
25. Shin, S. R., Sanchez-Velar, N., Sherr, D. H. & Sonenshein, G. E.
7,12-dimethylbenz(a)anthracene treatment of a c-rel mouse mammary tumor cell line induces epithelial to mesenchymal transition via activation of nuclear factor-kappaB. Cancer Res
66, 2570-5 (2006).
26. Schmitt, C. A. et al. Dissecting p53 tumor suppressor functions in vivo. Cancer Cell 1,
289-98 (2002).
27. de Moissac, D., Mustapha, S., Greenberg, A. H. & Kirshenbaum, L. A. Bcl-2 activates
the transcription factor NFkappaB through the degradation of the cytoplasmic inhibitor IkappaBalpha. J Biol Chem 273, 23946-51 (1998).
28. Fujita, N. et al. MTA3, a Mi-2/NuRD complex subunit, regulates an invasive growth
pathway in breast cancer. Cell 113, 207-19 (2003).
29. Guo, S. & Sonenshein, G. E. Forkhead box transcription factor FOXO3a regulates
estrogen receptor alpha expression and is repressed by the Her-2/neu/phosphatidylinositol 3-kinase/Akt signaling pathway. Mol Cell Biol 24, 8681-90 (2004).
30. Philips, A., Chalbos, D. & Rochefort, H. Estradiol increases and anti-estrogens
antagonize the growth factor-induced activator protein-1 activity in MCF7 breast cancer cells without affecting c-fos and c-jun synthesis. J Biol Chem 268, 14103-8 (1993).
31. Romieu-Mourez, R., Landesman-Bollag, E., Seldin, D. C. & Sonenshein, G. E. Protein
kinase CK2 promotes aberrant activation of nuclear factor-kappaB, transformed phenotype, and survival of breast cancer cells. Cancer Res 62, 6770-8 (2002).
32. Min, C. et al. The tumor suppressor activity of the lysyl oxidase pro-peptide reverses
invasive phenotype of Her-2/neu driven breast cancer. Cancer Res In press (2007).
33. Schjerven, H., Tran, T. N., Brandtzaeg, P. & Johansen, F. E. De novo synthesized RelB
mediates TNF-induced up-regulation of the human polymeric Ig receptor. J Immunol
173, 1849-57 (2004).
34. Sentman, C. L., Shutter, J. R., Hockenbery, D., Kanagawa, O. & Korsmeyer, S. J. bcl-2
inhibits multiple forms of apoptosis but not negative selection in thymocytes. Cell 67, 879-88 (1991).
35. Freund, A. et al. Mechanisms underlying differential expression of interleukin-8 in breast
cancer cells. Oncogene 23, 6105-14 (2004).
FIGURE LEGENDS
Figure 1. RelB levels are inversely correlated with ERα status in breast cancer cells. (a) Upper panel. WCEs (25 µg) from the indicated breast cancer cells were analyzed by immunoblotting with antibodies against ERα, RelB, and β-actin, which confirmed equal loading.
Lower panel. Nuclear extracts (25 µg) from the indicated breast cancer cells were analyzed by
immunoblotting for ERα, RelB and Lamin B. MB-231, MDA-MB-231. (b) The blots for the human cell lines in (a) were scanned and the values for ERα and RelB normalized to β-actin (upper panel) or to Lamin B (lower panel) plotted as a percent of the values in ZR-75 and MDA-MB-231 cells, respectively (set at 100%), showing an inverse relationship between these two
proteins. (c) Samples of mRNA (20 µg) were subjected to Northern blot analysis using either
human RELB (h) or mouse Relb (m) cDNA, as probe, as they only weakly hybridize across species. Ethidium bromide staining confirmed equal loading. In RT-PCR analysis, RELB mRNA levels in ZR-75, MCF-7, T47D, and Hs578T cells were 3.9%, 16.0%, 19.2%, and 57.2% of those seen in MDA-MB-231 cells (not shown). (d) Box plots of data from the Van de
Vijver_Breast carcinoma microarray dataset (reporter number NM_0065096) was accessed using
the ONCOMINETM Cancer Profiling Database (www.oncomine.org) and is plotted on a log
scale. The dataset includes 69 ERα negative and 226 ERα positive human primary breast
carcinoma samples. A Student t-test, performed directly through the Oncomine 3.0 software, showed the difference in RELB expression between the two groups was significant (p-value = 3.9
e-11). (e) Nuclear extracts (5 µg) were subjected to EMSA binding of AP-1, NF-κB, or Oct-1,
which confirmed equal loading. The positions of the previously identified p50/p50 and p50/p65
NF-κB complexes in Hs578T cells9 are as indicated. (f) Nuclear extracts (25 µg) were analyzed
for Fra-2, c-Jun, Fra-1, c-Fos, JunB, JunD, or β-actin. Uncropped scans of the top two panels in a and e are shown in the Supplementary Information, Fig. S5a and S5b, respectively.
Figure 2. c-Jun/Fra-2 AP-1 and p50/p65 NF-κB complexes synergistically induce RELB
promoter activity in ERα negative breast cancer cells. (a) Hs578T cells were transiently
transfected, in triplicate, with 0.5 µg p1.7 RELB promoter-Luc vector, 0.5 µg of the indicated AP-1 subunit expression vector, 0.5 µg SV40-β-gal and empty vector (EV) pcDNA3 to make a total of 3.0 µg DNA. Post-transfection (48 h), luciferase and β-gal activities were determined and normalized luciferase activities presented (mean ± S.D. from three separate experiments). (b) The indicated breast cancer cell lines were transiently transfected with 1.0 µg p1.7 RELB promoter-Luc vector, 0.5 µg c-Jun and Fra-2 AP-1 subunit expression vector, 0.5 µg SV40-β-gal and EV DNA to a 3.0 µg DNA total, and analyzed as in (a). (c) Hs578T or MCF-7 cells were transiently transfected with 0.5 µg p1.7 RELB promoter-Luc DNA, 0.5 µg of the indicated AP-1 subunit expression vector, in the absence or presence of 0.5 µg IκB-α vector DNA, 0.5 µg SV40-β-gal and EV DNA to a 3.0 µg DNA total, and processed as above. (d) Hs578T cells were transiently transfected with 0.5 µg of WT or κB-mutant p1.7 RELB promoter-Luc vector, AP-1 subunit, SV40-β-gal and EV DNA and analyzed as in (a). (e) MDA-MB-231 or Hs578T cells were transfected with siRNA directed against JUN or FRA2, or against both genes. All duplexes were used at a concentration of 100 nM and 100 nM GFP siRNA was added when only one gene was targeted. Post-transfection (48 h), WCEs were analyzed by immunoblotting for RelB, c-Jun, Fra-2, and β-actin. (Please note loading for si-JUN and si-FRA2 was reversed in the two blots.) The blots were scanned and the values for RelB, c-Jun, and Fra-2 normalized to β-actin. Values
relative to the control siRNA (set at 100%) are given below each lane, showing their corresponding levels of decrease. (f) The indicated breast cancer cell lines were transiently transfected with 0.5 µg p1.7 RELB promoter-Luc vector, 0.25 µg of the indicated AP-1 or NF-κB subunit expression vectors, 0.5 µg SV40-β-gal and EV DNA to a 3.0 µg DNA total, and analyzed as in (a).
Figure 3. ERα represses NF-κB and AP-1 activities and reduces RelB levels. (a-b) MCF-7 cells were treated with 1 µM ICI 182,780 (ICI) or vehicle ethanol (Eth) for 48 h. (a) WCEs (25 µg) were analyzed by immunoblotting (left panel). RNA was subjected to Northern blotting and ethidium bromide staining (right panel). (b) Nuclear extracts were subjected to EMSA, as in Fig. 1e. (c) MCF-7 cells were transiently transfected, in triplicate, with 0.5 µg NF-κB (κB-Luc) or AP-1 (TRE-CAT) element driven constructs and 0.5 µg SV40-β-gal. Post-transfection (6 h), cells were treated with ICI 182,780 or ethanol for 40 h. Normalized values are presented as the mean ± S.D. from three experiments (control set to 1). (d) MCF-7 cells were transfected with
si-ERα or GFP control siRNA. After 3 successive 48 h transfections, WCEs were analyzed by
immunoblotting. (e) Cells, growing in medium depleted of steroids, were transfected with 10 µg ERα expression vector or EV DNA for 6 h and then treated for 40 h with 10 nM E2. WCEs were analyzed by immunoblotting. (f) Cells in steroid-free medium were transfected, in triplicate, with 0.5 µg of the indicated p1.7 RELB promoter-Luc vector, 1 µg ERα expression vector or EV pcDNA3, 0.5 µg SV40-β-gal, and EV DNA (3.0 µg total). After 6 h, cells were treated for 40 h with 10 nM E2. Normalized data are presented relative to the WT reporter with EV DNA (mean ± S.D from three experiments). (g) WCEs from MCF-7 cells, treated as in part a, were analyzed by immunoblotting. (h) MDA-MB-231 and Hs578T cells, transfected with an
ERα expression or EV DNA, were processed as in part e. (i) MCF-7 cells, transfected with
si-ERα or control siRNA, were lysed after 1, 2 or 4 days and WCEs analysed. Values for RelB and
Fra-2 normalized to β-actin relative to control (set at 100%) are presented below. (j) Stable MDA-MB-231 cells expressing ERα, cultivated in medium depleted of steroids, were treated with 10 nM E2 as indicated. Values for RelB and Fra-2 normalized to β-actin in WCEs, relative to control, are given.
Figure 4. RelB expression promotes mesenchymal phenotype of breast cancer cells. (a-d)
Stable Hs578T transfectants expressing either siRNA RELB (Hs578T/si-RELB) or sense RELB (Hs578T/si-Control) (si-Con) were prepared. Expression of si-RELB decreased levels of RELB mRNA and RelB protein in the nucleus, but had no effect on levels of the p65 NF-κB subunit (see Supplementary Information, Figs. S1b1 and S1b2), consistent with findings of Johansen and
coworkers33. (a) RNA was analyzed by RT-PCR for levels of SNAI1 and GAPDH RNA, as a
control for equal loading. (b) WCEs (50 µg) were analyzed by immunoblotting for E-cadherin, γ-catenin, Snail, fibronectin (FN), and β-actin. The effects of si-RELB on MDA-MB-231 cells were tested and similar data were obtained (see Supplementary Information, Fig. S1c). (c) Cells were subjected, in triplicate, to a migration assay for 4 h. Cells that migrated to the lower side of the filter quantified by spectrometric determination at OD410nm (mean ± S.D). Data presented are from one representative of 3 experiments. (d) Cells were subjected to Matrigel outgrowth analysis. After 5 days, the colonies were photographed (50x magnification). (e-h) Stable MCF-7 clones expressing either RELB or EV DNA were isolated: RELB(1), RELB(2), EV(1), and EV(2). Ectopic RelB expression increased NF-κB reporter activity, and levels of cyclin D1, but failed to alter the levels of p65 (see Supplementary Information, Figs. S2a and S2b). (e) WCEs
were subjected to immunoblot analysis for E-cadherin (E-cad), fibronectin (FN), vimentin (Viment), and β-actin. While all of the clones showed an increase in fibronectin, the extent of the increase varied. (f) Clones were subjected to a migration assay, as in part (c) (mean ± S.D from
three separate experiments). (g) MCF-7 stable clones (1×10⁴ cells ml-1) were plated and after 2
days photographed (50x magnification). (h) Clones were subjected to Matrigel outgrowth analysis. After 15 days of growth, the colonies were photographed (50x magnification). (i) Stable MCF-7 cells with an inducible RelB expression vector were treated with 1 µg/ml doxycyline. After 48 h, WCEs were subjected to immunoblot analysis for RelB, E-cadherin (E-cad), vimentin
and β-actin, as above. Scale bar, 100 µm in parts d, g, and h. An uncropped scan of the
E-cadherin panel in i is shown in the Supplementary Information, Fig. S5c.
Figure 5. Bcl-2 mediates control of invasive properties of breast cancer cells. (a) WCEs (25
µg) and RNA were prepared from Hs578T/si-RELB or Hs578T/si-Control and from MCF-7 cells expressing RELB (clone 1) or with EV DNA, and analyzed by immunoblotting (Upper panels), and RT-PCR (Lower panels). Similar data were obtained with other MCF-7 clones expressing RELB (not shown). (b) ZR-75, MCF-7, Hs578T and MDA-MB-231 WCEs (25 µg) were analyzed for Bcl-2 and β-actin. (c) Hs578T cells were transiently transfected with 0.5 µg WT or CRE-Mutant BCL2 P1 promoter-Luc vector, 1.0 µg of the siRNA RELB expression or control sense vector (si-Con), 0.5 µg SV40-β-gal and EV pcDNA3 (3.0 µg DNA total) for 48 h. Normalized luciferase activities are presented (mean ± S.D. from three separate experiments). (d) Hs578T cells were transiently transfected, in triplicate, with 1.0 µg WT or CRE-Mutant
BCL2 P1 promoter-Luc vector, the indicated dose of p52 and RelB expression vectors, 0.5 µg SV40-β-gal and EV pcDNA3 (3.5 µg DNA total), and analyzed as in (c). (e) WCEs (25 µg) were
prepared from MCF-7 and ZR-75 cells, ectopically expressing EV or full length Bcl-2, and analyzed for EMT gene expression, Bcl-2, and RelB, as above. Ectopic Bcl-2 also resulted in a substantial decrease in E-cadherin staining in MCF-7 cells (see Supplementary Information, Fig. S4) (f) Stable mixed populations of MCF-7 cells expressing Bcl-2 or EV DNA were subjected to a migration assay for 24 h, as in Fig 4c. (g) WCEs (50 µg) were prepared from Hs578T/si-RELB cells, ectopically expressing full length Bcl-2, and analyzed, as above. (h-i) Hs578T/si-RELB cells were transiently infected with pBABE-Bcl-2 or EV pBABE DNA. After 24 h, cells were subjected to a migration assay for 4 h (h), or Matrigel colony formation assay for 12 days (i).
(j-l) Hs578T cells were infected with pSM2c-sh-BCL2 or scrambled control (Contro(j-l). (j) Cells
were subjected to Matrigel assay in the presence of 2 µg/ml puromycin. (k) Stable mixed populations, isolated using puromycin selection, were subjected to a migration assay for 4 h. (l) WCEs (25 µg) were assessed by immunoblotting. Scale bar, 100 µm in parts i and j.
ZR -75 MC F-7 T4 7D NF 639 MB -23 1 Hs 578 T RELB Relb 28S 18S h m MB -23 1 ZR -75 MC F-7 T4 7D NF 639 Hs 57 Total ER α β-actin Total Re lB 8T
a
c
Nuc . ER α Nuc . R el B Lamin B ZR -75 MC F-7 T4 7D NF 639 MB -23 1 578 Hs Te
AP-1 Oc t-1 NF-κB p 50/p 50 p 50/p 65b
Norm. RELB expressio n u nits (lo g) 3. 5 3. 0 2. 5 2. 0 1. 5 1. 0 0. 5 0. 0 -0 .5 -1 .0 -1 .5 -2 .0 -2 .5 -3 .0 -3 .5 -4 .0 ER α neg ativ e ER α positiv e.
.
.
.
d
ERα/β -actin (% 0 20 40 60 80 0 20 40 60 80 100 RelB/ β-actin ( %) MC F-7 Hs 578 T MB -23 1 ZR -75 T4 7D Tot al 0 20 40 60 80 100 0 20 40 60 80 100 RelB/Lamin B( %) ERα/Lamin B( %) Nu cl ea r ZR -75 MC F-7 T4 7D NF 639 MB -2 Hs 578 T 31f
) 100 Fr a-2 c-Jun Fr a-1 c-Fo sJunB JunD β-actin
l
a
b
ER α po sitiv e ZR-7 5 M CF-7 T4 7D MB -231 H s578T N F 639 0 3 6 9 12 1518y vit rase acti lucife
ER α ne ga ti ve /lo w EV c-Jun Fra-2 c-Jun+Fr a-2 35 20 15 10 5 0 lucife rase act iv c-Jun c-Fo s Fr a-1 Fr a-2 − − − + + −− − − −− − − − + + + + − − − − − − + + − − H s578T ity 30 25 − − + +
d
c
0 5 10 15 20 25 30 35 lucife rase act ivi ty EV IκB α c-Jun +Fr a-2 WT κB-Mut EV c-Jun Fra-2 c-Jun+Fr a-2 H s578T 0 5 10 15 20 25 EV lucife rase act 40 35 30 vit c-Jun F ra -2 c-Jun +Fr a-2 i y H s578T EV MCF-7 c-Jun F ra -2e
Re lB c-Jun si-Co ntr ol JU si-N si-FR A2 si-JU N+ FR A2 % R el B : 100 96.7 69.5 48 10 0 59 28 13 si-Co ntr ol si-JU N si-FR A2 si-JU N+ FR A2 % c-Ju n :100 19.6 92.3 19.8 10 0 86 31 27 Fr a-2 % F ra -2 : 100 105.2 37.8 42.8 10 0 29 98 33 β-actin MDA-MB-23 1 H s578Tf
0 5 10 15 20 25 30 35 40 45 MB -231 H s578T lucife rase acti vit y EV p5 0:p 6 5 c-Jun:Fr a-2 p 5 0: p65 + c-Jun:Fr a-2 MCF-7 Z R-75 ER α po sitiv e ER α ne ga ti ve Fig. 2e-f, Wa ng et.alc
e
g
ICI Eth Eth ICI 0 0. 5 1 1. 5 2 2. 5 3 Eth ICI reporter acti vit y TRE-CAT κB-Luc MCF-7 RELB ICI Eth EV ER α EV ER α ER α Re lB Re lB Fr a-2 28S 18S MCF-7 ER α ER α β-actin β-actin c-Jun MCF-7 MB -231 H s578T MCF-7 ICI Ethh
Oc t-1 MCF-7 AP-1 κBd
Re β-actin lB ER α si-Co nt i-E Rα rol sf
0 20 40 60 80 100 120 WT AP 1-Mut κB-Mut D M rela t. luc iferase act ivit y ( %) EV ER α MDA-MB-23 1 ER α ER α EV EV ER α Fr a-2 β-actin c-Jun MB -231 H s578T MCF-7Re lB Fr a-2 β-actin ER α si-ER α si-Con
ij
Ve h. E2 Re lB 108 % R el B : 100 100 53 59 % R el B : 100 141 174 Fr a-2 % Fra-2: 196 258 % Fra-2: 45 47 100 161 100 50 Time after tr an sfe ct ion β-actin Day s: 44 1 2 Day s: Dur ation of E 2 tr ea tm ent 33 1 2 MDA-MB-23 1 ER α ex ti nc tio n = 90 % MCF-7si-Co n si-RE LB
f
h
Migra tin g ce lls (O D 410 n m) 0 0. 2 0. 4 0. 6 0. 8 1. 0 EV (1 ) LB RE (1 ) EV (2 ) LB RE (2 ) si-Control si-RELBd
EV (2) EV (1) MCF-7 1. 6 1. 4 1 1. 2 H s578T RELB ( 1) RELB ( 2) 0 0. 1 0. 2 0. 3 0. 4 0. 5 0. 6 0. 7 0. 8 si-Con si-RELB (O D410nm) H s578T H s578TFig. 4, Wang et.a
l ti n FN si-Co n i-R EL s B MCF-7
i
H s578T MCF-7-RelB MCF-7-Con Dox: −− ++g
EVE-cad Vim β-actin
ent FN EV (2 ) RE LB ( V ( 1) RE LB (1 ) 2)
e
Re lB E-cad E Vim ent RELB β-actin MCF-7 MCF-7WT si -C o n si -RELB 0 20 40 60 80 100
120 (% vity acti erase e lucif tiv rela
d
0 1 2 3 4 5 6 7 8 9 10 Re lB: 0 0 p5 2: 0 0. 5 rela tiv e lucif erase acti vity P1 ( W T ) P 1 (CRE-Mut) H s578T ZR -75 MC F-7 Hs 578 T MB -23 1 MC F-7 Hs 578T Bcl-2 β-act in Rel B BCL 2 GAPDH )e
g
c
si-RELB EV B cl-2 E V B cl-2 EV RELB EV B cl-2 H s578T E-cad E-cad γ-caten γ-caten CRE-Mutf
0 0.1 0.2 0.3 0.4 0.5 0.6 0.7 EV B cl-2 mig rati ng cells (O D410n m) MC F-7 0 0. 5 1. 0 1. 0 0. 5 1. 0 β-act in Rel B Bcl-2 Bcl-2 β-act in Hs 578T/si-RELB MCF-7 Z R-75Fig. 5a-g, Wang et al.
i
Hs 578T si-REL B + Bcl-2 Hs 578T si-REL B + EV 0 0. 1 0. 2 0. 3 0. 4 0. 5 Control migrating c ells (O D410nm) 0 0.1 0.2 0.3 0.4 0.5 0.6 0.7 EV Bcl-2 migrating c ells (O D410n m) H s578T/s i-RELBh
l
k
H s578T sh-BCL2 Con sh-BCL 2 Bc l-2j
E-cad Hs 578T Control Hs 578T sh-BCL2 γ-caten β-actin Hs578TSupplementary Data
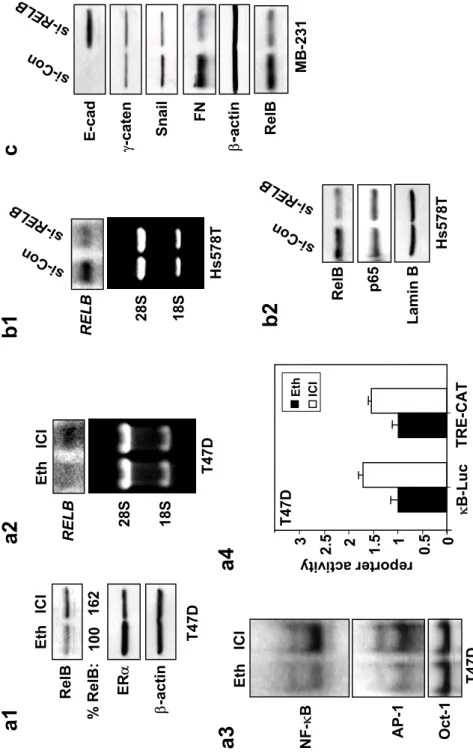
Figure S1 ERα represses de novo synthesis of RelB. (a1) T47D cells were treated with 1 µM ICI 182,780 (ICI) or equivalent volume of vehicle ethanol (Eth) for 48 h and WCEs (25 µg) analyzed by immunoblotting for RelB, ERα, and β-actin. RelB levels normalized to β-actin in cells treated with ICI 182,780 are presented relative to cells treated with control ethanol. (a2) T47D cells were treated as above and mRNA (20 µg) subjected to Northern blot analysis using human RELB cDNA as probe. Ethidium bromide staining of the gel confirmed equal loading. (a3) T47D cells were treated as above, and nuclear extracts (5 µg) subjected to EMSA using oligonucleotides containing either NF-κB, AP-1 or Oct-1 elements, as probes. (a4) T47D cells were transiently transfected, in triplicate, with 0.5 µg NF-κB or AP-1 element driven constructs κB-Luc or TRE-CAT, respectively and 0.5 µg SV40-β-gal. Post-transfection (6 h), cells were treated with 1 µM ICI 182,780 or equivalent volume of vehicle ethanol for 40 h. Luciferase and CAT activities were determined and values normalized by β-gal activity presented as the mean ± S.D. from three separate experiments (with the control ethanol sample set to 1). (b) Stable Hs578T transfectants expressing either sense RELB (si-Con) or siRNA RELB (si-RELB) were prepared. (b1) RNA (20 µg) was subjected to Northern blot analysis using human RELB cDNA as probe. Ethidium bromide staining of the gel confirmed equal loading. (b2) Nuclear extracts (25 µg) were analyzed by immunoblotting for levels of RelB, p65 and Lamin B, as loading control. (c) WCEs were prepared from MDA-MB-231 cells transiently expressing sense RELB (si-Con) or siRNA RELB (si-RELB). Samples (50 µg) were analyzed by immunoblotting for E-cadherin, γ-catenin (γ-caten), Snail, fibronectin (FN), β-actin, and RelB.
Figure S2 RelB expression promotes mesenchymal phenotype via induction of Bcl-2. (a) Stable
MCF-7 clones expressing either RELB or EV DNA were isolated: RELB(1), RELB(2), EV(1), and EV(2). Cells were transiently transfected, in triplicate, with 0.5 µg κB-Luc vector, and 0.5 µg SV40-β-gal. Post-transfection (48 h), luciferase and β-gal activities were determined and normalized values presented relative to EV transfection, which was set at 1 (mean ± S.D from three separate experiments). Inset: nuclear extracts (25 µg) from the cells, indicated below, were subjected to immunoblot analysis for RelB, p65, and Lamin B. (b) WCEs (25 µg) from MCF-7
RELB and control cells were analyzed by immunoblotting for cyclin D1, product of an NF-κB
target gene, and for β-actin. (c) ZR-75 cells were transiently transfected, in triplicate, with 1.0 µg WT or CRE-Mutant P1 BCL2 promoter-Luc vector, the indicated dose of p52 or RelB expression vectors, 0.5 µg SV40-β-gal and empty vector pcDNA3 (EV) to make a total of 3.5 µg DNA. Post-transfection (48 h), luciferase and β-gal activities were determined and normalized luciferase activities presented (mean ± S.D. from three separate experiments).
Figure S3 RelB reduces E-cadherin expression in MCF-7 cells. The levels of E-cadherin in
stable MCF-7 RELB and control cells were determined by indirect immunofluorescence microscopy using mouse anti-E-cadherin (primary) and Alexa594 anti-mouse (secondary) antibodies. Nuclei were stained with DAPI. Fluorescence microscopy was performed using a Zeiss Axiovert 200M microscope. Individual and merged images are shown. Scale bar, 100 µm.
Figure S4 Bcl-2 reduces E-cadherin expression in MCF-7 cells. The levels of E-cadherin in
MCF-7 stable cells with either EV or full length Bcl-2 DNA were determined by indirect
immunofluorescence microscopy using mouse E-cadherin (primary) and Alexa594 anti-mouse (secondary) antibodies, as in Figure S3. Scale bar, 100 µm.
Figure S5 Full scans of original Western blots and EMSA gel. (a) Full scans of immunoblots of
ERα and RelB in Figure 1a top panel. ns, nonspecific band. (b) Full scans of AP-1 and NF-κB
EMSA in Figure 1e. (c) Full scan of E-cadherin immunoblot in Figure 4i.
a1
b1
c
a2
RELB 28S 18S si-Co n si-RE LBb2
Re lB p6 5 si-Co n si-RE LB Fig S1. W ang et a l., RELB 28S 18S ICI Eth ER α β-actin Re lB ICI Eth Oc t-1 AP-1 κB T 47D 0 0. 5 1 1. 5 2 reporter a κB-Luc 2. 5 3 ctivit y T 47D ICI Eth % R el B :100 162 T 47D T 47D Eth ICI TRE-CAT Lamin B Re lB γ-caten E-cad Snail β-ac ti n FN si-Co n i-R EL s B H s578Ta4
a3
MB -231 H s578Ta cy clin D1 EV (2 ) RE LB (2 ) EV (1 ) RE LB (1 ) β-actin 0 0. 5 1 1. 5 2 2. 5 3. 5 κB luci ferase act ivit y Lamin B EV (2 ) LB RE (2 ) EV (1 ) LB RE (1 ) 0 0. 5 1 1. 5 2 2. 5 3 3. 5 4 4. 5 rela tiv e lucif erase acti vity P1 ( W T ) P 1 (CRE-Mut) p5 2: Re lB: 0 0 0. 5 0 ZR-7 5
c
MCF-7 b MCF-7 Re lB p6 5 3 1. 0 0. 5 1. 0 0. 5 1. 0 0Fig S2. Wang et al.,
DAPI E-Cadherin M er ged MCF-7/EV MCF-7/RELB
E-Cadherin M er ged DAPI MCF-7/EV MCF-7/BCL2
Fig. S4, Wang et al.,
ZR -75 MC F-7 T4 7D NF 639 MB -23 1 578 Hs T