HAL Id: dumas-01766658
https://dumas.ccsd.cnrs.fr/dumas-01766658
Submitted on 13 Apr 2018
HAL is a multi-disciplinary open access
archive for the deposit and dissemination of sci-entific research documents, whether they are pub-lished or not. The documents may come from teaching and research institutions in France or abroad, or from public or private research centers.
L’archive ouverte pluridisciplinaire HAL, est destinée au dépôt et à la diffusion de documents scientifiques de niveau recherche, publiés ou non, émanant des établissements d’enseignement et de recherche français ou étrangers, des laboratoires publics ou privés.
Normes locomotrices et étude de l’association entre
capacités locomotrices et facteurs de risque
cardiovasculaires
Cécile Mouchon
To cite this version:
Cécile Mouchon. Normes locomotrices et étude de l’association entre capacités locomotrices et facteurs de risque cardiovasculaires. Médecine humaine et pathologie. 2018. �dumas-01766658�
1
Université de Bordeaux
U.F.R. DES SCIENCES MEDICALES
Année 2018 N° 3024
THÈSE POUR L’OBTENTION DU
DIPLOME d’ETAT de DOCTEUR EN MEDECINE
Spécialité Médecine Physique et de Réadaptation
Présentée et soutenue publiquement
Par Cécile MOUCHON
Née le 16/12/1987 à Antibes Le 06 Avril 2018
Normes locomotrices et étude de l’association entre
capacités locomotrices et facteurs de risque
cardiovasculaires
Directeur de thèse
Madame le Docteur Anna JIROT
Membres du jury :
Monsieur le Professeur DEHAIL Patrick Président du jury Monsieur le Professeur JOSEPH Pierre-Alain Juge
Monsieur le Professeur DOUARD Hervé Rapporteur et juge Monsieur le Docteur Edouard LHOMME Juge
2
Remerciements
A notre président du jury, Monsieur le Professeur Patrick DEHAIL
Vous me faites l’honneur d’accepter la présidence de cette thèse. Je vous remercie pour la confiance que vous m’avez accordée en me proposant ce travail et pour votre disponibilité. Votre écoute et vos conseils m’ont été précieux.
Veuillez trouver, dans ce modeste travail, l’expression de ma reconnaissance et de ma profonde estime.
A notre jury de thèse,
Monsieur le Professeur Pierre-Alain JOSEPH,
Je vous remercie d’avoir accepté de faire partie du jury. J’ai eu un grand plaisir à travailler dans votre service au début de mon internat. La qualité de vos enseignements, votre écoute et votre confiance m’ont accompagnée dans la découverte de notre belle spécialité.
Veuillez trouver ici la marque de ma profonde reconnaissance.
A Monsieur le Docteur Edouard LHOMME,
Je te remercie pour ton expertise en statistique et ton aide si précieuse dans ce travail ainsi que ta disponibilité.
Soit assuré de ma sincère reconnaissance.
A notre rapporteur de thèse et juge, Monsieur le Professeur Hervé DOUARD,
Je vous remercie de m’avoir fait l’honneur d’accepter d’être rapporteur et juge de ce travail. Vous m’avez accueillie dans votre service pendant mes six premiers mois d’internat et m’avez permis de découvrir la cardiologie et la réadaptation cardiovasculaire. Merci d’apporter votre expertise à ce travail.
Veuillez trouver ici la marque de ma profonde reconnaissance
A notre directrice de thèse et juge, Madame le Docteur Anna JIROT,
Tu m’as fait confiance en me permettant de réaliser ce travail avec toi. Je te remercie d’avoir accepté de diriger ce travail et de m’avoir aidée à le mener à terme. J’espère que mon travail aura su répondre à tes attentes.
3 Aux services que j’ai traversés pendant mon internat et à mes chefs,
Le service de cardiologie du 2ème ouest, premier stage dans une spécialité dans laquelle je n’étais pas particulièrement à l’aise mais l’accueil de l’équipe et l’encadrement du Pr DOUARD, du Dr JAUSSAUD et du Dr AIMABLE ont rendu ces six mois inoubliables et m‘ont fait aimer cette spécialité. Et surtout merci à mes premiers co-internes Isaure et Grégoire sans qui ce stage n’aurait jamais été pareil.
Au service de MPR du CHU de Bordeaux, dans lequel j’ai fait mes premiers pas dans ma spécialité. Un merci tout particulier au Dr CUGY qui a été une chef de clinique toujours très présente, rigoureuse et prête à transmettre son savoir. A mes co-internes : Jennifer, Sylvie, Alice, Anna qui m’ont pris sous leur aile pour mon premier stage en MPR.
A toute l’équipe de la Clinique des Grands Chênes et au service du Dr MIDDLETON pour m’avoir accueillie dans cette ambiance chaleureuse. Merci au Dr MIDDLETON de m’avoir fait découvrir notamment le monde de l’isocinétisme et de m’avoir accompagnée dans l’élaboration de mon mémoire de DIU de Médecine orthopédique. Merci au Dr GUILLERMO pour son accompagnement au quotidien. A ma co-interne Frédérique, merci aussi d’avoir été notre interne référente pendant toutes ces années, cette mission n’a pas été des plus faciles ! Aux équipes de la Tour de Gassies. Au Dr Alexandre CREUZE pour tout ce que tu m’as transmis durant ce stage et pour ton soutien dans mes différents projets, tu connais tout le respect que j’ai pour toi. Au Dr RAVAUD qui m’a apporté un nouveau regard sur la lombalgie chronique. A mes co-internes : Cyprien, Alice, Arnaud.
Au service de MPR de l’HIA Robert Piqué, au Dr VION qui m’a beaucoup appris sur la douleur chronique et aux Dr Tiphaine LAGADEC et Coralie CAZETOU pour votre accompagnement pendant ce stage. Au Dr DARCEL pour m’avoir réconciliée avec la chirurgie orthopédique du pied.
Au service de MPR du CHU de Montpellier dans lequel j’ai passé six mois d’inter-CHU inoubliables autant sur le plan professionnel qu’humain. Au Dr Marc JULIA, tu m’as transmis ta passion de la médecine du sport, aux Docteurs TAVARES, ANQUETIL, DE LABACHELERIE, COROIAN pour votre accueil et vos enseignements. Au Pr LAFFONT pour m’avoir permis de réaliser ce stage au sein de votre service, et pour la qualité de vos enseignements notamment au cours des staffs du matin. A mes co-internes qui m’ont accueillie à bras ouverts et ont rendu ces 6 mois incomparables : Elsa (notre éternelle coach infatigable), Célia, Justine, Clarisse, Juliette, vous me manquez !
Au service de rhumatologie du CH de Libourne. Aux Docteurs VERNHES, CHAIGNE-DELALANDE et DUBLANC pour m’avoir initiée à leur belle spécialité dans un humour inégalable. A mes co-internes : Ranulph, Julie et Sylvain et ses moc’ à glands.
Au service de rhumatologie du CHU de Bordeaux. Au Pr SCHAEVERBEKE pour m’avoir accueillie dans votre service, pour la qualité de vos enseignements, de vos visites et votre confiance. Aux Professeurs BANNWARTH et RICHEZ, aux Docteurs REIGNAC, BOISSON, BARTHE, TRUCHETET, POURSAC, MEHSEN pour votre confiance et votre patience. Ce stage fut une expérience très riche en apprentissages. A mes co-internes Cloclo et Anne-Lise, je suis heureuse de vous avoir eu à mes côtés ces six mois.
4 A mes parents,
Merci Papa et Maman de m’avoir soutenue pendant toutes ces années et de m’avoir encouragée à ne pas lâcher la toute première année. Merci pour votre soutien moral et logistique pendant les périodes d’examen et de concours, de m’avoir toujours écoutée et encouragée.
Merci à Maman d’avoir pris le temps de relire et de corriger ce travail. A mon frère, ma sœur et ma nièce,
Merci pour votre bonne humeur et votre soutien en toutes circonstances. Merci pour les séances de SUP et de yoga qui ont été des moments d’apaisement bénéfiques. Je vous souhaite beaucoup de réussites dans vos différents projets.
A ma mamie, mes oncles et tantes et tous mes cousins et leurs enfants. A ma belle-famille, pour m’avoir accueillie parmi vous.
A mes amis,
A mon amie de toujours Pauline, et sa famille, d’avoir toujours été là depuis toutes ces années, de m’avoir ouvert l’esprit, d’avoir partagé nos années de collège, lycée et notre première année de médecine puis les suivantes d’un peu plus loin. Heureuse de te savoir auprès de Camille avec votre petit Samuel et j’espère bientôt un petit frère ou une petite sœur ! Il nous reste encore des milliers de choses à partager !
A mes amis de toujours, Amandine, Lise, Loïc, Damien, Fiona, merci d’être toujours là pour partager de bons moments malgré la distance. Un merci tout particulier à Andrea qui a pris le temps de relire la partie anglophone de ce travail, mes heures d’english class étant loin à présent…
A notre pote bordelais (d’adoption), Franck, merci pour toutes ces soirées à écouter nos grandes théories chez Totto.
A Marie-Christine, pour nous avoir accueillis lors de nos premiers jours bordelais et pour ces apéros partagés ensemble.
A toute la « famille » de Cahors, Jean, Odile, Xavier, Aurélia, Yannick, Elodie, Mila, Anna, pour votre accueil et votre gentillesse, nos discussions infinies, merci de nous avoir fait découvrir tant de choses.
A mes amis corses de la fac de Nice, Florent, Lydian, Jean-Patrick, à nos soirées arrosées dans le vieux-Nice. J’espère recroiser votre route ces prochaines années.
A Nino, tu m’as offert une excuse pour présenter cette thèse avec plus d’un an de retard. Je suis tellement heureuse que tu partages notre vie aujourd’hui.
A mon Nico, pour ton infaillible soutien au quotidien et ton amour. Merci pour ces six merveilleuses années passées à mes côtés.
5
Table des matières
INTRODUCTION ... 9
L’évaluation du risque cardiovasculaire ... 10
Les recommandations françaises ... 1
Les recommandations européennes ... 12
Article 1 – Distribution of locomotor tests results among 442 french healthy adults ... 16
Introduction ... 17
Methods ... 18
Study setting and source population ... 18
Study design ... 19
Locomotor assessment and data collection ... 20
Sample size calculation and statistical analyses ... 22
Results... 23
Discussion ... 24
Conclusion ... 28
Bibliography ... 45
Article 2 – Comparison of locomotor tests results according to cardiovascular risk factors in a French cohort analysis ... 49
Introduction ... 50
Methods ... 51
Source population ... 51
Locomotor assessment of the initial study ... 52
Data collection ... 53
Statistical analyses ... 54
Results... 54
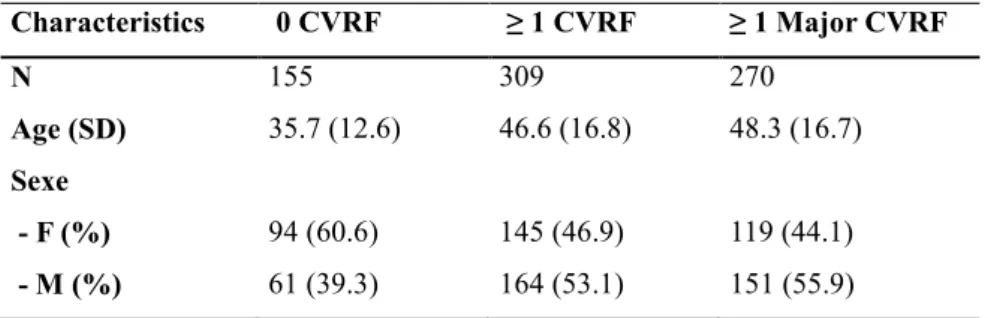
Description of the cohort ... 54
Comparison of locomotor tests according to the number of CV risk factors ... 55
Detailed comparison by age groups ... 55
Discussion ... 57
Conclusion ... 59
Bibliography ... 73
DISCUSSION ... 75
Représentativité de l’échantillon ... 75
Utilisation des normes des tests locomoteurs ... 77
CONCLUSION ... 80
BIBLIOGRAPHIE ... 81
6
Liste des illustrations
Figure 1 - SCORE European Society of Cardiology ... 15
Figure 2 - SCORE Risque relatif European Society of Cardiology ... 16
Figure 3 - Répartition des catégories socioprofessionnelles dans notre échantillon et dans la population française ... 77
Figure 4 - Répartition de notre échantillon et de la population française par groupe d'âge et sexe ... 78
Tableau 1 – Répartition de notre échantillon et de la population française par sexe ... 78
Dans Article 1 - Distribution of locomotor tests results among 442 french healthy adults: Figure 1 - Participant flow through the study ... 31
Table 1 - Description of the results of locomotor tests ... 32
Figure 2 - Age-related changes in the five times sit-to-stand test (A), grip strength test (B), timed up and go test (C) and walking speed (D) (n=442) ... 33
Figure 3 - Principal component analysis of the locomotor tests and the Dijon Physical Activity Score ... 34
Additional material: Suppl. Table 1 - Description of age and BMI of the population ... 35
Suppl.Table 2 - Description of sexe, smoking status and job category of the population ... 36
Suppl.Table 3 - Description of the results of 5 times sit-to-stand test (s) ... 37
Suppl. Table 4 - Description of the results of timed up and go test (s) ... 38
Suppl. Table 5 - Description of the results of walking speed (m/s) ... 39
Suppl. Table 6 - Description of the results of one-leg standing test with eyes open (s) ... 40
Suppl. Table 7 - Description of the results of one-leg standing test with closed eyes (s) ... 41
Suppl. Table 8 - Description of the results of Grip strength test (Kg) ... 42
Suppl. Table 9 - Comparison of 5STS test (s) in our study and in Bohannon's study... 43
Suppl. Table 10 - Comparison of gait speed results (s) in our study and in Bohannon's study 44 Suppl. Table 11 - Comparison of TUG test results (s) in our study and in Isles' study ... 45
Suppl. Table 12 - Comparison of unipedal stance test results (s) in our study and in Springer's study ... 46
7 Dans Article 2 - Comparison of locomotor tests results according to cardiovascular risk factors in a French cohort analysis:
Table 1 – Description of study population ... 62
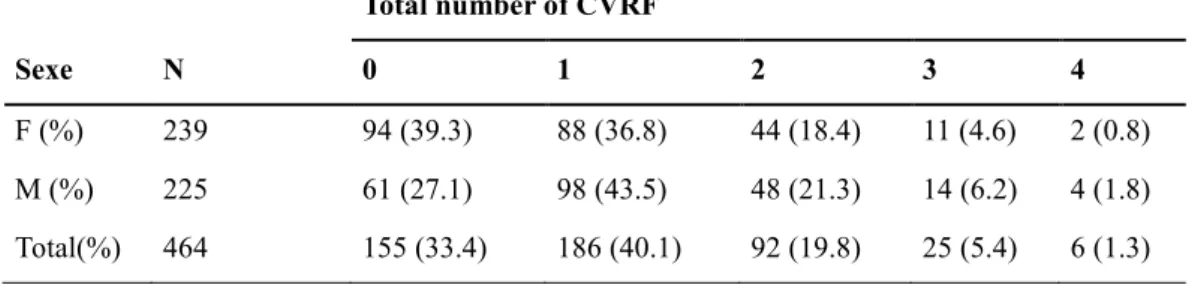
Table 2 - Cardiovascular risk factors repartition in the population ... 63
Table 3 - Cardiovascular risk factors repartition per age and sex group ... 64
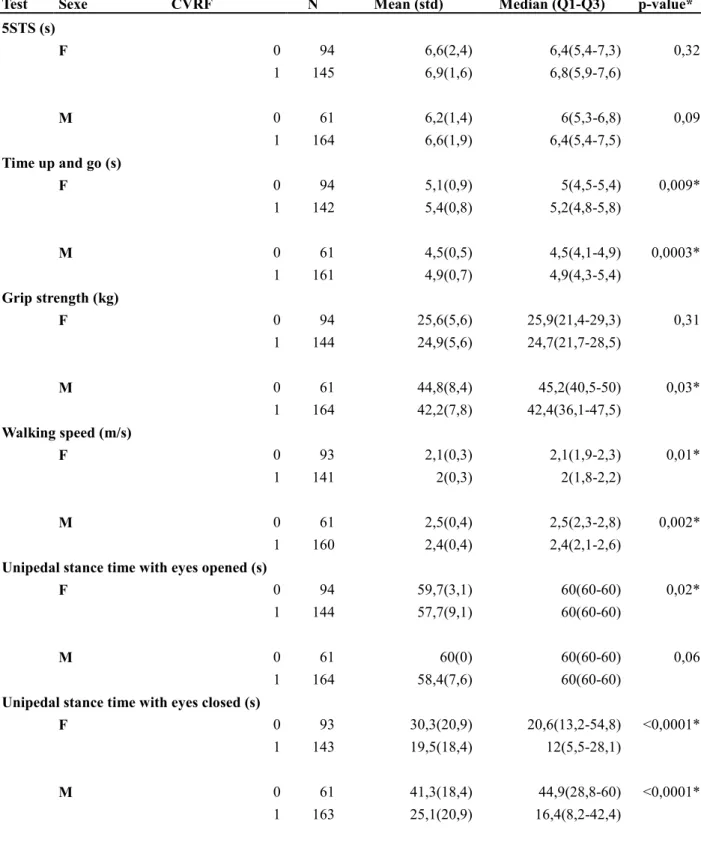
Table 4 - Comparison of tests results between the 3 cardiovascular groups ... 65
Table 5 - Comparison of tests results detailed by sex group ... 66
Figure 1 - Comparison of 5STS test by age group ... 67
Figure 2 - Comparison of TUG test by age group ... 68
Figure 3 - Comparison of walking speed by age group ... 69
Figure 4 - Comparison of grip strength by age group ... 70
Figure 5 - Comparison of unipedal stance time with eyes opened by age group ... 71
Figure 6 - Comparison of unipedal stance time with eyes closed by age group ... 72
Additional material: Suppl. Table 1 - Comparison of locomotor tests by age group ... 73
8
Liste des abréviations
VIH/HIV : Virus de l’Immunodéficience Humaine / Human Immunodeficiency Virus BPCO/COPD : BronchoPneumopathie Chronique Obstructive / Chronic Obstructive Pulmonary Disease
FRCV/CVRF : Facteur de Risque CardioVasculaire / CardioVascular Risk Factor DES : Diplôme d’Etudes Spécialisées
LDL Cholesterol: Low Density Lipoprotein Cholesterol HDL Cholesterol: High Density Lipoprotein Cholesterol IMC/BMI: Indice de Masse Corporelle / Body Mass Index ESC: European Society of Cardiology
SCORE : Systemic Coronary Risk Evaluation Project DFG : Débit de Filtration Glomérulaire
IPS : Index de Pression Systolique 5STS test: 5 times sit-to-stand test
g/kgBW: grams per kilograms of body weight
CNAMTS: Caisse Nationale D’assurance Maladie des Travailleurs Salariés CPP: Comité de Protection des Personnes
CNIL: Commission Nationale de l’Informatique et des Libertés
CCTIRS: Comité Consultatif sur le Traitement de l’Information en matière de Recherche dans le domaine de la Santé
PAS: Physical Activity Score TUG test : Timed Up and Go test SD: Standard Deviation
F: Female M: Male
MRI/IRM: Magnetic Resonance Imaging / Imagerie par Résonance Magnétique CHU: Centre Hospitalier Universitaire
PNNS: Programme National Nutrition Santé
PNSE: Plan National Santé Environnement
PAMA: Plan d’Action pour les Mobilités Actives
ALD: Affection Longue Durée APA: Activité physique Adaptée
9
INTRODUCTION
L’altération des capacités locomotrices chez la personne âgée peut avoir un impact très important sur la qualité de vie et sur la mortalité, via notamment l’augmentation du risque de chutes. L’évaluation des capacités locomotrices est donc un aspect essentiel de l’évaluation clinique afin de pouvoir dépister et prendre en charge rapidement une diminution précoce des performances physiques.
On trouve dans la littérature de nombreuses données sur l’altération des fonctions locomotrices des personnes âgées[1–7], et des tests locomoteurs standardisés sont utilisés en pratique clinique afin de dépister un état de fragilité ou pour évaluer le risque de chute. L’étude des performances locomotrices par des tests standardisés a été également menée dans certaines pathologies chroniques. On observe en effet une altération précoce des performances locomotrices chez des patients infectés par le VIH[8], ou souffrant d’insuffisance cardiaque[9], de diabète[10,11], de dépression[12], de broncho-pneumopathie chronique obstructive (BPCO)[13,14], de cirrhose hépatique[15,16], d’insuffisance rénale chronique[17– 19]. Dans ces études, il apparaît qu’il y a un manque considérable de données de référence pour comparer les capacités de ces patients à des patients sains du même âge.
Quelques études [20–23] ont été menées afin de proposer des données de référence pour certains tests locomoteurs en population générale en-dessous de 70 ans, mais ces études présentent des limites avec notamment des échantillons de population de tailles variables et assez hétérogènes, dont les caractéristiques sociodémographiques diffèrent de celles de la population française.
Par ailleurs, il est important d’identifier les facteurs pouvant influencer les capacités physiques précocement à l’âge adulte, de façon à prévenir l’altération des capacités physiques et ainsi contribuer à l’amélioration de la santé future de la population.
On constate dans la littérature, que chez les patients présentant déjà un état de fragilité en lien avec l’âge ou atteints d’une pathologie neurologique, la présence de facteurs de risque cardiovasculaires semble être en lien avec une aggravation de l’altération des capacités locomotrices. Devant ces données, nous nous sommes intéressés au lien qui pourrait exister entre capacités locomotrices et facteurs de risque cardiovasculaires (FRCV) en population générale.
10 Ce travail présentera donc deux articles. Le premier a pour objectif de décrire la distribution des résultats à des tests locomoteurs par classe d’âge et sexe dans la population générale entre 18 et 69 ans. Cette étude avait été menée par le Dr JIROT dans le cadre de son mémoire de Diplôme d’Etudes Spécialisées (DES) et nous avons ensuite écrit l'article correspondant qui a été soumis pour publication dans Annals of Physical and Rehabilitation Medicine. Le second article a pour objectif de comparer les capacités locomotrices de cette cohorte en fonction de la présence ou non de certains facteurs de risque cardiovasculaires.
Le deuxième article de cette thèse portant sur les facteurs de risque cardiovasculaires, nous avons souhaité faire un rappel sur cette notion d’évaluation du risque cardiovasculaire qui a évolué au cours des quinze dernières années en France.
L’évaluation du risque cardiovasculaire
L’évaluation du risque cardiovasculaire global concerne les sujets qui n’ont aucune pathologie cardiovasculaire avérée. L’intérêt de cette évaluation permet de différencier les sujets à bas ou à haut risque et ainsi d’adapter la prise en charge des facteurs de risque afin de limiter au mieux le développement d’une pathologie cardiovasculaire.
Les principaux facteurs de risque cardiovasculaires identifiés sont : le tabagisme, l’hypertension artérielle, les dyslipidémies et le diabète. L’obésité et d’autres facteurs comportementaux comme la sédentarité, une alimentation déséquilibrée, l’alcool ou le stress, sont considérés comme des facteurs prédisposants et doivent également être pris en charge dans le cadre de la prévention cardiovasculaire. Ils sont définis comme des facteurs de risque modifiables. On retrouve par ailleurs les facteurs de risque non modifiables qui sont l’âge, le sexe et le facteur héréditaire.
Les recommandations françaises
En Février 2017, de nouvelles recommandations françaises ont été publiées sur l’évaluation des FRCV préconisant à présent de suivre les recommandations européennes. Mais lors de l’établissement de notre protocole d’étude, nous nous étions basés sur les dernières recommandations françaises datant de 2004 [24].
L’approche qui était alors recommandée pour l’évaluation du risque cardiovasculaire reposait sur la sommation des facteurs de risque, chacun étant considéré comme présent ou absent et
11 ayant un poids identique. En fonction du nombre de facteurs de risque présents, le risque global était alors estimé faible, modéré ou élevé.
En 2017 également, les recommandations françaises sur la prise en charge de l’hypertension artérielle et de la dyslipidémie ont également été réactualisées, mais nous avions donc utilisé pour l’étude les recommandations de 2005.
Le diabète est défini de manière consensuelle [25] par une glycémie supérieure à 1,26 g/l (7,0 mmol/l) après un jeûne de 8 heures et vérifiée à deux reprises ; ou la présence de symptômes de diabète (polyurie, polydipsie, amaigrissement) associée à une glycémie (sur plasma veineux) supérieure ou égale à 2 g/l (11,1 mmol/l) ; ou une glycémie (sur plasma veineux) supérieure ou égale à 2 g/l (11,1 mmol/l) 2 heures après une charge orale de 75 g de glucose (critères proposés par l’Organisation mondiale de la santé).
L’hypertension artérielle est également définie de façon consensuelle[26] par une pression artérielle systolique supérieure ou égale à 140 mmHg et/ou une pression artérielle diastolique supérieure ou égale à 90 mmHg, mesurées au cabinet médical et confirmées au minimum par 2 mesures par consultation, au cours de 3 consultations successives, sur une période de 3 à 6 mois.
La définition de l’hypercholestérolémie est plus complexe puisque la cible thérapeutique dépend du risque cardiovasculaire associé. Selon les recommandations françaises de 2005 [27], chez un patient sans facteur de risque, le bilan lipidique suivant était considéré comme normal : LDL-cholestérol < 1,60 g/l (4,1 mmol/l), triglycérides < 1,50 g/l (1,7 mmol/l) et HDL-cholestérol > 0,40 g/l (1 mmol/l).
L’âge est considéré comme un facteur de risque important avec des valeurs seuils différentes chez l’homme et chez la femme. Un âge supérieur à 50 ans chez l’homme et supérieur à 60 ans chez la femme est un facteur de risque cardiovasculaire.
Le tabagisme actuel ou arrêté depuis moins de 3 ans est également un facteur de risque.
Enfin, un antécédent familial d’accident cardiovasculaire précoce est un facteur de risque cardiovasculaire :
- Infarctus du myocarde ou mort subite avant l’âge de 55 ans chez le père ou chez un parent du premier degré de sexe masculin
- Infarctus du myocarde ou mort subite avant l’âge de 65 ans chez la mère ou chez un parent du premier degré de sexe féminin.
12 Pour la prise en charge du patient hypertendu[26], il était recommandé de prendre en compte d’autres facteurs qui entrent en compte dans la prévention du risque cardiovasculaire global :
l’obésité abdominale définie comme un périmètre abdominal supérieur à 102 cm chez l’homme et 88 cm chez la femme ou une obésité définie par un indice de masse corporelle (IMC) supérieur ou égal à 30 kg/m2
la sédentarité définie comme l’absence d’activité physique régulière (soit environ 30 min, 3 fois/sem)
la consommation excessive d’alcool (plus de 3 verres de vin/j chez l’homme et 2 verres/j chez la femme)
Les recommandations européennes
Depuis 2017, les recommandations françaises sont donc à présent, identiques aux recommandations européennes. Ces dernières préconisent d’estimer le risque cardiovasculaire global en utilisant des modélisations mathématiques qui prennent en compte la valeur effective de chacun des principaux facteurs de risque. Il est ainsi possible de calculer un risque cardiovasculaire global qui correspond à la probabilité pour le patient de survenue d’un événement cardiovasculaire sur une période définie. Ces modèles de risque ont été initialement élaborés sur des populations nord-américaines dès les années 1970, puis adaptés aux populations européennes au cours de ces dix dernières années.
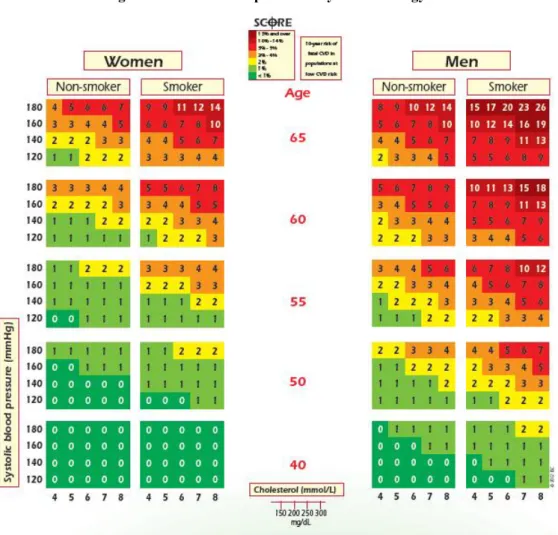
Au niveau européen, il est à présent recommandé par l’European Society of Cardiology (ESC) d’évaluer le risque global grâce au système SCORE (Systemic Coronary Risk Evaluation Project). La notion de « risque global » correspond à une estimation du risque en prenant en compte les facteurs de risque majeurs qui sont : l’âge, le sexe, le tabagisme, l’hypertension artérielle et le chiffre de cholestérol. Ce terme est actuellement répandu, bien qu’il ne prenne malheureusement pas en compte les autres facteurs de risque. Le système SCORE estime le risque à dix ans de survenue d’un décès de cause cardiovasculaire, que ce soit un infarctus du myocarde, un accident vasculaire cérébral, un anévrysme de l’aorte ou autre. Il existe à présent un modèle de SCORE pour les pays à faible mortalité cardiovasculaire, dont fait partie la France, et un autre pour les pays considérés comme à mortalité cardiovasculaire élevée.
13 Figure 2: SCORE European Society of Cardiology
Afin d’estimer le risque à dix ans de décès par survenue d’un événement cardiovasculaire, il faut se placer dans le tableau correspondant au sexe et à l’âge du sujet, et au statut de fumeur ou non fumeur. Au sein de ce tableau, on localise la case se rapprochant le plus du chiffre tensionnel du sujet et de son taux de cholestérol total ou du rapport cholestérol total / HDL-cholestérol. L’estimation du risque devra être ajustée à la catégorie d’âge supérieure lorsque le patient se rapproche de cette catégorie.
Il est également possible d’utiliser un graphique estimant le risque relatif, ce qui peut être particulièrement utile pour les sujets jeunes, même si leur risque absolu est bas. Ce graphique peut notamment être utilisé pour sensibiliser le sujet sur l’effet qu’aurait une réduction de tel ou tel facteur de risque. Par exemple, en général les patients qui arrêtent de fumer diminuent leur risque relatif de moitié.
14
Figure 2: SCORE Risque relatif European Society of Cardiology
Ainsi une fois l’estimation du risque cardiovasculaire global faite, l’ESC propose de classer les patients selon quatre groupes de niveau de risque cardiovasculaire:
Bas niveau de risque : SCORE < 1% et aucun autre facteur associé cité ci-dessus Niveau modéré de risque : SCORE entre 1 et 5%
Haut niveau de risque : o SCORE entre 5 et 10%
o Présence d’un facteur de risque particulièrement sévère, comme une hypercholestérolémie familiale ou une hypertension très sévère
o Diabète de type 1 ou 2 sans facteur de risque associé ou atteinte d’organe cible
o Insuffisance rénale modérée (DFG 30-59 mL/min/1,73m²) Très haut niveau de risque :
o SCORE > ou égal à 10%
o Pathologie cardiovasculaire avérée
o Diabète de type 1 ou 2 avec atteinte d’organe cible ou associé à un facteur de risque majeur comme le tabagisme, une hypercholestérolémie marquée ou une hypertension sévère
o Insuffisance rénale chronique sévère (DFG <30mL/min/1,73m²)
Quel que soit le modèle d’estimation du risque utilisé, il existe des limites dont il faut être conscient. Ces modèles ne prennent pas en compte la durée d’exposition à un facteur de risque et ils ne prennent en compte qu’un nombre limité de facteurs de risque, n’apportant que peu d’attention aux autres variables pourtant clairement liées au pronostic cardiovasculaire (activité physique, stress…)
15 Il est également précisé que ce SCORE doit être interprété en prenant en compte d’autres facteurs qui peuvent entrer en considération dans l’évaluation du risque cardiovasculaire. La prise en compte de ces facteurs associés est très importante lorsque le risque individuel est proche d’une valeur décisionnelle, comme un score de risque de 5%. La présence de ces facteurs doit donc conduire plutôt à relever le score de risque d’un individu et leur absence à abaisser ce score de risque. Ces facteurs ont en revanche moins de poids dans la prise en charge thérapeutique pour les patients présentant un risque élevé ou très élevé. Ces facteurs devant être pris en considération sont nombreux : le fait de provenir d’un milieu social défavorisé ou d’être isolé socialement, le stress, l’anxiété ou la dépression, les sujets ayant un facteur héréditaire d’événement cardiovasculaire précoce, un IMC élevé avec une obésité abdominale, les sujets asymptomatiques mais chez qui ont été mises en évidence des plaques d’athérosclérose (écho-doppler), l’IPS (index de pression systolique), le score calcique coronaire, les patients ayant été traités pour un cancer, ceux atteints de pathologie auto-immune (polyarthrite rhumatoïde surtout), d’apnée du sommeil ou de dysfonction érectile.
La prévention cardiovasculaire est un enjeu essentiel et il faut rappeler que la prévention, lorsqu’elle est appliquée, fonctionne : selon l’ESC, l’élimination des comportements à risque pour la santé permettrait de prévenir au moins 80% des pathologies cardiovasculaires et jusqu’à 40% des cancers.
16
Distribution of locomotor tests results among 442 french healthy
adults
JIROT Anna1,6, MOUCHON Cécile1, RICHERT Laura2,3, LEGER Alain4, LHOMME Edouard2,3, DEHAIL Patrick1, 5
1
CHU de Bordeaux, Service de Médecine Physique et Réadaptation, Pôle de Neurosciences Cliniques –F-33000 Bordeaux
2
Inserm, Bordeaux population health, UMR1219, CIC1401-EC, F-33000 Bordeaux 3
CHU Bordeaux, Pôle de santé publique, CIC1401-EC, F-33000 Bordeaux 4
Centre d’Examens de Santé de la CPAM Gironde, F-33130 Bègles 5
Université de Bordeaux, EA 4136, F-33000 Bordeaux 6
Centre Hospitalier de Lanmary, Service de Médecine Physique et Réadaptation, F-24420 Antonne
Abstract
Objective: Many locomotor tests are used in order to evaluate patient physical capacities in
clinical practice. Reference values exist for those tests in the elderly population but there is a few data available for the general adult population across all ages. The main objective of this study is to describe the distribution of standardized and validated clinical locomotor tests in the French general adult population.
Material and methods: It is a cross-sectional study conducted in 2013 in Southwest France,
including 442 healthy participants aged 18 to 69 years. The locomotor tests performed were 5 repetition sit-to-stand test, Timed Up and Go test, walking speed, unipedal stance time with opened and closed eyes and handgrip strength.
Results: The distribution of each clinical locomotor test is described by age decade and sex.
Physical capacities decrease with increasing age in most of the tests in men and women older than 40 years.
Conclusion: Reference data across the adult age for these locomotor tests are now available
for the French population, allowing clinicians to use these when interpreting test results.
17
Introduction
Assessing locomotor capacity can help predict globalfunctional ability and loss of autonomy in ageing patients. Locomotor dysfunction can have an important impact on a patient’s quality of life and mortality by increased risk of falls [1,2].
Locomotor evaluation is also used to assess frailty in the elderly population. Fried et al.[3] described frailty as a phenotype prevalent with increasing age and conferring high risk of adverse health outcomes such as falls, hospitalization, disability and death. Clinical locomotor tests based on walking speed and grip strength are used to identify frail individuals. Numerous published studies have described the reliability of standardized locomotor tests among elderly people and reference values are available for this specific population [4–6].
Clinical physical capacity tests may also be used to study the locomotor function among younger patients suffering from chronic diseases with deficiencies capable of impacting physical functions. In HIV-infected patients, early deterioration of functional ability has been described [7], as well as in chronic or acute heart failure [8], diabetes [9–11], chronic obstructive pulmonary disease (COPD) [12,13], asthma[14], chronic kidney disease [15–17], cirrhotic alcoholics [18,19], and depression symptom [20] for example. In these studies, it appears that there is a lack of reference data to compare patient capacities to a healthy population of the same age. Indeed, for a general healthy population below 70 years old, few reference data are available.
Bohannon et al. [21] published a meta-analysis of reference values for walking speed, and another study from the same author [22] described five-repetition sit to stand test (5STS) performance in a convenience sample of healthy adults. Normal values of balance tests were established by Isles et al. [23] and Springer et al. [24] published normal values for the unipedal stance test with opened and closed eyes.
Some of the limitations of these studies include variable sample sizes and heterogeneous study populations, which are different in several socio-demographic aspects from the French population.
Indeed, locomotor capacities can vary depending on environment, lifestyle, physical activity or food habits. Concerning environmental influences, Adams et al. [25] showed that the walkability index, public transportation, parks and private recreation facilities were very different among cities and countries, inducing different health behavior such as physical
18 activity [26]. In addition, sports activities can be very different among countries and the access to sports facilities can also be very unequal. Soma et al. [27] found that lower population density, low access to recreational facilities or community centers were negative determinants of physical performance.
Food habits can also influence the locomotor function, as Wu et al. [28] found a significant and independent relation between dietary fiber intake and better physical performance. Isanejad et al. [29] suggested a positive association between higher protein intake (>1.2g/kgBW) and physical function in the elderly.
Establishing more extensive reference values by age group and sex among the French population is therefore necessary. As they are already used in elderly population, those tests could be extended to younger subjects, especially to young patients suffering from chronic diseases. The minimal values of those locomotor tests could help to detect a risk of frailty or poor locomotor capacities which could lead to dependency. Therefore, we would be able to offer those patients a more specific reeducation program or individual advices on physical activity. Those reference values could also be used in research, in order to identify frail patients in cohorts of patients suffering from chronic diseases (HIV, rheumatoid arthritis, kidney transplantation, etc).
The main objective of the present study is to describe the distribution of standardized and validated clinical locomotor tests data in the general adult population aged 18 to 69 years in the French department of Gironde (Southwest France), representing a French urban and peri-urban population.
The secondary objective was to assess correlations between the different locomotor tests used in our study, as well as with physical activity score, age and body mass index.
Methods
Study setting and source population
The population was composed of individuals whose health insurance is administered by the
Caisse Nationale d’Assurance Maladie des Travailleurs Salariés (CNAMTS). Health
insurance is compulsory in France and this fund is covering more than 80% of the French population. Health insurance beneficiaries are invited to attend a free health examination by
19 their health insurance. The health examination begins with a detailed medical history review followed by a physical examination by a general practitioner. A nurse measures blood pressure, weight and height.
A national study done by Carton and Goldberg [30,31] showed that the population in these health screening centers was similar to the general French population regarding sex, age and socioeconomic status and that there was a diverse distribution of working conditions, lifestyle factors, prevalence rates of various diseases and cognitive and physical functioning.
The present study was performed in 2013 in Gironde - a part of the French Nouvelle Aquitaine region – in two health centers : Cenon and Bordeaux.
Study design
It was a descriptive cross-sectional study. Consenting eligible participants consulting the two health centers were enrolled during two periods of 3 weeks from June to July 2013 and 5 weeks from October to November 2013, from Monday to Friday. Calendar periods were scheduled in advance in order to alternate enrolment between the two health centers in Cenon and Bordeaux. During an enrolment period at a given center, study participation was systematically proposed to all adults aged 18 to 69 years. This enrolment scheme was designed to achieve equiprobable sampling and thus a representative random sample of the source population aged 18-69 years.
Participants were excluded if they presented a chronic disease such as neurological disease or musculoskeletal pathology which led to lower limbs or spine deficiency defined by pain (Visual analog scale > 3), paralysis, balance disorder, sensibility disorder, muscular hypertonia or hypotonia, or coordination disorder. People suffering from diabetes and COPD were also excluded, as the aim of the study was to describe reference values in a healthy population.
The investigators informed participants coming for the health examination about the study taking place and invited them to participate. People were included following order of arrival, and a number was attributed to each of them so that data collection remained anonymous. Locomotor tests were performed before or after the medical examination. Once the tests had been carried out, personalized advices were given to the participants according to the results,
20 such as increasing physical activity, working balance, practicing muscular work, and a booklet with specific advice about physical activity was handed to them.
All the participants included gave their verbal consent. The study was approved by the Ethics Committee of Bordeaux “Comité de protection des personnes (CPP) du Sud-Ouest et
Outre-Mer III” (DC 2013/30). In order to warrant protection of personal data, the protocol was
approved by French committee “Commission Nationale de l’Informatique et des Libertés” (CNIL 2036877vO) and “Comité Consultatif sur le Traitement de l’Information en matière
de Recherche dans le domaine de la Santé” (CCTIRS 13.365)
Locomotor assessments and data collection
The study evaluation began with a questionnaire filled by an investigator recording age, sex, declarative height and weight, job category, cigarette consumption, known cardiovascular, rheumatic, orthopedic or neurologic pathologies, and known balance and walking disorders. This questionnaire was filled for every volunteer and those who did not fulfill the eligibility criteria were not included in the study. For individuals who refused to participate to the study, the investigator recorded minimal information if the person accepted including age, sex and work status.
The locomotor evaluation lasted 15 to 20 minutes. It was performed by five physiotherapy students who were trained to the study procedures and supervised by an expert (physiatrist) in order to follow perfectly the guidelines before starting the evaluations themselves.
Moreover, those locomotor tests were composite evaluation tests for the locomotor function evaluating different parameters such as static and dynamic balance, muscle performance, and speed.
Three successive attempts were performed by the participant for each test. The first one was not recorded; the two following attempts were recorded with a digital stopwatch.
First, the intensity of physical activity was assessed by the Dijon Physical Activity Score (PAS). PAS (min 0; max 30) is a simple and reproducible self-administered questionnaire composed of nine questions initially validated for healthy patients above 71 and for patients suffering from coronary artery disease [32].
21 Five-times sit-to-stand (5STS) test [33]: The participant was asked to sit on an armchair (height 45cm) with his back against the chair and arms crossed on the chest. When the investigator gave the “go” signal, the participant did five sit-to-stand-to-sit cycles at accelerated speed.
The investigator started the stopwatch at the “go” signal and stopped it at the end of the fifth stand. The stand-up position had to be complete (extension of lower limbs and trunk).
Timed up and go test (TUG) [6]: An armchair was placed just behind a line on the floor and another line was drawn 3 meters away on the floor. The participant sat on the armchair, and at the “go” signal, the participant had to stand up, walk to the line and then come back and sit on the chair, without running. The investigator started the stopwatch at the “go” signal and stopped it when the participant was sitting again.
Walking Speed: It was evaluated on 5 meters and recorded by a laser beam. Participant walked fast from two meters before the laser beam to two meters after the laser beam, in order to remove the influence of acceleration and deceleration.
Unipedal stance test with opened and closed eyes: The support foot was chosen by the participant and lower limbs did not touch each other. The participant was wearing shoes. The participant performed the test three times successively, respectively standing on one leg with eyes opened and then with eyes closed. The investigator started the stopwatch when the participant lifted the foot from the floor and stopped it when the foot touched the floor again or when the support foot moved or when the participant reached 60 seconds. The best time among the three tests was recorded.
Grip strength: It was assessed by an electronic hand-held dynamometer (KERN MAP, Ref: MAP130K1, maximum weight 130kg, precision 100g) on the dominant hand. The position was defined according to the American Association of Hand Therapists: the participant sat on a chair without armrest, back against the chair, the shoulder in adduction, in neutral rotation, the elbow flexed to 90°, in neutral rotation. The wrist was in extension (0 to 15°) and ulnar deviation (0 to 15°).
There were three measures of grip strength with a minimal contraction of three seconds and a rest period of fifteen seconds. Grip strength was recorded in kilograms.
22 Sample size calculation and statistical analyses
Ten subgroups were defined per sex and age class (18-29 years, 30-39 years, 40-49 years, 50-59 years, 60-69 years). The sample size estimation was based on the 5STS test. We assumed test results in each sub group followed a normal distribution. The primary parameter of interest was the standard deviation of the distribution of the locomotor tests results in a given sub-group, which we aimed to estimate with sufficient accuracy. A sample size of 100 participants per subgroup would give a [1.5 , 3.6] seconds 95% confidence interval around a 2.7 second standard deviation for sit-to-stand test performance [22]. This sample size also allows for estimating the mean with a ± 10% precision (if the coefficient of variation is 50%). Given that the study had 10 subgroups, the target total sample size was 1000 participants. Participants were described per sex and age group (18-29 years, 30-39 years, 40-49 years, 50-59 years, 60-69 years). For each locomotor test and participant, the best performance of the two or three measures was used for the statistical analysis. Tests with uncensored data (five times sit-to-stand test, the timed up and go test, the walking speed on 5 meters and the grip strength) were described in terms of mean, standard deviation, median, interquartile range (Q1-Q3), minimum and maximum, as well as 95% confidence intervals of the mean and of its standard deviation. The test with censored data (unipedal stance test with eyes censured after 60 seconds) was described in terms of rate of censored data, median, interquartile range (Q1-Q3), minimum and maximum. Moreover, age-related changes in the five times sit-to-stand test, grip strength test, timed up and go test and walking speed were graphically described with their arithmetic mean and their corresponding 95% confidence interval.
A principal component analysis was performed to describe the correlations between the different tests. The active variables defining the different components were PAS, five times sit-to-stand performance, timed up and go performance, unipedal stance test with closed eyes, grip strength and walking speed. In order for all active variables in the principal component analysis to have the same interpretation (smaller values reflecting worse test performance), the 5 times sit-to-stand performance and timed up and go performance variables were calculated as the inverse of the observed 5 times sit-to-stand test and timed up and go test times respectively.
The supplementary variables projected on these components were sex, age and BMI. All variables in the principal component analyses were centered and standardized.
23 All statistical analyses were performed using SAS version 9.3 (SAS Institute, Cary, North Carolina, USA) and R software version 3.2.1 (The R Foundation for statistical computing, Vienna, Austria).
Results
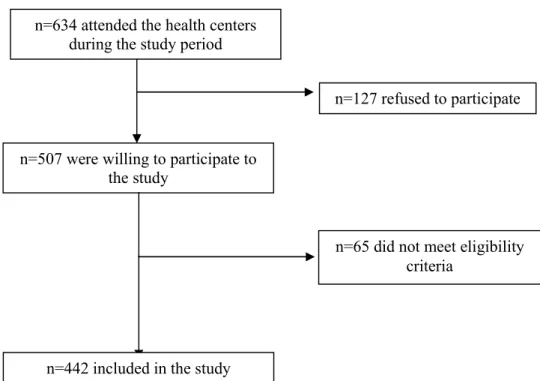
A total of 634 participants attended the health centers of Bordeaux and Cenon during the enrolment periods. The inclusion process in the study is described in Figure 1.
Sixty-five participants presented exclusion criteria, such as age > 69 years or chronic neurological or musculoskeletal disease which led to a lower limbs or spine deficiency or suffered from diabetes or COPD. A total of 442 participants aged 18 - 69 years consented and were included in the study.
Insert Figure 1. Participant flow through the study
The 127 participants who refused to participate were mainly men (57%; n= 72) and the average age was similar to the studied population, respectively 43 and 44 years old.
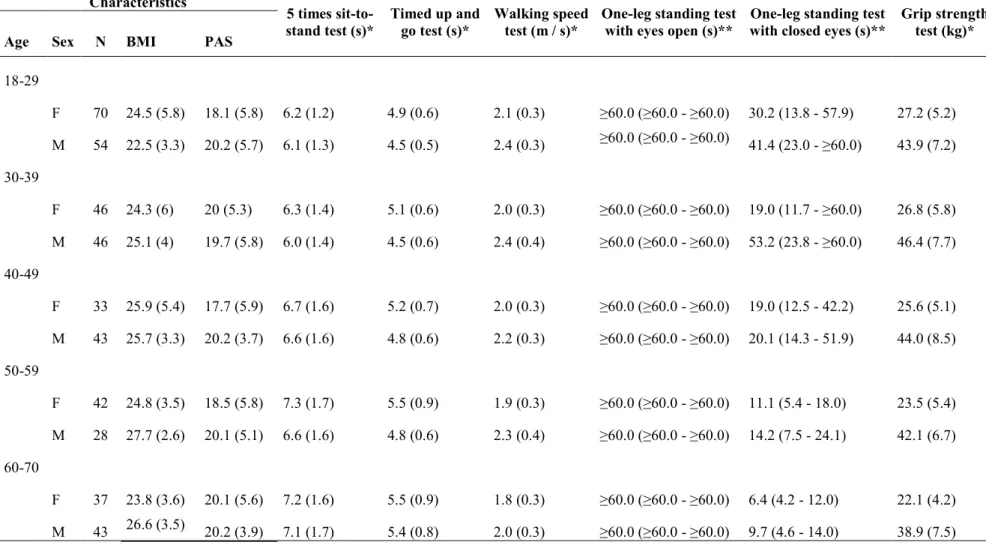
The results of each test are described by age and sex in table 1. More detailed description of the characteristics of the population and of each test results are shown in the additional material (supplementary tables 1-8).
Insert Table 1. Description of the results of locomotor tests
Concerning the opened eyes unipedal stance test, the results were all very high due to the fact that the measurement recording was censored at 60 seconds. The median for every age group was 60 seconds.
In men , after three attempts, 100% of men aged 18 to 59 reached the 60 seconds and 86% in the age group 60 to 70 years. In women, they were 97% in the age group 18 to 29; 98% in the age group 30 to 39; 100% in the age group 40 to 49; 93% in the age group 50 to 59; and 92% in the age group 60 to 70.
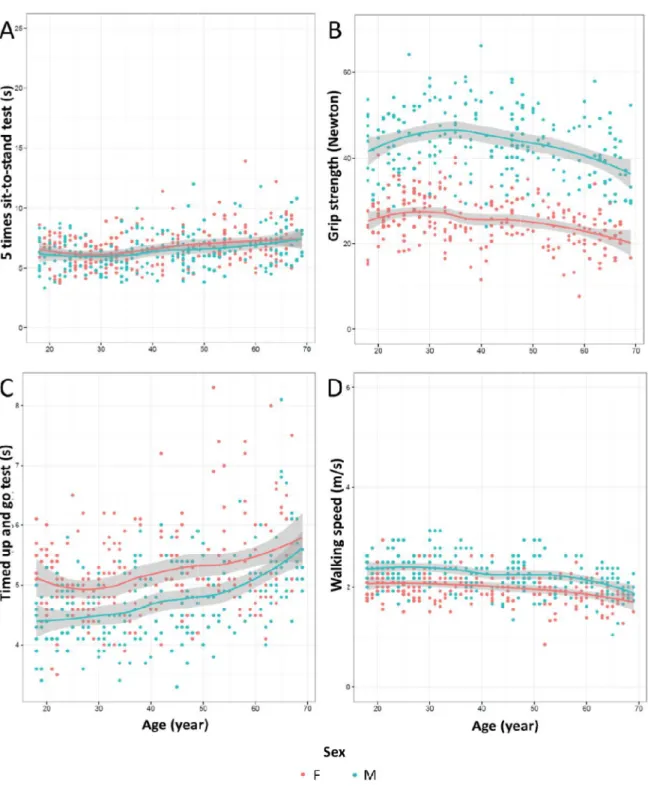
Figure 2 shows age-related changes in 5STS test, grip strength test, TUG test and walking speed. Performance in 5STS test, grip strength, TUG test and gait speed progressively decreased with age in men and women more than 40 years old.
24 Insert Figure 2. Age-related changes in the five times sit-to-stand test (A), grip strength test (B), timed up and go test (C) and walking speed (D) (n=442).
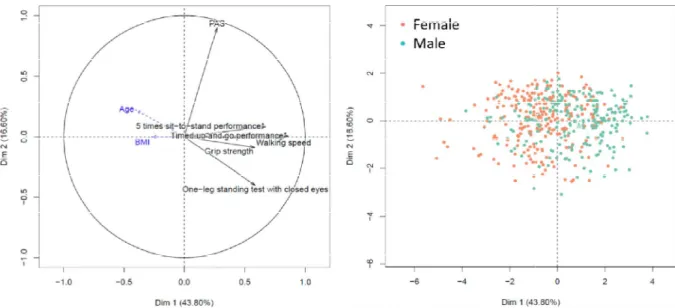
The results of the principal component analysis are presented in Figure 3. The percentage of variation explained by the first and the second components was 41.83% and 15.29%, respectively.
We observed positive correlations between grip strength, walking speed, unipedal stance test with closed eyes, timed up and go performance and 5 times sit-to-stand performance.
Insert Figure 3. Principal component analysis of the locomotor tests and the Dijon Activity Score (PAS). The 5 times sit-to-stand performance and timed up and go performance variables were calculated as the inverse of the 5 times sit-to-stand test and timed up and go test results respectively. All variables were centered and standardized.
Variables are well represented by the component when they are close to the corresponding axis. When two variables are far from the centre, then, i) if they are close to each other, they are significantly positively correlated; ii) if they are orthogonal, they are not correlated; iii) if they are on the opposite side of the centre, then they are significantly negatively correlated. When the variables are close to the centre, it means that some information is carried on other axes.
Age and BMI are projected as supplementary variables on the axes but do not contribute to their calculation.
Discussion
We conducted a cross-sectional study in a representative sample of the general healthy adult population in the Bordeaux area in Southwest France to establish reference values per sex and age category for clinical standardized locomotor tests which are frequently used in clinical practice. Those reference values are relevant for clinicians when interpreting test results in the French population. To our knowledge this is the first study describing reference values in a representative sample of French healthy adults aged < 70 years with a large spectrum of locomotor tests.
25 When we reviewed the current literature, we found several articles presenting reference values for locomotor tests.
In 2010, Bohannon et al. [22] described the results of the 5 STS test in a small convenience sample of the American population aged 14 to 85 years including 111 women and 70 men. The results of our participants are quite close to Bohannon’s study, even slightly superior, especially for people above 40 years old. Supplementary Table 9 in the additional material shows the comparison of the 5 STS test results of our study and Bohannon’s study.
In 2011, in another study Bohannon [21] published reference values for gait speed with a meta-analysis including 41 studies from different countries over the world (half of the studies were from the US) from 1980 to 2009 with a total of 23 111 individuals aged 19 and more. In our study, walking speed was higher than values described by Bohannon. The meta-analysis included very heterogenous types of populations (in terms of age, sex, different continents) and measurements techniques were variable, which could explain the differences with our results. Moreover, in Bohannon’s meta-analysis, 21 459 participants of the total of 23 111 participants (92.9%) were aged over 60 years old. Concerning the measurements techniques, both study evaluated normal overground speed with an allowance for acceleration and deceleration but in the meta-analysis, gait speed was measured over a distance from 3m to 30.5m, either with a stopwatch, or with a camera, or with gait material, or with a photo cell which involves different levels of accuracy of measurement. In our study the measure was made with a laser beam, which gave good accuracy of measurement and could not be biased by the investigator. Supplementary Table 10 in the additional material shows the comparison of the walking speed results of our study and Bohannon’s meta-analysis.
For the TUG test, Isles et al. [23] reported in 2004, reference values within other balance tests, including 456 Australian women aged 20 to 80 years. Here again, the performances in our study were superior to Isles’ study even if we only take into account women results in our study. Suppelmentary Table 11 in the additional material shows the comparison of the TUG test results of our study and Isles’ study.
Springer et al.[24] established in 2007 reference values for unipedal stance time with eyes opened and closed in a population of 549 military health care beneficiaries aged 18 and older in United States. The results are better in our study than in Springer’s study. Here again, the measurement procedure was very different in both studies with a more severe evaluation in Springer’s study, explaining the differences of results. In Springer’s study, participants were
26 evaluated barefoot, whereas our participants wore shoes. Moreover, in Springer’s study their arms were crossed on the chest, and the time ended when the participant made any movement of the upper or lower limbs. In our study, the participants could use their arms or limb to help find balance and the time ended only when the participant touched the floor with the raised limb or moved the support foot. Supplementary Table 12 in the additional material shows the comparison of the unipedal stance test results of our study and Springer’s study.
These differences among studies show the necessity to use national reference values for locomotor tests.
In order to use our reference values, it is necessary to define a lower threshold under which a test would be considered as abnormal. Another study held by our team, under publication, chose to use +/- 2 standard deviation (SD) from the mean or under the 10th percentile as it is considered as strong statistic significance. For the handgrip and unipedal stance time with closed eyes, it is better to use the 10th percentile because the SD is too large and the results are not clinically suitable. For the unipedal stance time with eyes opened, the threshold chosen was 30 seconds because 100% of the patients from 18 to 60 years old lasted at least 30 seconds and 96% of the patients from 60 to 69 years also did.
The use of those tests could be extended to younger subjects, especially to young patients suffering from chronic diseases. The threshold of those tests could help to detect a risk of frailty or poor locomotor capacities in order to offer those patients a more specific reeducation program or individual advices on physical activity. Those reference values could also be used in research, in order to identify frail patients in cohorts of patients suffering from chronic diseases (HIV, rheumatoid arthritis, kidney transplantation, etc).
This locomotor evaluation lasted 20 minutes which is acceptable in order to assess muscle performance, balance and walking speed, but it could be argued that a quicker tool could be needed to screen patients. Among those tests, we observed positive correlations between grip strength, walking speed, unipedal stance test with closed eyes, timed and go performance and 5 times sit-to-stand performance. We could therefore suggest to use grip strength in order to assess general muscular strength, combined with one of the four other tests cited above, but it is impossible for us to give priority to one of them. Indeed, our evaluations were made on healthy patients and the specificity, sensibility and predictive value of each test depends on the deficiency associated to each pathology. For example, in another study held by our team on the prevalence of poor locomotor function after kidney transplantation [34], it has been
27 found that the combination of the 5STS test and the walking speed was the best to identify patients with very poor locomotor function (Specificity 97% and Positive Predictive Value 87%). The clinician will therefore have to define which tests are the most suitable depending on the chronic disease concerned.
In our study, performance in 5STS test, grip strength, TUG test and gait speed progressively decreased with age in men and women more than 40 years old. This decrease appeared a little earlier than what has been observed in other studies. Most of the studies on the effect of age on locomotor capacity described a significant decline rather from 50 years old [23,35–37]. The principal component analysis showed that the sub-components of locomotion which are evaluated by composite tests are positively correlated (speed, balance, sit to stand time).
Our study has the strength of a stringent study design to include a representative sample of healthy adult women and men from 18 to 69 years from the general population in France. Locomotor assessments were prospectively defined and well standardized, and more than 80% of the approached individuals accepted participation in the study. A particular strength of our study is that younger age ranges, including 18 to 40 years, are covered, which is clearly the missing part in existing data on locomotor tests results in the literature.
However, the study is limited by the fact that it did not reach is initially targeted sample size of 100 participants per subgroup. This is due to the fact that the study period was limited to 8 weeks, with a lower enrolment rate than planned. The study period could not be extended with the available resources. The lower than planned sample size potentially results in a lower precision of the estimates, in particular the 95% confidence intervals. However, the standard deviation or the interquatile range is specified for each variable indicating the distribution of the tests results for each age and sex group and the confidence intervals on figure 2 are rather precise.
Moreover, given the scarcity of well conducted studies on locomotor reference values in the literature, our final sample size of 442 participants still contributes valuable information for research and for clinical practice.
As shown in the preliminary results of the “Constances” study, a large nationwide cohort study conducted in health examination centers in France [30], the characteristics of the
28 attendees to such French health examinations are similar to those of the general population, except for the social status distribution. The lower social categories seem to be under-represented among attendees. Nevertheless, the fact that our study population is mainly an urban population, as half of Gironde’s population in living in Bordeaux metropolitan area, needs to be taken into account when extrapolating our results to other populations.
These reference values must be established on representative population, but they will also have to be updated regularly, as the health status of populations evolves throughout the years.
Conclusion
Our study therefore provides reference values per sex and age category for clinical locomotor tests results for healthy adults aged 18 to 69 years old from the French general population. These first French reference values can be a useful tool in clinical practice in order to evaluate and interpret physical functions in healthy and patient populations.
Acknowledgements
We thank Geneviève Chêne (Inserm, UMR1219, CIC 1401, Bordeaux) and Marthe-Aline Jutand (Institut de Santé Publique, d’Epidémiologie et de Développement, University of Bordeaux) for their advice regarding the study design, Dr. Sylvie BIRBIS-CUGY for her assistance and the physiotherapist students who held the locomotor evaluations: Lucie BARES, Marguerite CAMARET, Julien PENALVA, Jessica HEITLER, Hereiti LEE.
29 Figure 3. Participant flow through the study
n=634 attended the health centers during the study period
n=507 were willing to participate to the study
n=127 refused to participate
n=65 did not meet eligibility criteria
30 Characteristics 5 times sit-to-stand test (s)* Timed up and go test (s)* Walking speed test (m / s)*
One-leg standing test with eyes open (s)**
One-leg standing test with closed eyes (s)**
Grip strength test (kg)* Age Sex N BMI PAS
18-29 F 70 24.5 (5.8) 18.1 (5.8) 6.2 (1.2) 4.9 (0.6) 2.1 (0.3) ≥60.0 (≥60.0 - ≥60.0) 30.2 (13.8 - 57.9) 27.2 (5.2) M 54 22.5 (3.3) 20.2 (5.7) 6.1 (1.3) 4.5 (0.5) 2.4 (0.3) ≥60.0 (≥60.0 - ≥60.0) 41.4 (23.0 - ≥60.0) 43.9 (7.2) 30-39 F 46 24.3 (6) 20 (5.3) 6.3 (1.4) 5.1 (0.6) 2.0 (0.3) ≥60.0 (≥60.0 - ≥60.0) 19.0 (11.7 - ≥60.0) 26.8 (5.8) M 46 25.1 (4) 19.7 (5.8) 6.0 (1.4) 4.5 (0.6) 2.4 (0.4) ≥60.0 (≥60.0 - ≥60.0) 53.2 (23.8 - ≥60.0) 46.4 (7.7) 40-49 F 33 25.9 (5.4) 17.7 (5.9) 6.7 (1.6) 5.2 (0.7) 2.0 (0.3) ≥60.0 (≥60.0 - ≥60.0) 19.0 (12.5 - 42.2) 25.6 (5.1) M 43 25.7 (3.3) 20.2 (3.7) 6.6 (1.6) 4.8 (0.6) 2.2 (0.3) ≥60.0 (≥60.0 - ≥60.0) 20.1 (14.3 - 51.9) 44.0 (8.5) 50-59 F 42 24.8 (3.5) 18.5 (5.8) 7.3 (1.7) 5.5 (0.9) 1.9 (0.3) ≥60.0 (≥60.0 - ≥60.0) 11.1 (5.4 - 18.0) 23.5 (5.4) M 28 27.7 (2.6) 20.1 (5.1) 6.6 (1.6) 4.8 (0.6) 2.3 (0.4) ≥60.0 (≥60.0 - ≥60.0) 14.2 (7.5 - 24.1) 42.1 (6.7) 60-70 F 37 23.8 (3.6) 20.1 (5.6) 7.2 (1.6) 5.5 (0.9) 1.8 (0.3) ≥60.0 (≥60.0 - ≥60.0) 6.4 (4.2 - 12.0) 22.1 (4.2) M 43 26.6 (3.5) 20.2 (3.9) 7.1 (1.7) 5.4 (0.8) 2.0 (0.3) ≥60.0 (≥60.0 - ≥60.0) 9.7 (4.6 - 14.0) 38.9 (7.5) * mean (standard deviation)
** median (Q1 - Q3)
F : female ; M : male PAS : physical activity score
Figure 2. Age-related changes in the five times sit test (C) and walking speed (D), (n=442)
Data presented as arithmetic mean (colored line) and the corresponding 95% confidence interval per sex (grey surface).
F: female; M: male
related changes in the five times sit-to-stand test (A), grip strength test (B), timed up and go (n=442).
Data presented as arithmetic mean (colored line) and the corresponding 95% confidence interval per sex (grey
31 stand test (A), grip strength test (B), timed up and go
Figure 3. Principal component analysis of the locomotor tests and A: Individuals distribution (1st and 2
*The 5 times sit-to-stand performance and timed up and go performance variables were calculated as the inverse of the observed 5 times sit-to-stand test and timed up and go test results
. Principal component analysis of the locomotor tests and the Dijon Activity Score (PAS) and 2nd components); B: Variables factor map (1st and 2
stand performance and timed up and go performance variables were calculated as the inverse stand test and timed up and go test results times respectively
32 the Dijon Activity Score (PAS).
and 2nd components). stand performance and timed up and go performance variables were calculated as the inverse
33
Additional material
Variable N Mean Std Median Lower Quartile Upper Quartile
Age 442 41.6 15.4 40.5 28 55
BMI 438 24.9 4.5 24.3 21.6 27.1
Supplementary Table 1. Description of age and BMI of the population BMI: Body Mass Index
34
Variable Frequency Percent
Cumulative frequency Cumulative percent Sexe F 228 51.58 228 51.58 M 214 48.42 442 100.00 Smoking status Former smoker 89 20.14 89 20.14 Smoker 131 29.64 220 49.77 Never smoked 222 50.23 442 100.00 Job category Farmers 0 0 0 0
Artisans, shopkeepers and company managers 23 5,2 23 5,2 Senior management and high intellectual professions 35 7,9 58 13,1 Intermediate occupations 69 15,6 127 28,7
Employees 64 14,5 191 43,2
Workers 34 7,7 225 50,9
Retirees 69 15,6 294 66,5
Other people without professional activity 148 33,5 442 100
Supplementary Table 2. Description of sexe, smoking status and job category of the population F: female; M: male
35 Characteristics
Mean (95%CI) Std (95%CI) Median Q1 - Q3 Min - Max 5th Pctl 10th Pctl 90th Pctl 95th Pctl Age Sex N 18-29 F 70 6.2 (5.9 , 6.5) 1.2 (1.0 , 1.4) 6.4 5.2 - 7.1 3.7 - 8.6 4.0 4.5 7.7 7.9 M 54 6.1 (5.8 , 6.5) 1.3 (1.1 , 1.6) 6.1 5.2 - 7.2 3.3 - 8.7 4.1 4.4 8.3 8.3 30-39 - - F 46 6.3 (5.9 , 6.7) 1.4 (1.1 , 1.7) 6.2 5.3 - 7.0 4.0 - 9.2 4.4 4.6 8.7 9.0 M 46 6.0 (5.6 , 6.4) 1.4 (1.1 , 1.7) 5.8 5.1 - 6.6 3.8 - 10.0 4.2 4.3 8.3 8.5 40-49 - - F 33 6.7 (6.2 , 7.3) 1.6 (1.3 , 2.1) 6.8 5.7 - 7.7 4.1 - 11.4 4.4 4.8 8.1 10.0 M 43 6.6 (6.1 , 7.1) 1.6 (1.3 , 2.0) 6.4 5.6 - 7.8 3.9 - 12.0 4.5 4.6 8.2 8.4 50-59 - - F 42 7.3 (6.8 , 7.8) 1.7 (1.4 , 2.1) 6.9 6.2 - 8.0 5.1 - 13.9 5.5 5.8 9.4 9.5 M 28 6.6 (6.0 , 7.2) 1.6 (1.2 , 2.1) 6.4 5.8 - 7.2 3.8 - 10.4 4.3 4.8 9.0 10.2 60-70 - - F 37 7.2 (6.6 , 7.7) 1.6 (1.3 , 2.1) 7.0 6.1 - 7.8 4.6 - 12.2 5.0 5.2 9.5 9.7 M 43 7.1 (6.6 , 7.6) 1.7 (1.4 , 2.1) 6.9 5.7 - 8.1 4.5 - 11.8 5.0 5.2 9.0 10.5
Supplementary Table 3. Description of the results of 5 times sit-to-stand test (second) F: female; M: male
36 Characteristics
Mean (95%CI Std (95%CI) Median Q1 - Q3 Min - Max 5th Pctl 10th Pctl 90th Pctl 95th Pctl Age Sex N 18-29 F 70 4.9 (4.8 , 5.1) 0.6 (0.5 , 0.7) 4.8 4.6 - 5.3 3.5 - 6.5 4.1 4.35 5.7 6.0 M 54 4.5 (4.3 , 4.6) 0.5 (0.4 , 0.6) 4.5 4.1 - 4.8 3.4 - 5.8 3.6 3.9 5.0 5.3 30-39 F 46 5.1 (4.9 , 5.3) 0.6 (0.5 , 0.8) 5.1 4.7 - 5.6 3.9 - 6.2 4.0 4.2 6.0 6.1 M 46 4.5 (4.3 , 4.7) 0.6 (0.5 , 0.8) 4.4 4.1 - 5.0 3.4 - 5.9 3.7 3.8 5.4 5.5 40-49 F 33 5.2 (5.0 , 5.4) 0.7 (0.5 , 0.9) 5.1 4.7 - 5.5 4.0 - 7.2 4.1 4.4 5.9 6.2 M 43 4.8 (4.6 , 5.0) 0.6 (0.5 , 0.8) 4.8 4.3 - 5.4 3.3 - 6.0 3.8 4.0 5.5 5.8 50-59 F 42 5.5 (5.2 , 5.8) 0.9 (0.8 , 1.2) 5.1 4.9 - 5.7 4.3 - 8.3 4.4 4.6 7.0 7.4 M 28 4.8 (4.6 , 5.0) 0.6 (0.5 , 0.8) 4.8 4.4 - 5.2 3.8 - 6.4 4.0 4.0 5.5 5.7 60-70 F 37 5.5 (5.2 , 5.8) 0.9 (0.7 , 1.1) 5.3 4.9 - 6.1 4.1 - 8.0 4.5 4.5 6.6 7.5 M 43 5.4 (5.1 , 5.6) 0.8 (0.6 , 1.0) 5.3 4.9 - 5.7 4.0 - 8.1 4.4 4.6 6.2 6.8
Supplementary Table 4. Description of the results of timed up and go test (second) F: female; M: male
37 Characteristics
Mean (95%CI) Std (95%CI) Median Q1 - Q3 Min - Max 5th Pctl 10th Pctl 90th Pctl 95th Pctl Age Sex N 18-29 F 70 2.1 (2.0 , 2.2) 0.3 (0.3 , 0.4) 2.0 1.9 - 2.3 1.5 - 2.9 1.7 1.7 2.6 2.6 M 54 2.4 (2.3 , 2.4) 0.3 (0.3 , 0.4) 2.4 2.2 - 2.5 1.7 - 2.9 1.9 1.9 2.8 2.9 30-39 F 46 2.0 (2.0 , 2.1) 0.3 (0.2 , 0.4) 2.0 1.8 - 2.2 1.5 - 2.6 1.6 1.7 2.4 2.5 M 46 2.4 (2.3 , 2.5) 0.4 (0.3 , 0.5) 2.4 2.1 - 2.8 1.8 - 3.1 1.8 1.9 2.9 3.1 40-49 F 33 2.0 (1.9 , 2.1) 0.3 (0.2 , 0.4) 2.0 1.9 - 2.3 1.6 - 2.6 1.7 1.7 2.4 2.5 M 43 2.2 (2.1 , 2.3) 0.3 (0.3 , 0.4) 2.3 2.1 - 2.5 1.4 - 2.9 1.7 1.8 2.6 2.6 50-59 F 42 1.9 (1.8 , 2.0) 0.3 (0.2 , 0.4) 1.9 1.8 - 2.0 0.8 - 2.5 1.4 1.6 2.2 2.3 M 28 2.3 (2.1 , 2.4) 0.4 (0.3 , 0.6) 2.2 2.0 - 2.6 1.7 - 2.9 1.7 1.7 2.8 2.9 60-70 F 37 1.8 (1.7 , 1.9) 0.3 (0.2 , 0.4) 1.9 1.7 - 2.0 1.3 - 2.4 1.4 1.4 2.2 2.4 M 43 2.0 (1.9 , 2.1) 0.3 (0.3 , 0.4) 2.1 1.9 - 2.2 1.0 - 2.5 1.5 1.7 2.4 2.4
Supplementary Table 5. Description of the results of walking speed (meter/second) F: female; M: male