HAL Id: hal-00875668
https://hal.inria.fr/hal-00875668
Submitted on 22 Oct 2013
HAL is a multi-disciplinary open access
archive for the deposit and dissemination of
sci-entific research documents, whether they are
pub-lished or not. The documents may come from
teaching and research institutions in France or
abroad, or from public or private research centers.
L’archive ouverte pluridisciplinaire HAL, est
destinée au dépôt et à la diffusion de documents
scientifiques de niveau recherche, publiés ou non,
émanant des établissements d’enseignement et de
recherche français ou étrangers, des laboratoires
publics ou privés.
ELVIS: Extensible Log VISualization
Christopher Humphries, Nicolas Prigent, Christophe Bidan, Frédéric
Majorczyk
To cite this version:
Christopher Humphries, Nicolas Prigent, Christophe Bidan, Frédéric Majorczyk. ELVIS: Extensible
Log VISualization. VIZSEC, Oct 2013, ATLANTA, United States. �hal-00875668�
ELVIS
Extensible Log VISualization
Christopher Humphries
Supélec/INRIA[email protected]
Nicolas Prigent
Supélec[email protected]
Christophe Bidan
Supélec[email protected]
Frédéric Majorczyk
DGA-MI/Supélec[email protected]
ABSTRACT
In this article, we propose ELVIS, a security-oriented log visualization tool that allows security experts to visually ex-plore numerous types of log files through relevant represen-tations. When a log file is loaded into ELVIS, a summary view is displayed. This view is the starting point for explor-ing the log. The analyst can then choose to explore certain fields or sets of fields from the dataset. To that end, ELVIS selects relevant representations according to the fields cho-sen by the analyst for display.
Categories and Subject Descriptors
C.2.0 [Computer-Communication Networks]: General – Security and Protection; I.3.6 [Methodologies and Tech-niques]: Interaction Techniques; H.5.2 [Information In-terfaces and Presentation]: [User InIn-terfaces]
General Terms
Security, Visualization
Keywords
Intrusion Detection, Forensics, Logs Management
1.
INTRODUCTION
As computer systems increase in complexity, attacks evolve and become increasingly harder to deal with. Due to that fact, reactive security mechanisms (i.e. security mechanisms that detect attacks and mitigate their effects) are now com-monplace. Although intrusion detection systems are now quite efficient, they often fail to detect subtle inconsisten-cies or identify new patterns. As a consequence, a current trend consists in bringing the human back in the loop.
Visualization tools have been proposed to help users un-derstand what is happening on the systems they are mon-itoring. They benefit from the fact that the human brain
ACM acknowledges that this contribution was authored or co-authored by an employee, contractor or affiliate of the national government. As such, the Government retains a nonexclusive, royalty-free right to publish or re-produce this article, or to allow others to do so, for Government purposes only.
VizSec ’13October 14 2013, Atlanta, GA, USA
Copyright is held by the owner/author(s). Publication rights licensed to ACM.
ACM 978-1-4503-2173-0/13/10 ...$15.00.
is particularly efficient at identifying patterns and inconsis-tencies when information is properly displayed. Based on various sources of information such as log files and alerts generated by intrusion detection systems, visualization tools display security-relevant data in a human friendly form.
Generally, using security visualization software requires knowledge and experience in security, especially for analysing custom log formats and system configurations [10]. When faced with a situation, experts rely on familiar processes to ascertain the situation, identify issues, and find solutions. With these sequential goals in mind, they intuitively de-velop habits in the form of behaviour patterns and personal protocols [2].
To the same degree, creating visualization software re-quires visualization expertise, i.e., knowledge of statistics, design and psychology. However, security experts trying to create ad hoc visualization tools are often not able to effi-ciently do so due to lack of experience, being first and fore-most security experts, and second – if at all – experts in visualization. History has shown that although the results of visualization without training can sometimes be surpris-ingly effective, they can also lead to misleading results [17]. Therefore, we advocate that security visualization should let experts concentrate on their objectives as much as possible, freeing them from issues outside their area of expertise.
In this article, we describe ELVIS (Extensible Log VISual-isation), a security-oriented extensible log visualization tool which runs in a web browser. ELVIS allows security experts to import log files with multiple formats (e.g, apache stan-dard logs and syslog files such as authlog) and explore them through relevant representations automatically selected and generated according to the data chosen to be displayed.
ELVIS was built with two objectives in mind. First, to allow security experts to benefit from adequate visual repre-sentations of log files they need to analyze without requiring experience in domains such as visualization and design. Sec-ond to be as versatile as possible by handling many types of log file and by being extensible for handling extra formats without requiring the help of visualization experts to design new representations specific to these new types of log files.
The interaction process with ELVIS is composed of two main phases:
• Log acquisition and summary view, during which the user imports the required log files. The resulting datasets are then automatically enriched by the system and summary visualizations are displayed for each of them
using small multiples[17]. These representations are the starting point for exploring the logs.
• Interaction and representation generation, during which the user selects fields to be represented and relevant representations for these are automatically chosen. These two phases are described in detail in the following sections. In section 2, we explain how logs are managed in ELVIS. In section 3, we illustrate the first representation proposed in ELVIS, which summarizes a dataset. In sec-tion 4, we describe the user interacsec-tions and show how valid representations are automatically chosen according to the information the user wants to display. Finally, in section 5, we demonstrate the previous functions using the Honeynet Forensic Challenge 10 dataset [14].
2.
LOG MANAGEMENT
ELVIS uses log files as data sources. In this section, we first detail the log files we consider and how they are or-ganized. We then show how ELVIS automatically extracts, structures and enriches datasets from these logs.
2.1
Log file organization
Log files are automatically generated by operating systems or applications to keep track of the events that occurred. When a given event of interest occurs, a new record is added at the end of the log file. Without loss of generality, we consider that each record consists in a line in the log file. Consequently, each event of interest corresponds to a given line. We also consider that all the records/lines in a given log file follow the same structure: each of them contains the same fields (or columns). For every record in a given log, the value of a field may be null (not present) or undefined (with no value). This definition of logs is very broad and encompasses many data sources such as tcpdump packet capture files, Snort alert logs, Apache access and er-ror logs, Linux authentication logs, etc. However, it does not cover other log files such as the Linux kernel log for which the format is more permissive, and Dpkg logs, for which each event can span several lines.
In a given log file, each field can be defined by its mean-ing, a type or an extension type and its value. In ELVIS, the meaning is associated with a label that describes what the field means. For instance, it can be Source IP, Desti-nation IP, Source port, Time, Alert Severity, HTTP Re-sponse Code, etc. In the various log files, fields with very different meanings can exist since each log file contains infor-mation which is specifically relevant to the application/system which created it. Furthermore, some meanings can be very specific to an application and will not be used in any other type of log file, making it very difficult to be exhaustive in possible meanings. In consequence, the meanings of the var-ious fields are mainly of interest to the user and will not be used in ELVIS to automatically select suitable representa-tions.
In ELVIS, each field is also associated with a type. In contrast with the meanings, the types we define are generic enough to encompass all the fields currently in use for the log files we selected, while being specific enough (as we will show in section 3) to allow the automatic selection of relevant representations. We currently use four different basic types: • Ordinal in the sense that the values the field contains for different records can be ordered, that a minimum
and a maximum can be found and that adding two ordinal values does not make any sense. Substract-ing two ordinal values does however make sense. For instance, a timestamp field is ordinal.
• Cardinal in the sense that the values the field contains can be counted, added, compared and that a mean and a sum can be computed. For instance, a packet size field is cardinal.
• Categorical in the sense that two records having the same value for the field belong to the same category. Values in categorical fields cannot be ordered or added. However, it is possible to count the number of unique values in the log file for this field (i.e., how many cat-egories there are), the distribution, etc. IP address, UDP/TCP port or CVE value are examples of categori-cal fields.
• Geographical in the sense that it can be located on a map. For instance, the location field that gives the GPS coordinates of an IP is of geographical type.
As will be shown later in this article, the type of a field is used to augment the dataset and to choose relevant repre-sentations.
Some fields are in fact very common in security-related logs, e.g, timestamps, IP addresses and ports. These kinds of fields bear a specific semantic meaning for the security ex-pert and are generally used to obtain further information. For example, GPS coordinates can be deduced from a public IP address, the weekday can be deduced from a timestamp, etc. In consequence, an extension type can be associated with these specific fields in addition to one of the four fun-damental types. As their name implies, extension types will be used to automatically enrich the dataset by creating new fields which depend on a field having a given extension type. Currently, we have defined four extension types: timestamp, IP, TCP port, UDP port. We provide more information on how extension types are used in section 2.3.
In the next sections, we show how datasets are acquired from log files, how (extension) types are assigned to fields and how datasets are augmented. Later in this document, we show how field types are used to choose the relevant representations.
2.2
Log files acquisition
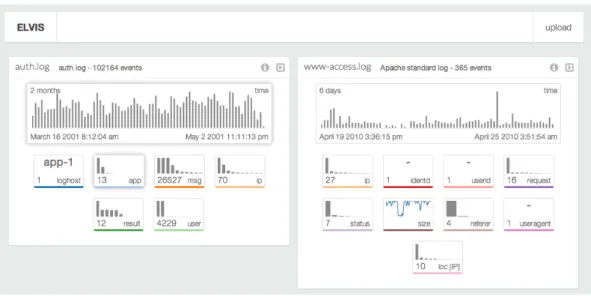
The first step of log file acquisition consists in parsing the log files submitted by the user. He or she can submit log files either by dragging the file into the browser window or by clicking on the upload button on the top right of the page (cf. Fig. 1).
ELVIS has a set of dataset formats (among which Apache standard, syslog and its variations auth.log for instance -and Snort IDS). Each of them is dedicated to a given log file format. When a log file is submitted, ELVIS tries to match the first line with each loaded format. If a match is found, a dataset is created from the file using the matched format. The format identifier is then added to the dataset, this in-formation being known by the parser. We should mention that in order to create a new dataset format and therefore be able to import new log files, the user needs to provide a regular expression matching the format of a line for this log as well as the label, the type and/or extension type for each field.
Once the whole file has been parsed, labeled and (exten-sion) typed, the augmentation stage begins.
2.3
Log file augmentation
ELVIS augments logs in two different ways: horizontal augmentation and vertical augmentation.
First, horizontal augmentation consists in adding extra fields to each record (in other words, new columns to the dataset) based on the extension fields that are contained in the dataset. For instance, a new GPS location field of the geographical type is added to each record for each field ex-hibiting the IP extension field in the record. This field will automatically be labeled “Loc(labelOfTheIPfield)” for better comprehension by the user. This horizontal augmentation is simply done by sequentially considering each field of the original dataset. If an extension type is found, the corre-sponding fields are generated for each record of the dataset. When horizontal augmentation is over, ELVIS performs vertical augmentation on the dataset. This consists in com-puting statistical values for each field (including the fields that have been added during the horizontal augmentation phase) which are global to all the values. Vertical augmen-tation of a field depends on the type of the field. On cate-gorical fields, the number of different values is computed, as well as the set of these values and their distribution. On cardinal fields, min, max, mean and sum values are puted. On ordinal fields, min, max and median are com-puted. The computed results are stored as metadata in the dataset.
When the dataset augmentation is over, a visual summary of the log file is displayed. Fig. 1 shows a global view of the ELVIS interface after two log files have been imported.
Each of the imported log files has been displayed in a summary view, which are described and explained in the next section.
3.
SUMMARY VIEW
The summary view provides the user with a global overview of a dataset. Fig. 2 shows the summary view of an apache log file.
Figure 2: The summary view of an apache log file.
The name of the file (www-access.log), the type of the log file (Apache standard) and the number of events (365) are displayed in the view header at the top. To its right, an information icon allows the user to obtain more information about the dataset, i.e., a more verbose description of the format, how the information was obtained and the size of the dataset in memory. The arrow icon allows the user to reduce the summary view so as to save space on screen.
The next component is a chart in the upper part of the view displays event distribution in the dataset. The dura-tion, start and end times are displayed in corners and the bar chart displays the evolution of the number of events across time. This provides the user with a global overview of the considered period as well as of the distribution of the events to rapidly pick out unusual points in time during which too many or too few events occurred.
Under the main visualization, smaller blocks display small multiple views for each field of the dataset. The label for the field is displayed in the bottom right of the block and the content of each block depends on the type of the field that this block represents. For categorical fields, the number of categories is displayed in the bottom left and a sparkline type bar chart displays the distribution of the various val-ues1. In some specific cases, a given categorical type field
will have a single unique value for all the records in the dataset. This for instance is the case for our Apache access log where the fields identid, userid and useragent are all set to a default value in the log file, i.e, “-”. In this case, the single unique value is displayed instead of a sparkline visual-ization. For cardinal type fields, a sparkline type line chart displays the evolution of the field across time. For ordinal type fields, the minimum and maximum are displayed in a similar way to the timestamp fields for which a user-friendly representation of the beginning and end date are provided.
These field summary blocks provide valuable insights for the user in a concise way. First, the user knows at a glance which fields are available. Second, he or she can quickly identify which fields might or might not be relevant to the analysis objectives, e.g., the same value for this field is present in all the records of the log. Finally, the summary in each small block can help the user know which intervals are con-sidered (the timeframe, for instance) and therefore identify anomalous values, characteristic trends, etc. Although rep-resentations (variable extents, distributions and sparklines) are chosen automatically based only on the type of the field, we argue that they are in fact valuable if not concise.
In this section, we presented the summary view which is automatically generated for any imported log file, provided that the correct parser is available. We insist on the fact that when creating a new parser for a new type of log file, the user never has to choose the representations that should be used in the summary. Consequently, he or she does not need extra skills in design or visualization. In the next section, we show how the user interacts with the summary view to obtain details on the various fields and their compositions.
4.
USER INTERACTIONS
In this section, we describe user interactions with the dataset through the summary view. We begin by describing how the user chooses the fields he or she is interested with.
1This information is of course pre-calculated when the
Figure 1: The ELVIS interface after two log files have been imported.
We then explain how representations are automatically se-lected according to the types of the sese-lected fields. Finally, we briefly describe how representations are generated.
4.1
Selecting fields of interest
As shown in section 3, each field of the dataset is pre-sented as a summary block in the summary view. In order to interact with the dataset, the user can select one or more blocks to form a simple subset of the fields he or she is cur-rently interested in. A shadow then surrounds these fields, providing visual feedbacks on the fields that are selected.
In order to obtain a detailed representation of the selected fields, the user drags them off the summary view and drops them on a free space of the background of the web page. While this mode of interaction may not be intuitively dis-covered by all the users who have their first hand on expe-rience with ELVIS without any briefing, we found that the metaphor of dragging fields of interest off the summary views to obtain detailed views was acquired very quickly. Further-more, given how representations are placed on the screen, it is very easy for the user to find a free space without having to go through a complex process.
Once the selected fields are dropped, ELVIS automatically selects a relevant representation for these data. The way this selection is performed is described in the next section.
4.2
Automated selection of representations
For individuals having no specific skills in visualization, the selection of a relevant representation for a dataset is a complex task. Even if Bertin [3] and Wilkinson [20] for instance have provided fundamental pieces of work on this topic, one cannot expect security experts to spend extensive time on selecting a representation for the data they want to inspect. As a consequence, ELVIS will automatically se-lect a relevant visualization given the fields the user wants represented.
To that end, based on the type of each selected field, ELVIS selects a relevant representation according to the fol-lowing rules, inspired by [3, 20]:
• Selecting a single categorical field which number of
unique values is smaller than eight2, a pie chart is
pro-duced.
• Selecting a single categorical field which number of unique values is bigger than seven, a bar chart is pro-duced.
• Selecting a single ordinal or cardinal field produces a detailed histogram displaying the general distribution of its values.
• Selecting a single geographical type field produces a map with plotted points and an adjusted view to encompass them.
• Selecting two categorical type values produces a ma-trix based adjacency chart for correlation.
• Selecting two cardinal or ordinal fields produces a scatter plot for finding correlations. However, if one of these fields is of type time, this produces a line chart to display value evolution.
• Selecting a categorical field and a geographical field produces pie charts placed on a map.
• Selecting an ordinal or a cardinal field and a geo-graphical field produces big or small dots (according to the value of the ordinal/categorical field) located on a map.
• When any other combination is chosen, ELVIS falls back to parallel coordinates `a la PicViz [16], that is known to be able to display numerous values and mul-tiple fields.
The set of representations available in ELVIS has deliber-ately been kept small. Indeed, we did not want to take the risk of confusing the user with many possible representations for a single concept, nor create very specific and possibly hard to understand representations that would only appear
2We experimentally found that when there are more than 7
in very specific cases. We here remind that one the objec-tives of ELVIS is to be extensible to new kinds of log files formats having fields which semantic may be very different from the ones that are already available in the tool. It is therefore important that some generic-enough representa-tions are available to handle these very specific fields.
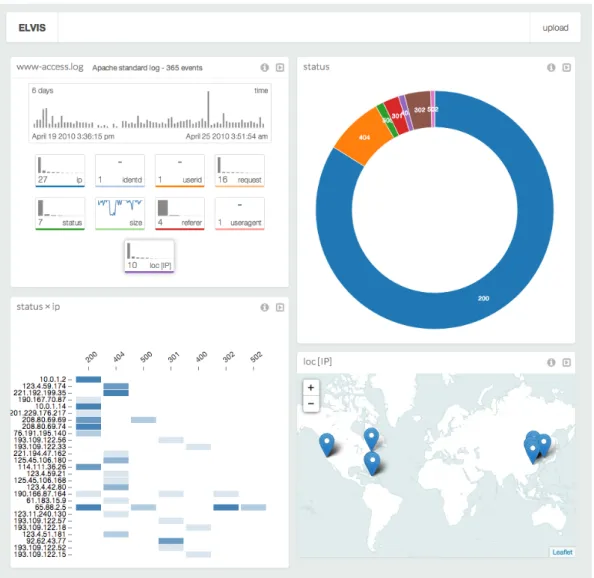
The chosen representation is then scaled and configured based on the values computed during the vertical augmenta-tion for each field. Finally, the representaaugmenta-tion is created and displayed on the screen. Fig. 3 shows an example of various representations obtained from the apache log. The pie chart on the upper right shows the proportions of the various val-ues in the categorical field status. The adjacency matrix on the bottom left exhibits the relations between the two categorical fields status and IP. Finally, the map on the bottom right corner shows the locations of the values of the geographical field loc(IP).
5.
IMPLEMENTATION AND
EXPERIMEN-TATIONS
We implemented ELVIS using standard web technologies: HTML5, Javascript, CSS and SVG. The representations are built using the D3.js Javascript library [4] which enables flex-ible yet semantically meaningful creation of data visualiza-tions. In addition, we chose to use the D3.chart library from the Miso project [15] to better build reusable and extensible charts.
We also created multiple parsers for multiple log formats. Currently, the prototype can handle the following log for-mats:
• syslog standard log format
• extended auth.log format based on syslog
• apache standard used both by apache access and apache media log files
• Snort IDS log format • VAST firewall log format
In order to test our tool, we used the 2010 Honeynet vi-sualization challenge dataset [14]. This dataset contains log files that were gathered on a real compromised machine. We performed our experimentations on a MacBook Pro with 4GB of memory, a 2.5GHz Intel Core i5 processor and a GeForce GT 330M graphic card with 512MB of memory. We used Google Chrome version 28.
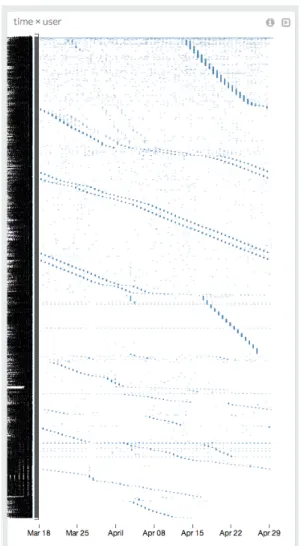
We explored the various log files of the dataset using ELVIS. We found many interesting patterns, including the one on Fig. 4 displaying user authentications (successful or not) according to time. In this representation, we see that large numbers of bursts of authentication attempts are made for numerous user names with no further attempts for a given user name once the burst is over. The cascade like patterns of similar bursts indicate that these attempts are very probably coordinated.
During our tests, we were satisfied to see that most repre-sentations that were automatically selected by ELVIS gener-ally made sense. At no point did we feel the need to resort to complex or custom visualization: once we discovered a specific pattern in a given log file, we were more inclined to repeat the process again with simple visualizations rather than add more fields to the current one.
Figure 4: Representation of the fields user and time from the auth.log file.
Nevertheless, our tests showed some limitations of our so-lution. First, we felt that ELVIS was lacked a mechanism allowing us to visually filter records according specific values in specific fields. We are currently working on this topic (cf. Section 7).
Performance was another issue. While there were no prob-lems with handling log files no bigger that a few thousand records, ELVIS took up to a few minutes to handle files con-taining hundreds of thousands of records. However we are considering moving parts of the process to servers to allevi-ate this issue (cf. Section 7).
6.
RELATED WORKS
Numerous security-oriented visualization tools are specific to a certain log file format. For instance, ClockView [7] and PeekKernelFlows [19] use NetFlow logs to monitor large IP spaces over long periods. NetBytes Viewer [12] also uses NetFlow logs to focus on the communications of a single host/subnetwork, and is implemented in the more recent project FloViz [13], which offers more visualization options. TNV [6] represents pcap files in a way that allows better comprehension of the communications between hosts on a network. Finally, [1] provides a representation to make it
easier to understand StealthWatch IDS logs. In contrast with these proposals, ELVIS is designed to provide relevant representations for all types of security-related log files.
Tools such as PicViz [16] and SeeSoft [5] follow a very dif-ferent approach. In a similar way to ELVIS, they handle numerous types of log files, but in contrast with ELVIS, they provide a single type of representation. PicViz pro-vides parallel plots for detecting correlations, while SeeSoft provides a color coded global view of log files.
Tableau Public [8] and Many Eyes [18] are quite close to ELVIS in a sense that they accept many types of data files and can generate many different representations. However, they let the user choose by him or herself the representa-tion and provides no guidance for what the most relevant representation could be. They also require the user to have a quite precise idea of what he or she is looking for in the dataset. We believe that the automatic choice of representa-tions makes ELVIS a real help for the user who can explore the dataset without a priori knowledge.
AutoVis [21] and the automatic “Show Me” function pro-vided by the Tableau ecosystem [9] are probably most closely related tools to ours. AutoVis accepts a large array of data files and performs automatic analysis on these files, while Tableau provides assistance in creating custom visualiza-tions and dashboards. According to the analysis results and data input choices, they propose many different representa-tions that help the user to understand datasets. Neither of them make use of any a priori knowledge on the dataset. In contrast, with ELVIS, the dataset extension and the repre-sentation selection are informed by the types of the fields. The information used for these operations is relevant in the context of security and means something to the user. Fur-thermore, the summary view is designed to be concise and expressive for the security expert. As a consequence, we be-lieve that while less versatile, ELVIS benefits from its secu-rity orientation to provide more suited visual representations for the security experts.
7.
CONCLUSIONS AND FUTURE WORKS
In this article, we presented ELVIS, a security-oriented log visualization tool that allows security experts to explore vi-sually numerous types of log files. In order to automatically select relevant representations, ELVIS uses information on the type of each field. This way, it can both produce concise but expressive summary views for the whole log file as well as a proper detailed views for the fields that are selected by the user. If new types of log files have to be used, the user only has to provide a regular expression allowing to parse each line of the log file as well as the type and label of each field.
This way, ELVIS accomplishes its two objectives:
• It allows security experts with no experience in visual-ization to benefit from adequate visual representations for their log files.
• Security experts can input their knowledge of log for-mats and types into the system without having to spec-ify their visual usage or the outcomes while obtaining valid representations for their log files.
The tests have demonstrated that ELVIS is useful to vi-sually explore security log files, allowing us to quickly notice
relevant facts. However, they also exhibited some limita-tions.
First, further work is still necessary for allowing the user to make selections in the various detailed views. Adding brushing and zooming capacities would let users explore and drill-down into data to truly make use of each representa-tion. This part of the work is in progress and currently works for the pie charts and for the bar charts: the different repre-sentations are synchronized with the data selected in the pie charts or bar charts. We should mention that this aspect is a strong argument toward the limitation of the number of representations in ELVIS: each new representation needs to have a relevant selection mechanism, which may be difficult to manage in very complex representations.
Second, representations are currently created only by in-teracting with the dataset summaries. In the same manner, further representations could also be produced from these initial representations, making data exploration a progres-sive drill-down process.
Third, in its current state, each dataset (i.e., each log file) is isolated from the others and multiple datasets cannot be combined for exploration even if more that one have been imported. Selections could include multiple datasets to cor-relate between them and combine information. The same logic applies to the visualizations, which could also foresee-ably be combined into composite visualizations.
Finally, thanks to the tests, we also saw that ELVIS still needs optimization. While processing the 365 events of the apache access log file seemed instantaneous, the 102 000 events of the auth.log file took more than two minutes. Adding external server components would move most of the processing away from the client, possibly using tools like Splunk for instance, which have proven effective at sim-plifying log analysis and correlation [11]. This would also open possibilities for collaborative or remote visualization sessions.
8.
ACKNOWLEDGEMENTS
We would like to thank the anonymous reviewers for their helpful and positive comments which helped to improve the paper, as well as the DGA-MI for financing this research project.
9.
REFERENCES
[1] K. Abdullah and C. Lee. IDS RainStorm : Visualizing IDS Alarms Workshop on Visualization for Computer Security. pages 1–10.
[2] A. D. Amico and K. Whitley. The Real Work of Computer Network Defense Analysts The Analysis Roles and Processes that Transform. pages 19–37. [3] J. Bertin. Semiology of Graphics: Diagrams,
Networks, Maps. University of Wisconsin Press. [4] M. Bostock, V. Ogievetsky, and J. Heer. D3:
Data-Driven Documents. IEEE transactions on visualization and computer graphics, 17(12):2301–9, Dec. 2011.
[5] S. G. Eick, M. C. Nelson, and J. D. Schmidt. Graphical analysis of computer log files. Commun. ACM, 37(12):50–56, Dec. 1994.
[6] J. R. Goodall and W. G. Lutters. Preserving the Big Picture : Visual Network Traffic Analysis with TNV. pages 47–54.
[7] C. Kintzel, J. Fuchs, and F. Mansmann. Monitoring Large IP Spaces with ClockView.
[8] J. Mackinlay. Tableau Public : Helping Everyone Tell Stories with Data on the Web. Analysis, 2010. [9] J. Mackinlay, P. Hanrahan, and C. Stolte. Show me:
automatic presentation for visual analysis. IEEE Transactions on Visualization and Computer Graphics, 13(6):1137–1144, 2007.
[10] A. Oliner, A. Ganapathi, and W. Xu. Advances and challenges in log analysis. Communications of the ACM, 55(2):55–61, 2012.
[11] J. Stearley, S. Corwell, and K. Lord. Bridging the gaps: joining information sources with splunk. In Proceedings of the 2010 workshop on Managing systems via log analysis and machine learning
techniques, SLAML’10, pages 8–8, Berkeley, CA, USA, 2010. USENIX Association.
[12] T. Taylor, S. Brooks, and M. John. NetBytes Viewer : An Entity-based Netflow Visualization Utility for Identifying Intrusive Behavior.
[13] T. Taylor, D. Paterson, J. Glanfield, C. Gates, S. Brooks, and J. McHugh. FloVis: Flow Visualization System. 2009 Cybersecurity Applications Technology Conference for Homeland Security, pages 186–198, 2009.
[14] The Honeynet Project. Forensic Challenge 10 -”Attack Visualization” | The Honeynet Project, http://www.honeynet.org/node/781.
[15] The Miso Project. The Miso Project :: d3.chart, http://misoproject.com/d3-chart/.
[16] S. Tricaud. Picviz: Finding a needle in a haystack. In Proceedings of the First UNSENIX Workshop on the Analysis of System Logs (WASL), 2008.
[17] E. R. Tufte. Envisioning Information. Graphics Press, 4th printing edition, 1990.
[18] F. B. Vi´egas, M. Wattenberg, F. V. Ham, J. Kriss, and M. Mckeon. Many Eyes : A Site for Visualization at Internet Scale. (August), 2007.
[19] C. Wagner, A. Dulaunoy, S. A. Ses, and T. Engel. PeekKernelFlows : Peeking into IP flows. pages 0–5, 2010.
[20] L. Wilkinson. The Grammar of Graphics. Springer, 1999.
[21] G. Wills and L. Wilkinson. AutoVis: Automatic visualization. Information Visualization, 9(1):47–69, Dec. 2008.