HAL Id: hal-00997090
https://hal.archives-ouvertes.fr/hal-00997090
Submitted on 27 May 2014
HAL is a multi-disciplinary open access archive for the deposit and dissemination of sci-entific research documents, whether they are pub-lished or not. The documents may come from
L’archive ouverte pluridisciplinaire HAL, est destinée au dépôt et à la diffusion de documents scientifiques de niveau recherche, publiés ou non, émanant des établissements d’enseignement et de
About the role of phase matching between a coated
microsphere and a tapered fiber: experimental study
Davor Ristic, Alphonse Rasoloniaina, Andrea Chiappini, Patrice Féron,
Stefano Pelli, Gualtiero Nunzi-Conti, Mile Ivanda, Giancarlo Righini, Gilles
Cibiel, Maurizio Ferrari
To cite this version:
Davor Ristic, Alphonse Rasoloniaina, Andrea Chiappini, Patrice Féron, Stefano Pelli, et al.. About
the role of phase matching between a coated microsphere and a tapered fiber: experimental
study. Optics Express, Optical Society of America - OSA Publishing, 2013, 21 (18), pp.20954. �10.1364/OE.21.020954�. �hal-00997090�
About the role of phase matching between a
coated microsphere and a tapered fiber:
experimental study
Davor Ristić,1,*Alphonse Rasoloniaina,2 Andrea Chiappini,1 Patrice Féron,2 Stefano Pelli,3 Gualtiero Nunzi Conti,3 Mile Ivanda,4 Giancarlo C. Righini,3,5 Gilles Cibiel,6 and
Maurizio Ferrari1 1
IFN – CNR CSMFO Lab., Via alla Cascata 56/C Povo, 38123 Trento, Italy
2FOTON-Systèmes Photoniques (CNRS-UMR 6082), ENSSAT, 6 rue de Kerampont, CS 80518, 22305 Lannion cedex,
France
3IFAC - CNR, MiPLab., 50019 Sesto Fiorentino, Italy 4Institut Ruđer Bošković, Bijenička cesta 54, 10000 Zagreb, Croatia
5Museo Storico della Fisica e Centro di Studi e Ricerche “Enrico Fermi”, Piazza del Viminale 1, 00184 Roma, Italy 6Centre National d’Etudes Spatiales (CNES), 31401 Toulouse Cedex 9, France
Abstract: Coatings of spherical optical microresonators are widely
employed for different applications. Here the effect of the thickness of a homogeneous coating layer on the coupling of light from a tapered fiber to a coated microsphere has been studied. Spherical silica microresonators were coated using a 70SiO2 – 30HfO2 glass doped with 0.3 mol% Er3+ ions. The coupling of a 1480 nm pump laser inside the sphere has been assessed using a tapered optical fiber and observing the 1530-1580 nm Er3+ emission outcoupled to the same tapered fiber. The measurements were done for different coating thicknesses and compared with theoretical calculations to understand the relationship of the detected signal with the whispering gallery mode electric field profiles.
©2013 Optical Society of America
OCIS codes: (310.1860) Deposition and fabrication; (140.3945) Microcavities; (160.5690) Rare-earth-doped materials; (160.4760) Optical properties; (250.5230) Photoluminescence.
References and links
1. J. W. S. Rayleigh, “The problem of the whispering gallery,” Philos. Mag. 20, 1001–1004 (1910).
2. G. C. Righini, Y. Dumeige, P. Féron, M. Ferrari, G. Nunzi Conti, D. Ristić, and S. Soria, “Whispering gallery mode microresonators: fundamentals and applications,” Riv. Nuovo Cim. 34, 435–488 (2011).
3. A. Chiasera, Y. Dumeige, P. Feron, M. Ferrari, Y. Jestin, G. Nunzi-Conti, S. Pelli, S. Soria, and G. C. Righini, “Spherical whispering-gallery-mode microresonators,” Laser Photon. Rev. 4(3), 457–482 (2010).
4. A. B. Matsko and V. S. Ilchenko, “Optical resonators with whispering-gallery modes—part I: basics,” IEEE J. Sel. Top. Quantum Electron. 12(1), 3–14 (2006).
5. V. S. Ilchenko and A. B. Matsko, “Optical resonators with whispering-gallery modes —part II: applications,” IEEE J. Sel. Top. Quantum Electron. 12(1), 15–32 (2006).
6. I. Razdolskiy, S. Berneschi, G. N. Conti, S. Pelli, T. V. Murzina, G. C. Righini, and S. Soria, “Hybrid microspheres for nonlinear Kerr switching devices,” Opt. Express 19(10), 9523–9528 (2011).
7. S. I. Shopova, G. Farca, A. T. Rosenberger, W. M. S. Wickramanayake, and N. A. Kotov, “Microsphere whispering-gallery-mode laser using HgTe quantum dots,” Appl. Phys. Lett. 85(25), 6101–6103 (2004). 8. F. Lissillour, D. Messager, G. M. Stéphan, and P. Féron, “Whispering-gallery-mode laser at 1.56 mum excited
by a fiber taper,” Opt. Lett. 26(14), 1051–1053 (2001).
9. S. M. Spillane, T. J. Kippenberg, and K. J. Vahala, “Ultralow-threshold Raman laser using a spherical dielectric microcavity,” Nature 415(6872), 621–623 (2002).
10. D. W. Vernooy, A. Furusawa, N. Ph. Georgiades, V. S. Ilchenko, and H. J. Kimble, “Cavity QED with high-Q whispering gallery modes,” Phys. Rev. A 57(4), R2293–R2296 (1998).
11. S. Soria, F. Baldini, S. Berneschi, F. Cosi, A. Giannetti, G. N. Conti, S. Pelli, G. C. Righini, and B. Tiribilli, “High-Q polymer-coated microspheres for immunosensing applications,” Opt. Express 17(17), 14694–14699 (2009).
12. J. Li, H. Lee, T. Chen, and K. J. Vahala, “Low-pump-power, low-phase-noise, and microwave to millimeter-wave repetition rate operation in microcombs,” Phys. Rev. Lett. 109(23), 233901 (2012).
13. Y. K. Chembo and N. Yu, “On the generation of octave-spanning optical frequency combs using monolithic whispering-gallery-mode microresonators,” Opt. Lett. 35(16), 2696–2698 (2010).
14. L. Mescia, P. Bia, M. De Sario, A. Di Tommaso, and F. Prudenzano, “Design of mid-infrared amplifiers based on fiber taper coupling to erbium-doped microspherical resonator,” Opt. Express 20(7), 7616–7629 (2012). 15. V. S. Ilchenko, A. A. Savchenkov, A. B. Matsko, and L. Maleki, “Dispersion compensation in
whispering-gallery modes,” J. Opt. Soc. Am. A 20(1), 157–162 (2003).
16. A. L. Aden and M. Kerker, “Scattering of electromagnetic waves from two concentric spheres,” J. Appl. Phys. 22(10), 1242–1246 (1951).
17. M. Han and A. Wang, “Temperature compensation of optical microresonators using a surface layer with negative thermo-optic coefficient,” Opt. Lett. 32(13), 1800–1802 (2007).
18. J. C. Knight, G. Cheung, F. Jacques, and T. A. Birks, “Phase-matched excitation of whispering-gallery-mode resonances by a fiber taper,” Opt. Lett. 22(15), 1129–1131 (1997).
19. B. E. Little, Y. P. Laine, and H. A. Haus, “Analytic theory of coupling from tapered fibers and half-blocks into microsphere resonators,” J. Lightwave Technol. 17(4), 704–715 (1999).
20. A. Chiappini, A. Chiasera, C. Armellini, S. Varas, A. Carpentiero, M. Mazzola, E. Moser, S. Berneschi, G. C. Righini, and M. Ferrari, “gel-derived photonic structures: fabrication, assessment, and application,” J. Sol-Gel Sci. & Technol. 60, 408–425 (2011).
21. R. R. Gonçalves, G. Carturan, M. Montagna, M. Ferrari, L. Zampedri, S. Pelli, G. C. Righini, S. J. L. Ribeiro, and Y. Messaddeq, “Erbium-activated HfO2-based waveguides for photonics,” Opt. Mater. 25(2), 131–139
(2004).
1. Introduction
Glass microspheres are microsized resonators supporting the so-called [1] Whispering Gallery Modes(WGM) with a very high Q-factor and a low mode volume [2–5]. This makes them very useful for different applications where high light density (non linear optics [6], lasing [7–9], quantum electrodynamics [10]) or sharp resonances (sensing [11], metrology [12,13]) are required. In many cases, a coating layer is useful to manage the confined light and/or to functionalize the sphere surface. A common way to couple light inside a microsphere is using evanescent coupling from a tapered fiber [2,14]. The coupling strength can depend on two parameters: the overlap of the evanescent fields and the phase-matching between the whispering gallery modes in the sphere and the propagating mode of the taper. Since the taper waist usually changes gradually from the fiber diameter to the minimum value at the center of the taper the evanescent field overlap can be controlled very easily by changing the coupling point between the taper and the sphere. It is much more difficult to change the phase matching condition since it is dependent primarily on the refractive index of the sphere which cannot be changed once the sphere is produced. Furthermore, it would be very difficult to compare bulk spheres of different materials since, in addition to the change of the refractive index, a number of other parameters such as surface roughness and ellipticity may also change. A possible approach in order to eliminate the need for an adjustable air gap between the microcavity and the evanescent coupler is to make use of a graded-index microsphere [15]. If, however, one uses an uniform coating with constant refractive index, playing with its thickness and composition it is possible to tailor the effective refractive index of the WGMs [2], which assumes a value in between the values of the effective refractive index of WGMs in a blank silica sphere and in a bulk sphere fully made from the coating material. In view of the application to microlaser fabrication [7], here a silica-hafnia layer doped with Er3+ ions was coated on a silica microsphere. The dip coating method was employed to coat the sphere because it enables to measure the WGM luminescence also during the dipping process [2]. By measuring the intensity of luminescence outcoupled from the microsphere as a function of the coating thickness we have been able to assess the criticity of the phase matching condition.
2. Theoretical background
To calculate the eigenfrequencies of the whispering gallery modes of a coated sphere the Aden-Kerker generalization of the Mie scattering theory can be used [16,17]. The radial dependence of the electric field of the WGMs is given by the Bessel function in the core, a
linear combination of the Bessel and Neumann functions in the coating and by the Neumann function outside of the sphere. The continuity of the tangential components of the electric and magnetic fields at the core-coating (r1) and coating-air (r2) interfaces leads to the following
system of equations: 1 1 1 0 1 1 1 2 2 0 2 2 2 0 2 ( ) ( ) ( ) '( ) '( ) '( ) ( ) ( ) ( ) '( ) '( ) '( ), s c c l s l c l c l s l c l c l c l c c l l c l c l c kn r kn r kn r kn r kn r kn r kn r kn r kn r kn r kn r kn P P P P P P r ψ ψ χ ψ ψ χ ψ α β α β α βχ γχ α ψ β χ γ χ = + = + + = + = (1)
where k = 2π/λ, ns, nc, n0 are the refractive indices of the sphere core, coating and surrounding
medium respectively, ψl(x) = xjl(x) and χl(x) = xnl(x) where jl and nl are the spherical Bessel
and Neumann functions respectively, Ps = ns, Pc = nc, P0 = n0 for the transversal electric (TE)
and Ps = 1/ns, Pc = 1/nc, P0 = 1/n0 for the transversal magnetic (TM) modes. To find the
eigenfrequencies of the WGMs the zeros of the determinant of this system of equations have been calculated numerically. Each mode will be characterized by three integer number n, l and m, where n, l-|m| and m correspond to the number of nodes of the wave function in the radial, azimuthal and polar directions respectively.
0 20 40 60 80 100 120 140 1.30 1.35 1.40 1.45 1.50 1.55 1.60
70-30 SiO2-HfO2 sphere
0.8 µm 1.5 µm 0.4 µm 2 µm 1 µm 0.6 µm
Effective re
fr
acti
ve i
nde
x
R (
µ
m )
0.2 µm SiO2 spheren=0
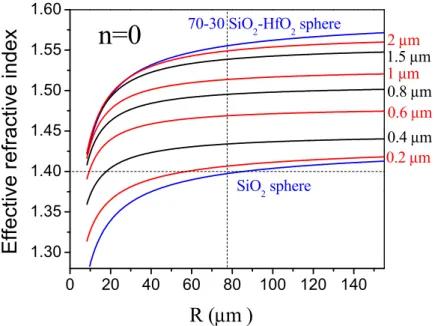
Fig. 1. The effective refractive index of the 70SiO2-30HfO2 coated microsphere as a function
of the radius of the silica sphere for the fundamental equatorial (n = 0; l-|m| = 0) TE mode at 1560 nm. The refractive index of the sphere is 1.44 and of the coating 1.6. The coating thicknesses, given in μm, are also reported in the figure. The blue lines correspond to the border cases of no coating (blank sphere) or of very thick coating (bulk sphere with n = 1.6). The horizontal dashed line corresponds to the effective refractive index of the propagation mode of a silica fiber taper with a waist of 3 μm. The vertical dashed line correspond to a silica sphere diameter of 155 μm which is the diameter of the sphere coated in our experiment.
Usually, the mode which can be coupled to the most efficiently is the n = 0 fundamental mode because it is the mode which is confined closest to the surface and therefore will have the largest part of its electric filed extending outside of the sphere. The l-|m| = 0 mode is the equatorial mode. The internal modes are the modes with n>0 and the azimuthal modes those with l-|m|>0. Once the eigenfrequencies k are known, the effective refractive index
(propagation constant) of the mode can be defined as l/(kR) [18] however the projection of the effective refractive index on the equatorial plane is defined as neff = m/(kR) [19]. In the rest of the paper when mentioning the effective refractive index of a mode (neff) we will be always referring to the projection on the equatorial plane neff = m/(kR) since it is this projection that is collinear with the propagating mode of the taper and will be responsible for the phase-matching of the WGMs with the propagating mode of the taper. Figure 1 shows the effective index of the TE modes as a function of the silica sphere diameter for the fundamental equatorial (n = 0; l-|m| = 0) mode at 1.56 μm and for the 70SiO2-30HfO2 coating refractive index of 1.6. We can see that the effective refractive index changes gradually between the values for a blank SiO2 sphere and a blank 70SiO2-30HfO2 sphere as the coating thickness increases. For coating thicknesses above 2 μm the sphere is very close to the bulk 70SiO2 -30HfO2 sphere case, as expected since the localization depth of the fundamental equatorial mode near the surface is of the order of magnitude of the light wavelength (1.54 μm).
0.0 0.2 0.4 0.6 0.8 1.0
core
coating
air
0.0 0.2 0.4 0.6 0.8 1.0Electri
c fi
eld profile
n=1 0.0 0.5 1.0 1.5 2.0 2.5 3.0 0.0 0.2 0.4 0.6 0.8 1.0 n=2 d/ µmIntegrated apsolut
e electric field
n=0
-1.0 -0.5 0.0 0.5 1.0air
coating
d=1µmcore
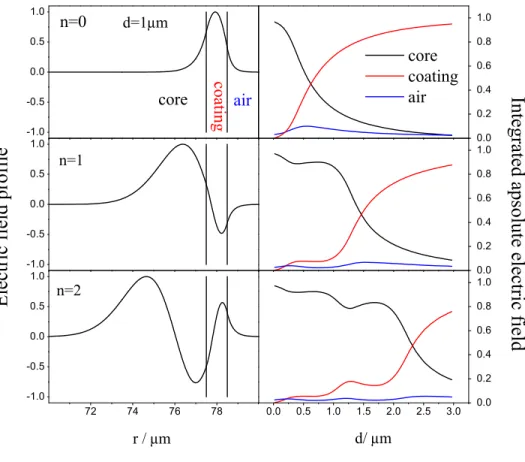
-1.0 -0.5 0.0 0.5 1.0 72 74 76 78 -1.0 -0.5 0.0 0.5 1.0 r / µmFig. 2. The electric field profiles for a 1 μm coating thickness (left) and for the integral of the absolute electric field inside the sphere core, coating and air versus the coating thicknesses (right) for a sphere 155 μm in diameter for the fundamental (n = 0) and two first internal modes (n = 1,2) closest to 1560 nm. The vertical lines in the left part of the figure correspond to the core-coating and air-coating interfaces.
Since the refractive index of the taper is 1.44, the effective index of the propagation mode of the taper will be 1.44 or less. The phase mismatch Δneff is defined as the difference between
the effective refractive index of the taper and that of the WGMs. Therefore from Fig. 1 we can see that with increasing thickness from 0 to 2 μm the phase mismatch between the
fundamental equatorial mode of the sphere and the taper will increase, saturating to a certain value above 2 μm thickness. If the coupling condition is dependent on the phase mismatch as suggested in literature [19] we would expect a decrease of the coupling efficiency with increasing thickness. On the other hand, when increasing the thickness the overall percentage of the electric field inside the coating will increase. If the coating is doped with an optically active material we expect that the luminescence intensity will be directly proportional to the percentage of the electric field inside the coating. Figure 2 shows the distribution of the integrated electric field inside the sphere core (black curve), coating (red curve) and surrounding medium (air) (blue curve) versus the coating thickness for a WMG at 1560 nm and for a sphere 155 μm in diameter. We see that when increasing the coating thickness from 0 to 4 μm the percentage of the electric field inside the coating increases, saturating above 4 μm. Also it is interesting to note that the percentage of the electric field inside the surrounding medium (air) does not exhibit significant variation with increasing thickness, staying in the range 5-10% and having a maximum at around 0.5 μm.
3. Experimental
The microspheres were produced by melting the tip of a standard optical telecommunications fiber. The diameter of the microsphere was found to be 155 ± 5 μm using a standard optical microscope. The microsphere was coated with a film of composition 70SiO2-30HfO2 activated with 0.3% mol Er3+. The films were coated using the dip coating technique. The sol was prepared by mixing a solution of Si(OC2H5)4 (TEOS), HCl, H2O, CH3CH2OH (ethanol) and HfOCl2. The molar ratio between TEOS, water and the catalyst (HCl) was n(H2O): n(Si(OC2H5)4): n(HCl) = 200:100:1. The molar ratio between the TEOS and HfOCl2 was chosen to be n(Si(OC2H5)4): n(HfOCl2) = 70:30 on the basis of previous experiments [20]. The overall amount of Si and Hf in the sol was controlled so that c(Si(OC2H5)4) + c(HfOCl2) = 4.48 10−4 mol/mL in order to have a sol viscosity which makes the dipping rate 30 nm/dip. Er(NO3)3 x 5H2O was added to activate the film so that the molar concentration of Er3+ in the sol is 0.3% mol. The mixture of TEOS, HCl and H2O was prehydrolised at 65 °C for 1 hour before adding the HfOCl2 and the Er (NO3)3 x 5H2O. The entire mixture was then stirred for 16 h until the sol became transparent. Each microsphere was dipped 30 times into the sol. The dipping speed was 40 mm/min and the dipping time 20 s. After each dip the microspheres were densified at 900 °C for 50 s and after every 10 dips an additional densification was made for 2 min. At the end of the deposition a final densification for 5 min at 900 °C was made [21].
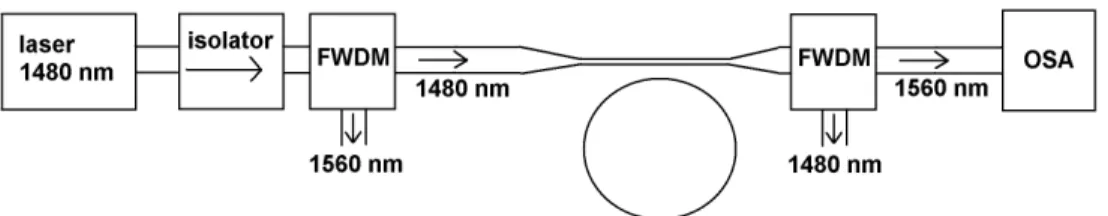
The measurement of the whispering gallery modes was done using a microsphere-taper coupling setup. A 1480 nm fiber diode laser was used for the pumping. The pump laser was passed through an optical isolator in order to eliminate the back reflection of the laser. The pump laser was made pass through a tapered fiber with a waist radius less than 3 μm in order to achieve coupling with the microsphere. The coupling is achieved by moving the taper close to the sphere so that the evanescent field of the taper and of the whispering gallery modes of the microsphere overlap. The pump laser is coupled inside the microsphere where it is absorbed by Er3+ ions inside the coating which in turn emit in the C-band wavelength region around 1550 nm. The emission will be greatly enhanced at wavelengths which correspond to the WGMs of the microsphere. This emitted light is then coupled out of the sphere and into the taper. Since the 1480 nm pump laser line is broad enough to encompass several WGMs the coupling of the 1480nm laser should not depend on the actual WGM spectra since we will always be able to couple to a number of modes. The detected luminescence signal should therefore depend primarily on the outcoupling efficiency of the 1550 nm emission to the taper. A C/S band filter wavelength division multiplexer (FWDM) was used to filter out the S-band 1480 nm pump line and to pass through to the detector only the C-band emission. The signal was detected by a Anritsu MS9710B optical spectrum analyzer (OSA). The scheme of the experimental setup is reported in Fig. 3.
Fig. 3. The scheme of the experimental setup.
4. Results
The sphere was coated with 0.3 mol% Er3+ 70SiO2-30HfO2 thin film. The refractive index of the film is around 1.6 [21]. The dipping rate when dipping on a flat 3” silica slide using the same protocol is around 30 nm/dip as measured by m-line [21]. Although it is possible that the dipping rate on a microsphere can differ from the dipping rate on a silica slide, we assume that this difference is quiet small. Figure 4 shows the WGM photoluminescence spectra of a 155 μm sphere after 20, 25, 30, 35, 40 and 45 dips, respectively. The background signal in absence of coupling is also reported for each spectrum. All the measurements were done paying special attention to always keep the same coupling point between the sphere and the taper. The measurements were always done at the same point along the taper, in the equatorial plane of the sphere and in contact. A gradual increase of the luminescence intensity with the increase of the coating thickness can clearly be observed. In Fig. 5 the dependence of the average integrated luminescence intensity is presented as a function of the number of dips and of the percentage of the fundamental WGM electric field inside the coating. Computations have been made as described above, by assuming an average dipping rate of 30 nm/dip. Since the coupling point is never absolutely the same each time we take the sphere from the dip coating apparatus to the sphere-taper coupling setup, a series of measurements was made varying slightly the coupling point in a region in which we estimate that the sphere-taper contact point can vary between different alignments. From these measurements we estimated the relative experimental errors reported as vertical error bars in Fig. 5. The increase of the luminescence intensity with the increase of the coating thickness is evident. This is in agreement with the fact that the amount of the WGM electric field inside the active layer increases with increasing thickness as mentioned above. On the other side the coupling efficiency should decrease with increasing thickness, because of an increased phase-mismatch, and this should lead to the decrease of the WGM luminescence intensity. We can therefore conclude that the phase matching condition is not the most important one for this kind of coupling scheme. The fact that increased thickness means more active material at the surface of the sphere appears to be more important. The increase of the luminescence intensity with the increase of the coating thickness is evident. This is in agreement with the fact that the amount of the WGM electric field inside the active layer increases with increasing thickness as mentioned above. On the other side the coupling efficiency should decrease with increasing thickness, because of an increased phase-mismatch, and this should lead to the decrease of the WGM luminescence intensity. We can therefore conclude that the phase matching condition is not the most important one for this kind of coupling scheme. The fact that increased thickness means more active material at the surface of the sphere appears to be more important.
1 5 4 0 1 5 6 0 1 5 8 0 0 2 0 4 0 6 0 1 5 4 0 1 5 6 0 1 5 8 0 1 5 4 0 1 5 6 0 1 5 8 0 0 2 0 4 0 6 0 1 5 4 0 1 5 6 0 1 5 8 0 1 5 4 0 1 5 6 0 1 5 8 0 0 2 0 4 0 6 0 1 5 4 0 1 5 6 0 1 5 8 0
2 0 d ip
W a v e le n g th (n m )
2 5 d ip
P (pW)
3 0 d ip
3 5 d ip
4 0 d ip
4 5 d ip
Fig. 4. The WGM luminescence spectra of the 0.3 mol% Er3+ 70SiO
2-30HfO2 coated
microsphere after different number of dips. The background signal in absence of coupling is also reported for each spectrum.
20 25 30 35 40 45 0 5 10 15 20 45 50 55 60 65 70 75 80
Number of dips % of e. f. inside the coating
In tegra ted average lumin es ce (pW)
Fig. 5. The average integrated luminescence in the 1535-1585 nm range for the 0.3 mol% Er3+
70SiO2-30HfO2 coated sphere in respect to the number of dips and to the percentage of the
fundamental WGM electric field (e. f.) inside the coating as calculated from the number of dips.
5. Discussion
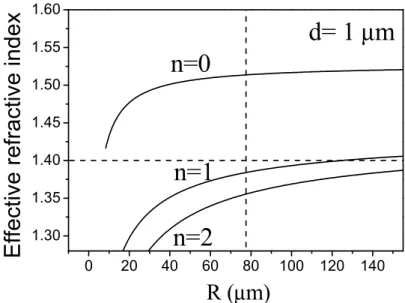
To explain the fact that the intensity of the luminescence increases linearly with the coating thickness we first have to identify which modes are the ones that are excited. Let us first consider the internal modes. The excitation of internal modes could explain the luminescence intensity behavior since the internal modes have a lower effective refractive index than the fundamental mode. In Fig. 6 it can be seen that the first internal mode (n = 1) for 1 μm coating thickness has a much better phase-matching with the tapered fiber than the fundamental mode. We expect, however, that the internal modes excite less active material, since they are confined deeper in the sphere with respect to the fundamental mode and their electric field is located closer to the sphere core, as it can be seen in Fig. 2. Therefore we can exclude that they could give a significant contribution to the erbium emission while the major contribution is expected to be from the fundamental (n = 0) modes which are localized in the optically active coating. We can prove that the observed modes (Fig. 4) are not the internal modes, by measuring the experimental free spectral range (FSR) of the observed modes and comparing them with the theoretical expectations for the fundamental and internal modes.
0 20 40 60 80 100 120 140 1.30 1.35 1.40 1.45 1.50 1.55 1.60
E
ffective refract
ive index
n=2
n=1
n=0
d= 1
µ
m
R (
µ
m)
Fig. 6. The effective refractive index of the 70SiO2-30HfO2 coated microsphere as a function
of the radius of the silica sphere for the fundamental equatorial (n = 0; l-|m| = 0) TE mode at 1560 nm and for the fundamental and the first two internal modes for a 1 μm coating thickness. The refractive index of the sphere is 1.44 and of the coating 1.6. The horizontal dashed line corresponds to the effective refractive index of the propagation mode of a silica fiber taper with a waist of 3 μm. The vertical dashed line correspond to a silica sphere diameter of 155 μm which is the diameter of the sphere coated in our experiment.
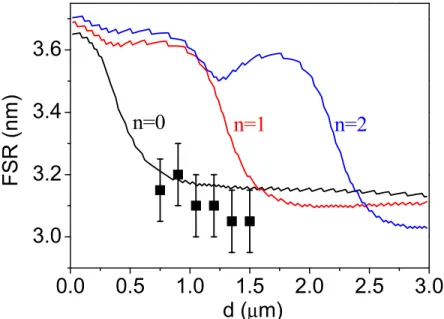
Figure 7 shows the measured FSRs for different numbers of dips as well as the theoretical calculations for the FSR for the fundamental (n = 0) and the first two internal modes (n = 1,2). We can see that in the thickness range from 20 to 45 dips (0.6-1.25 μm) the free spectral range is constant around 3.1 nm which is in agreement with the expected behavior of the fundamental mode. The internal modes should have much larger FSRs for thicknesses lower than 1 μm. In particular the difference in the FSRs between the fundamental and the first internal mode for 1 μm thickness should be around 0.4 nm which is clearly distinguishable with the optical spectrum analyzer we have employed, which has a resolution of 0.07 nm. Therefore, we conclude that the observed modes cannot be assigned to the internal ones and that the thickness dependence of the luminescence intensity cannot be explained with the
better phase matching of the internal modes with respect to the fundamental modes. To explain the non-dependence of the luminescence intensity on the phase matching we can consider the fact that the coupling region is very localized in space. The coupling region will extends from the point where the taper is in immediate contact with the sphere to the point where the distance between the fiber and the sphere becomes larger than the length of the evanescent tail of the WGMs. Such a length for our spheres is about 200-250 nm depending on the coating thickness. Since the radius of the sphere is 155 μm, just using simple geometry we conclude that the effective coupling length should be around 15 μm, which corresponds to about 10 wavelengths. Let xλ be the number of wavelengths over the coupling length and Δneff
the phase mismatch defined above. When xλΔneff >>1 there is no coupling while if xλΔneff
<<1 the phase-matching condition would not influence the coupling at all. From Fig. 1 we
can see that in the case of the fundamental equatorial (n = 0; l-|m| = 0) mode for 1 μm thickness xλΔneff is more or less of the order of magnitude of 1 so that the phase-matching
condition should be greatly relaxed; some influence of the phase-matching, however, is still expected. We can further discuss the luminescence behavior by considering the coupling to the azimuthal modes. They are degenerate in frequency with respect to the equatorial mode but their effective refractive index is lower than of the equatorial l-|m| = 0 mode since the effective refractive index is defined as neff = m/(kR). Therefore, the different azimuthal modes
should give a quasi-continuum (dense distribution) of neff, its value for the equatorial mode
representing the upper limit of the distribution. The lower limit is bounded only by the fact that for very low m values the electric field will starts to expand over the fiber stem on which the sphere is attached. The spacing between two azimuthal modes is of the order of magnitude of 1/(kR)≈0.0015 which means that the phase-mismatch Δneff between the sphere and the taper
has to be less than 0.0015. This phase mismatch is not enough to accumulate a significant phase difference over the 15 μm long coupling region.
0.0
0.5
1.0
1.5
2.0
2.5
3.0
3.0
3.2
3.4
3.6
n=2
n=1
FSR (
n
m)
d (
µ
m)
n=0
Fig. 7. The theoretical calculation of the free spectral range for the fundamental (n = 0) and the first two internal modes (n = 1,2) around 1.56 μm for a sphere diameter of 155 μm in respect to the coating thickness and the experimentally measured values of the free spectral range (Fig. 4). The experimental bars in the image are the OSA resolution.
6. Conclusion
Using a suitable sol-gel deposition process we can gradually change the effective refractive index of a silica sphere by coating it with a material of known refractive index. We coated the microspheres with Er3+- activated silica-hafnia thin films and studied the effect of the increase of the coating thickness on the WGM luminescence intensity. We observed that the intensity of the luminescence increased linearly with the coating thickness. The role of coupling on the luminescence intensity behavior was discussed for different WGMs. From FSR measurements we demonstrated that the observed modes could not be assigned to the internal ones(n = 1,2).
Considering the quantum number m, we found that for the equatorial mode the phase-matching condition should be greatly relaxed but still present. For the azimuthal modes the phase mismatch is not enough to accumulate a significant phase difference over the coupling region that is very localized in space. We therefore conclude that in order to couple light in and out of a microsphere, the refractive index of the microsphere is not highly critical to achieve efficient coupling. Because of the high number of azimuthal modes, in fact, it is always possible to phase-match to one or more of these modes regardless of the sphere refractive index. This is a very important conclusion since it means that for practical applications of microspheres (such as micro-lasers or sensing) there is a high degree of freedom in the choice of the sphere material and coupling scheme, making it much easier to construct practical devices based on microspheres.
Acknowledgments
This research was performed in the framework of the NSBMO research project “Novel silicon based materials for optoelectronics” (2010-2013) of the Provincia Autonoma di Trento and the CNES R&T project SHYRO (2011-2014). A. R acknowledges support from the Conseil Régional de Bretagne. The authors are grateful to Cristina Armellini (IFN-CNR), Stefano Varas (IFN-CNR), Maurizio Mazzola (IFN-CNR) and Franco Cosi (IFAC-CNR) for their invaluable technical contribution. D.R and M.F. acknowledge extremely useful critical discussion with Yann Boucher (ENI Brest) and Yanne Chembo (FEMTO-ST).