Retrofitting and upgrading reinforced concrete moment resisting frame by
using expanded metal panels
PHUNG Ngoc Dung
Department of Construction – Hanoi Architectural University – Viet Nam
e-mail: [email protected], [email protected] André PLUMIER
Department of Structural Engineering, University of Liege – 1, Chemin des Chevreuils, B-4000 Liège
e-mail: [email protected]
ABSTRACT:
A new solution to enhance the seismic behaviour of reinforced concrete moment resisting frames (RC-MRF) is introduced. This solution is based on the use of expanded metal panels (EMP) to retrofit or upgrade existing frames in terms of increasing their stiffness, strength and ductility. The EMP will work as an additional lateral resisting system. Hysteretic behaviour of EMP is nearly the same as Steel Plate Shear Walls (SPSW) which are commonly used in US, Canada and Japan. The seismic behaviour of EMP has been tested by both experimental and numerical studies. A simplified model of EMP under cyclic shear loading is also proposed. To assess the efficiency of the retrofitting solution, many RC-MRF are designed in accordance with EC2 and EC8 and their capacity evaluated with reference to FEMA356. Static and dynamic nonlinear analyses are conducted on the simplified model of EMP. A comparison between the behaviour of the not retrofitted and upgraded structures shows that the proposed solution is effective in reducing seismic influences on the structures.
Keywords: Expanded Metal Panel; Hysteretic behaviour; Retrofitting RC moment resisting frames
1. INTRODUCTION
The response of a RC-MRF building subjected to severe seismic loads depends primarily on strength, stiffness and ductility of its members and on detailing of its individual component and of joints between its components. Many RC-MRF constructed and designed not according to modern seismic code such as EC8 [4] may not have enough ductility, strength or stiffness, leading to severe damages or even collapse during small earthquakes. Strengthening their components or increasing their stiffness and ductility with little disturbance to the building occupants to meet requirements of modern codes always pose a great challenge to the engineer. In the last decades, many retrofit systems such as steel braces, SPSW, aluminium shear wall and reinforced concrete shear walls (RC-SW) have been extensively studied and used to seismically retrofit and upgrade RC-MRF. These systems provide more additional lateral stiffness and strength and ductility to the structures.
The objective of this study is to present another seismic retrofitting system using Expanded Metal Panels or EMP. The EMP, loaded in shear, is experimentally and numerically studied. It is found that its behaviour is similar to that of shear walls made from metal such as SPSW. This study also investigates 4 RC planar frames, two being designed corresponding to only EC2 [3] and two others to both EC2 [3] and EC8 [4]. The two frames in the latter case are designed using elastic methods (lateral force and multi modal elastic ones) for a ‘type 1’ earthquake of EC8 with peak ground accelerations (PGA) equal to 0,15g and a soil type C. All frames are then evaluated to determine their capacities and deficiency by using nonlinear static and dynamic analyses. It is expected that the poor performance and deficiencies of the existing frames will be improved by the application of EMP. The seismic resisting capacities of the new frames are assessed in terms of maximum applied PGA resisted by the frames without and with EMP, the limits on inter-story drifts and the energy dissipation capacity.
2. BEHAVIOUR OF EMP UNDER SHEAR LOADING 2.1 Introduction
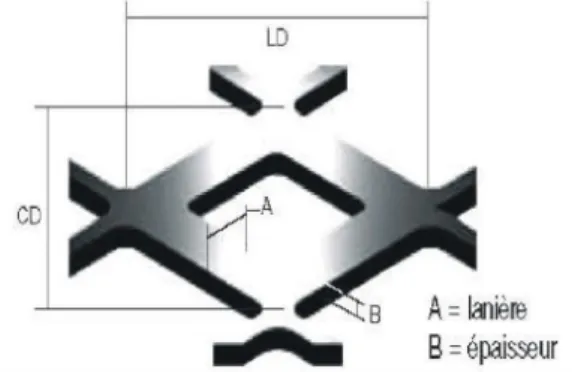
Expanded metal (EM) is a truss made from metal sheet by cuttings, cold-stretching and flattening [1], [2]. Cuttings and cold-stretching make a metal sheet become a three-dimension structure. It becomes a two-dimension sheet by flattening. An EM sheet, as shown in Figure 1, has many rhomb-shape stitches. Each rhomb-shape stitch has four bars with exactly the same dimensions; it is geometrically characterized by four dimensions – LD, CD (the diagonals), A (the width), and B (the thickness of the bars). These dimensions are illustrated in Figure 2.
Figure 1 – Fabrication of expanded metal sheets Figure 2 – An expanded metal rhomb-shape stitch
There are two types of EM product: normal or standard and flattened types. In the normal type, rhomb-shape stitches are connected together with overlaps at the end of each bar. In contrast, there is no overlap between stitches in flattened type as they are continuously connected together to form a flattened sheet. The EMP is automatically produced as rectangular panels having the dimensions of approximately as ±1250x±2500mm depending on geometrical characteristics of the EM stitches. Up to now there are no calculation and mechanical criteria for these types of material, so it is seldom used in structural applications. To exploit EMP to seismically retrofit RC-MRF, its behaviour in shear is experimentally and numerically studied. First, tensile tests are performed to characterise mechanical properties of bars of the EMP. Then, a series of tests on small and large EMP panels monotonically and cyclically loaded in shear is carried out to investigate their behaviour. Calibrating the tests by using FINELG, a fully nonlinear code developed at University of Liege, is then performed. It is observed that the results by the numerical simulation and by tests fit well together [1], [2].
2.2 A simplified behaviour model of the EMP loaded in shear by numerical approach
Each bar of a rhomb shape stitch is modelled as a 3D beam, having seven degree of freedoms and constant rectangular section with a simplified bilinear stress-strain material law [1, 2]. Linear elastic analysis defines the elastic stiffness. After that, the critical behaviour is examined to obtain several critical loads corresponding to different instability modes. The first mode is used to define the shape of the initial deformations for the full nonlinear analysis. Numerical simulations are performed under monotonic and cyclic shear loading with different types and dimensions of the EMP. Depending on the ratio between width and height of the EMP, they are catalogued as three groups: square panels; rectangular panels with ratio 2:1 and 3:1.
2.2.1 Monotonic behaviour of the EMP loaded in shear
As observed from the tests [1, 2], the behaviour of an EMP loaded in shear is like that of an un-stiffened plate. It can be divided into 2 stages: prior to buckling and post-buckling. Prior to buckling, the stress of a web plate is a combination of two principal stresses with equal magnitude: tensile and compressive components. When the load increases, these stresses are increased until attaining the shear buckling stress of the plate, and global buckle occurs. This elastic instability is marked by out-of-plane deformations. The compressive principal stress cannot increase any further. The global
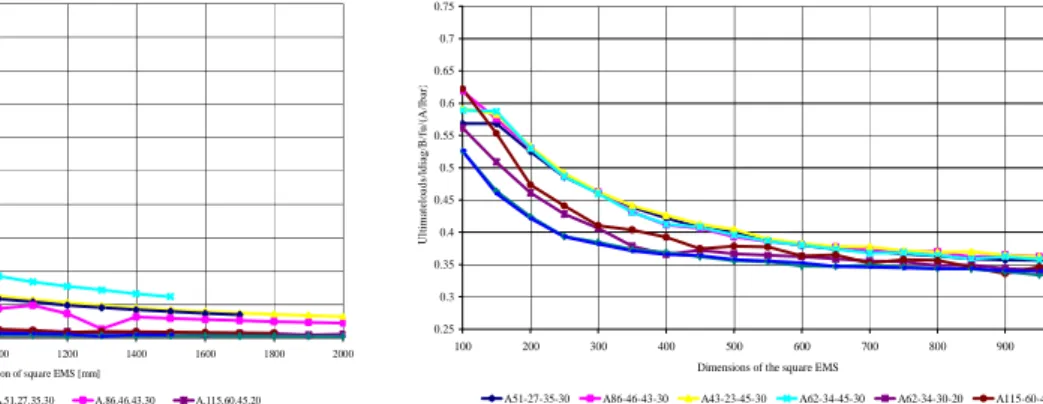
behaviour of the plate is changed and pure diagonal tensile fields are formed. Therefore, the shear ultimate resistance of the EMP is the sum of two components: prior to buckling, tension fields. Its shear resistance prior to buckling is dependent on its slenderness and the related critical loads. For a usual plain steel beam web, a slenderness (ratio of the side of the sheet by its thickness), equal to 100, already corresponds to a very thin web. The slenderness of the EMP goes up to 500 or 1000. In addition, with same thickness, the EMP has a flexural stiffness much smaller than the full plate. This implies that its shear strength prior to buckling is very limited. Figure 3 presents the developments of the first critical loads with increasing dimensions of the EMP. When the dimensions of the EMP are large, these loads decrease rapidly and are approximately equal to zero. Therefore the ultimate resistance of the EMP is governed by tension field developed on the sheet after buckling. Nearly 3000 numerical simulations have been carried out to see the evolution of the ultimate load in function of the dimensions of the different EMP. It is found that there is a constant evolution of the width of the diagonal band in tension depending on the size of the panels, on the width/height ratio and on the profile of the EMP. Figure 4 presents the relationship between the dimensions of the EMP and the ultimate load of a rectangular EMP divided by the thickness of the sheet, by the ratio between the width and the length of the bars, by the length of the diagonal of the EMP and by the ultimate stress of bars. The most interesting result is the convergence of these curves for large sizes of the EMP. Depending on the ratio between width and height of the sheets, the effective width of the EMP is proportional to length of the diagonal band ldia, to the ratio between width and length of the bars α and
to a constant ratio γ. The shear resistance V of EMP can be calculated as following formulae:
Bf l
V =γαdia (Exp. 1). Where: ldia is the diagonal length of the sheet; f is the stress generated in the
equivalent diagonal bar and α=A/lbar; lbar: being the length of the bars and γ being equal to 0.3, 0.27
and 0.18 for square, rectangular with ratio 2:1 and rectangular with ratio 3:1, respectively.
0 5 10 15 20 25 30 35 40 45 50 200 400 600 800 1000 1200 1400 1600 1800 2000 Dimension of square EMS [mm]
C ri ti ca l L o a d s [k N ]
A.43.23.45.30 A.62.34.45.30 A.51.27.35.30 A.86.46.43.30 A.115.60.45.20 A.62.34.30.20 A.62.34.25.15 A.43.23.25.15 A.31.16.23.15
0.25 0.3 0.35 0.4 0.45 0.5 0.55 0.6 0.65 0.7 0.75 100 200 300 400 500 600 700 800 900 1000 Dimensions of the square EMS
U lt im at el o a d s/ ld ia g /B /f u /( A /l b ar )
A51-27-35-30 A86-46-43-30 A43-23-45-30 A62-34-45-30 A62-34-30-20 A115-60-45-20 A62-34-25-15 A43-23-25-15
Figure 3 – Critical loads of the different EMP Figure 4 – Evolution of ultimate shear resistance
2.2.2 Cyclic behaviour of the EMP
Resulting from nearly 1000 numerical simulations for different profiles and dimensions of EMP cyclically loaded in shear, as in Figure 5, an approximate bilinear model for hysteretic loops of the EMP, surrounded by a very rigid, pin jointed frame has been established in Figure 6. Vcr, Vy and Vu are
the critical, yield and ultimate shear forces of the EMP, and ∆y, ∆p, ∆u are the yield, plastic and the
ultimate displacements, respectively. From points O to A the response is elastic and linear. Then there is a shift of stiffness of the EMP due to buckling. However, the critical load Vcr approximately equals
zero so that the behaviour before global buckle is negligible. After buckling, an inclined tension field develops and the EMP yields when the shear load equals Vy. From A to B1, the EMP strains plastically
and from B1 to C1 it unloads elastically with the line B1C1 parallel to OA. The length OC1 is
proportional to the plastic elongation of the tensile diagonal. At the beginning of load reversal, there is a residual displacement of the EMP due to the plasticity. The plastic contraction of the opposite diagonal occurs. The stiffness of the EMP at this stage is equal to zero. The length OD1 is proportional
to the corresponding plastic contraction of this diagonal, and is computed by OD1=βOC1. The ratio β,
taken as 0.5, is obtained based on the plastic theory of a thin plate [10]. The opposite tension field behaviour continues from D1 to E1. Contribution of compressive band, when loads are reversed, is also
diagonal when compressive stresses in this diagonal are fully recovered. At the point E1 the shear load
is equal to – Vy. From E1 to F1 the EMP strains plastically in the opposite direction, and it unloads
from F1 to G1, parallel to OA. The plastic elongation of the panel diagonal during the second half of
the cycle is proportional to G1D1. Hence C1H1 is given by: C1H1=βG1D1. At H1, the EMP buckles and
from H1 to B1 an inclined tension field develops again. From B1, the second cycle is similar to the first
one. G1D2 and C2H2 are given by: G1D2=βH1C2 and C2H2=βG2D2.
-60 -40 -20 0 20 40 60 -15 -12 -9 -6 -3 0 3 6 9 12 15 Displacements(mm) L o ad s( k N )
Cyclic Behaviour Monotonic Behaviour in Tension Monotonic Behaviour in Compression
Figure 5 – Hysteretic behaviour of a 500mm square EMP with the profile of A51-27-35-30
Figure 6 – A simplified model of hysteretic behaviour of EMP
3. DESIGN OF RC-MRF ACCORDING TO EC2 AND EC8
3.1 Description of the designed frames
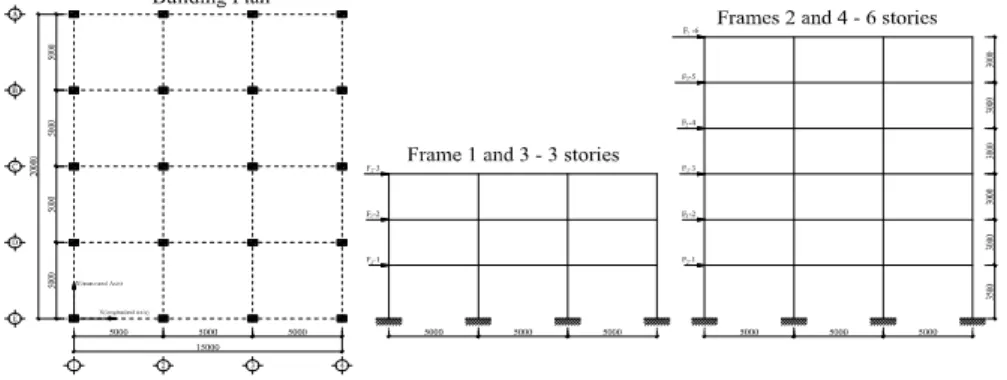
Four RC buildings, having 3 and 6 stories and similar plan layout as defined in Figure 7 and Table 1 are studied. The first two buildings are designed according to EC2. The other two are designed to both EC2 and EC8. The PGA is 0,15g, the soil type is C, the Ductility Class is M, corresponding to a behaviour factor q=3,9 and the coefficient of importance γI is 1. The bottom story height is equal to
3,5m, the other story height being equal to 3m. Beam spans are equal to 5m. The thickness of slabs is 0,15m. To avoid significant over-strength, an effort is made to choose the member dimensions as small as possible. A distributed permanent load of 5,67kN/m2 represents finishing and partitions at all floors. A distributed live load equivalent to a weight of 3kN/m2 is considered for occupancy at inter-story floors, and a live load of 2kN/m2 is supposed for roof. All frames are subjected a wind load of 0,9kN/m2 on pressure surfaces and of 0,07kN/m2 on suction surfaces. The material properties are identical for all structures: concrete cubic characteristic strength, fck=25MPa and steel characteristic
yield strength, fyk=500MPa.
Figure 7 – View of plan and elevation of the studied frames Table 1 – Cross-sectional dimensions of members of frames
Frames Number of Stories
ag/DC/q Columns Beams Slab
Internal External Width Height Flange width
1 1/3 EC2 0,35x0,35 0,35x0,35 0,25 0,35 0,85 0,15
2 2/6 EC2 0,35x0,35 0,45x0,45 0,25 0,35 0,85 0,15
3 3/3 0,15g/DCM/3,9 0,35x0,35 0,35x0,35 0,25 0,35 0,85 0,15
3.2 Analysis, design and detail of frames
All the buildings are symmetrical in plan and elevation. Therefore, analyses may be performed as planar frames for the two main horizontal directions [3], [4]. Here, only the planar frames, parallel to short edges of the plan and having less flexural stiffness than the perpendicular ones, are studied. Accidental torsion effects are taken into account [4]. The slab contributes to the stiffness of studied frames and the beams are computed as T-section, with the reinforcement of the slabs within the effective width of the beams considered in the beam resistance. SAP2000 [5] is used to check cross-sectional dimensions of all members, to determine the combinations of internal forces of all frames and to calculate detail longitudinal and transversal rebar of the structural elements. For the frames designed to EC8, the cracking of concrete is taken into account: the flexural stiffness of beams and columns are assigned to be one-half of the corresponding uncracked ones. The elements of the studied frames are assumed to have adequate stirrup areas so that plastic hinges are only form due to flexural bending. Table 2 to 4 show the modal properties and reinforcement configuration of the four frames.
Table 2 – Elastic periods of the not retrofitted frames and design base shear of frame 3 and 4 (in m) Frame 1(3-story) Frame 2(6-story) Frame 3(3-story) Frame 4(6-story) Un-crack Crack Un-crack Crack Un-crack Crack Design base shear
Un-crack Crack Design base shear
0,65s 0,88s 1,31s 1,85s 0,65s 0,88s 215kN 1,16s 1,5s 220kN
Table 3 – Total weight and effective mass of the first mode (weight: kN, mass: kG)
Frame 1(3-story) Frame 2(6-story) Frame 3(3-story) Frame 4(6-story)
Weight %E. Mass Weight %E. Mass Weight %E. Mass Weight %E. Mass
1721,6 91 3486,4 86 1721,6 91 3536,1 86
Table 4 – Reinforcement configuration of the four frames Frame/Number
of Stories
Beams (all stories) Column (number of stories x rebar configuration)
Top Bottom Exterior Interior
1/3 12Φ10+2Φ10 3Φ14 2x8Φ8+1x8Φ14 3x8Φ8
2/6 12Φ10+2Φ10 3Φ14 1x8Φ12+4x8Φ8+1x8Φ14 1x8Φ22+1x8Φ16+1x8Φ10+3x8Φ8
3/3 12Φ10+2Φ10 3Φ14 3x8Φ20 3x8Φ20
4/6 12Φ10+2Φ10 3Φ14 6x8Φ16 1x8Φ22+5x8Φ16
4. NONLINEAR SEISMIC RESPONSE OF RC-MRF WITH AND WITHOUT EMP
4.1.1 Introduction, basic assumptions and seismic input
To assess the efficiency of EMP, all frames are evaluated with and without EMP by using nonlinear static (Pushover) according to EC8 and nonlinear time history analyses (NLTH). Pushover is first performed to assess the existing and retrofitted frames. Then NLTH is used to check the results of pushover analysis, and to assess the real behaviour of structures before and after being retrofitted.
-2 -1,5 -1 -0,5 0 0,5 1 1,5 2 0 3 6 9 12 15 Ac ce ler ati on (m /s2 ) Time(s)
Accelerogram 1 - Soil C - type 1 - 0,15g
-2 -1,5 -1 -0,5 0 0,5 1 1,5 2 0 3 6 9 12 15 Ac ce ler ati on (m /s2 ) Time(s)
Accelerogram 2 - Soil C - type 1 - 0,15g
-2 -1,5 -1 -0,5 0 0,5 1 1,5 2 0 3 6 9 12 15 Ac ce ler ati on (m /s2 ) Time(s)
Accelerogram 3 - Soil C - type 1 - 0,15g
-2 -1,5 -1 -0,5 0 0,5 1 1,5 2 0 3 6 9 12 15 Ac ce ler ati on (m /s2 ) Time(s)
Accelerogram 4 - Soil C - type 1 - 0,15g
To perform nonlinear analyses of the frames, estimation of actual values of material strengths is considered, instead of the design strength, in order to reflect the expected real over-strength of the structures. For steel S500, a stress-strain diagram typical of Tempcore steel (fy=500MPa; E=200GPa)
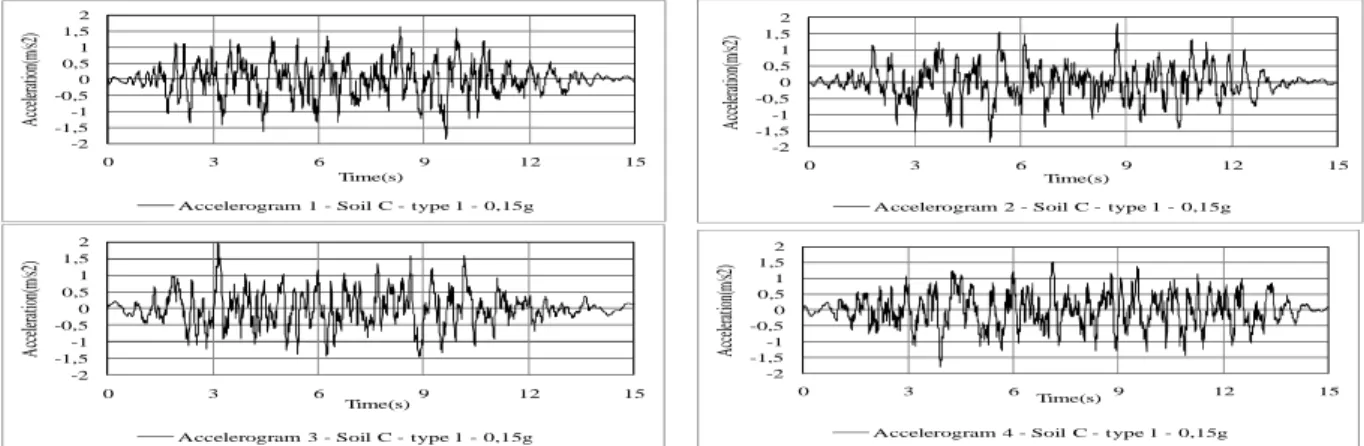
is considered. For concrete C25/30, compressive unconfined strength of 33MPa is considered. Thee equivalent viscous damping is defined at 5%. The seismic excitation is represented by a set of four artificial accelerograms, shown in Figure 8, with γI.S.agR=1.1,15.0,15g.
4.1.2 Nonlinear modelling of the EMP and frame components
Nonlinear analyses are performed with SEISMOSTRUCT software, developed by SEISMO Group [6]. Flexural rotations are regarded as inelastic property of frame members, while other deformations are assumed to be elastic. Beams and columns are modelled as inelastic frame elements with distributed plasticity. The fibre approach is used to represent the cross-section behaviour, and the sectional stress-strain state of beam-column elements is then obtained through the integration of the nonlinear uniaxial stress-strain response of the individual fibres. A uniaxial nonlinear constant confinement model, proposed by Mander et al. [1998], is assumed for nonlinear properties of the concrete. The confinement ratio is taken as 1,2 for the concrete core and as 1,0 for the cover. A strain corresponding to peak strength equal to 0,2% and an ultimate strain equal to 3,5% are adopted for the analyses. An elastic-perfectly plastic steel stress-strain diagram is assumed. Seismic performance criteria are based on FEMA356 [9] with three levels of plastic deformations of beams or columns, labelled IO, LS, and CP, standing for Immediate Occupancy, Life Safety, and Collapse Prevention, respectively. Viscous damping of Rayleigh type is assumed for NLTH with a damping factor of 5% for the first and second modes. EMP is modelled as an axial tension strut with a bilinear force-displacement relationship for pushover analysis.
4.1.3 Response of the not retrofitted frames
Pushover and NLTH are used to check the seismic performances of all frames before retrofitting. In pushover, gravity loads, equal to the sum of the dead loads and 24% of the live loads as required by EC8, are kept constant while lateral loads, corresponding to uniform and modal load patterns, are monotonically increased. The behaviour of the structures from pushover is set forward by the capacity curves, which represent the relationship between the base shear and the horizontal displacement the roof level. Transforming the capacity curve of the real structure into a bilinear curve corresponding to the behaviour of a single degree of freedom structure using the rules of equalizing the displacements and dissipated energy, a performance point or a target displacement under a given PGA can be determined. Seismic performance of the structure is assessed based on these performance points or target displacements. Three criteria are considered as the failure modes of the structures due to seismic actions: (1) soft-story mechanism; (2) local failure and (3) at the state as the structure is 20% below the maximum strength attained. The following parameters characterize the results of pushover analysis: Vb
1y
and ∆b 1y
– base shear and displacement at first yield; Vb m
and ∆b m
– base shear and displacement at failure; E – dissipated energy; ∆t
0,15gsC
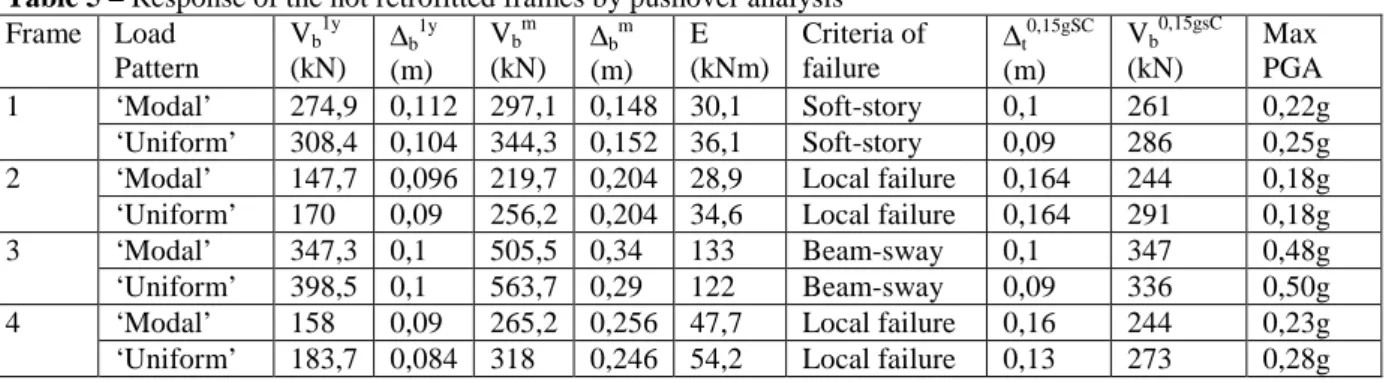
– target displacement due to seismic action; Max PGA - maximum PGA that the structures are able to resist. Table 5 and 6 present the results from pushover analysis. Table 7 and 8 present the results obtained by NLTH.
Table 5 – Response of the not retrofitted frames by pushover analysis Frame Load Pattern Vb1y (kN) ∆b 1y (m) Vbm (kN) ∆b m (m) E (kNm) Criteria of failure ∆t 0,15gSC (m) Vb0,15gsC (kN) Max PGA 1 ‘Modal’ 274,9 0,112 297,1 0,148 30,1 Soft-story 0,1 261 0,22g ‘Uniform’ 308,4 0,104 344,3 0,152 36,1 Soft-story 0,09 286 0,25g 2 ‘Modal’ 147,7 0,096 219,7 0,204 28,9 Local failure 0,164 244 0,18g ‘Uniform’ 170 0,09 256,2 0,204 34,6 Local failure 0,164 291 0,18g
3 ‘Modal’ 347,3 0,1 505,5 0,34 133 Beam-sway 0,1 347 0,48g
‘Uniform’ 398,5 0,1 563,7 0,29 122 Beam-sway 0,09 336 0,50g
4 ‘Modal’ 158 0,09 265,2 0,256 47,7 Local failure 0,16 244 0,23g
Table 6 – Drift of the not retrofitted frames by pushover analysis (%)
Frame 1 (Average of two load patterns) Frame 2 (Average of two load patterns)
Story1 Story2 Story3 Story1 Story2 Story3 Story 4 Story 5 Story 6
1,14 1,2 1 0,91 1,1 0,832 1,1 0,97 0,89
Frame 3 (Average of two load patterns) Frame 4 (Average of two load patterns)
0,9 1,1 1 0,76 0,89 0,93 0,904 1,1 0,78
Table 7 – Periods and max base shear of the not retrofitted frames from NLTH
Frame 1 (Average) Frame 2 (Average) Frame 3 (Average) Frame 4 (Average) Period Base shear Period Base shear Period Base shear Period Base shear
0,6s 184,3kN 1,1s 233,9kN 0,52s 233,3kN 1s 252,3kN
Table 8 – Max story drift (%) and top displacements (m) of the not retrofitted frames by NLTH
Frame 1 (Average) Frame 2 (Average)
Story1 Story2 Story3 Top Displ Story1 Story2 Story3 Story4 Story5 Story6 Top Displ
0,7% 0,75% 0,71% 0,07m 0,70% 0,8% 0,8% 0,77% 0,72% 0,66% 0,124m
Frame 3 (Average) Frame 4 (Average)
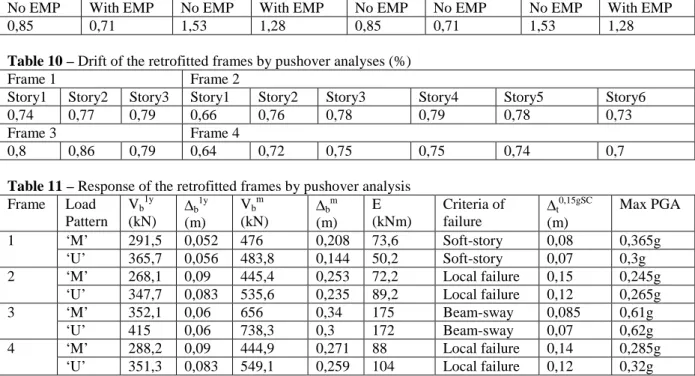
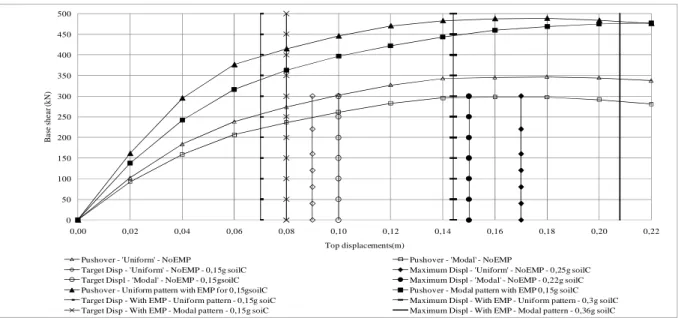
0,51% 0,66% 0,64% 0,064m 0,63% 0,71% 0,74% 0,72% 0,69% 0,64% 0,118m 4.1.4 Comparison of behaviour between original and retrofitting frames by pushover analyses To evaluate the effectiveness of the EMP in enhancing seismic behaviour of frames, EMP are chosen to carry the seismic forces. The design shears at each story are evaluated on the basis of the computed base shears. Depending on the deficiency of the not retrofitted frames, types of the EMP are selected. Because all frames are symmetric with three bays, EMP are put in the intermediate bay. In frame 1 and 3 (3-story frames), the EMP are put in the first and second stories, while the EMP are put in the first to fourth stories in frame 2 and 4 (6-story frames). Because there is no hinge in the columns at the upper stories, no EMP is put there. Table 9 to 11 present the results from pushover analyses of four retrofitted frames. Figure 9 shows the capacity curves and global target drifts of frame 1 before and after being retrofitted. It is clear that with the presence of the EMP, all frames are stiffer (decrease of the periods), stronger (increase of the ultimate strength) and more ductile. EMP also absorbs a large amount of energy during the earthquake. With EMP the new frames can reach much larger displacements and resist stronger earthquakes.
Table 9 – Periods of all frames with and without EMP
Frame 1 Frame 2 Frame 3 Frame 4
No EMP With EMP No EMP With EMP No EMP No EMP No EMP With EMP
0,85 0,71 1,53 1,28 0,85 0,71 1,53 1,28
Table 10 – Drift of the retrofitted frames by pushover analyses (%)
Frame 1 Frame 2
Story1 Story2 Story3 Story1 Story2 Story3 Story4 Story5 Story6
0,74 0,77 0,79 0,66 0,76 0,78 0,79 0,78 0,73
Frame 3 Frame 4
0,8 0,86 0,79 0,64 0,72 0,75 0,75 0,74 0,7
Table 11 – Response of the retrofitted frames by pushover analysis Frame Load Pattern Vb1y (kN) ∆b1y (m) Vbm (kN) ∆bm (m) E (kNm) Criteria of failure ∆t0,15gSC (m) Max PGA 1 ‘M’ 291,5 0,052 476 0,208 73,6 Soft-story 0,08 0,365g ‘U’ 365,7 0,056 483,8 0,144 50,2 Soft-story 0,07 0,3g 2 ‘M’ 268,1 0,09 445,4 0,253 72,2 Local failure 0,15 0,245g
‘U’ 347,7 0,083 535,6 0,235 89,2 Local failure 0,12 0,265g
3 ‘M’ 352,1 0,06 656 0,34 175 Beam-sway 0,085 0,61g
‘U’ 415 0,06 738,3 0,3 172 Beam-sway 0,07 0,62g
4 ‘M’ 288,2 0,09 444,9 0,271 88 Local failure 0,14 0,285g
0 50 100 150 200 250 300 350 400 450 500 0,00 0,02 0,04 0,06 0,08 0,10 0,12 0,14 0,16 0,18 0,20 0,22 B as e sh ea r (k N ) Top displacements(m)
Pushover - 'Uniform' - NoEMP Pushover - 'Modal' - NoEMP
Target Disp - 'Uniform' - NoEMP - 0,15g soilC Maximum Displ - 'Uniform' - NoEMP - 0,25g soilC
Target Displ - 'Modal' - NoEMP - 0,15gsoilC Maximum Displ - 'Modal' - NoEMP - 0,22g soilC
Pushover - Uniform pattern with EMP for 0,15gsoilC Pushover - Modal pattern with EMP 0,15g soilC
Target Disp - With EMP - Uniform pattern - 0,15g soiC Maximum Displ - With EMP - Uniform pattern - 0,3g soilC
Target Disp - With EMP - Modal pattern - 0,15g soiC Maximum Displ - With EMP - Modal pattern - 0,36g soilC
Figure 9 – Capacity curves and target displacements of Frame 1 before and after retrofitted
5. CONCLUSIONS AND PERSPECTIVES
A novel system to retrofit reinforced concrete moment resisting frames is introduced. This consists of assembling Expanded Metal Panels in the weaker stories. Based on the comparison of seismic performance of RC-MRF before and after retrofitting made by nonlinear time history and pushover analyses, the following conclusions are drawn:
1. NLTH points out that pushover analysis is successful in capturing the behaviour of low and medium rise buildings.
2. The application of the proposed retrofitting system results in an increase of strength, stiffness and ductility. The energy dissipated by EMP is significant, reaching about 50% of the total energy. 3. Although EMP cannot change the failure mechanism of the structures, it can reduce the demand of
seismic actions thanks to increases of strength and stiffness and ductility of the structures. Next steps of this study are to:
1. Model more different types of RC-MRF with and without EMP by both pushover and NLTH. 2. Characterise the use of EMP to retrofit RC-MRF and suggest the design or retrofit procedures. 3. Make suggestions for the connections between the EMP and RC-MRF.
ACKNOWLEDGEMENT
This research has been made possible thanks to funding from the French Community of Belgium – Macromousse Project and to a funding of the Government of the People’s Republic of Viet Nam.
REFERENCES
[1] Phung Ngoc Dung, André Plumier, ‘Experiments of expanded metal panels under shear loading’, 9th National Congress
on theoretical and Applied Mechanics, Brussels, May 2009.
[2] Phung Ngoc Dung, André Plumier, ‘Behaviour of expanded metal panels under shear loading’– SDSS 2010. [3] EN. Eurocode 2 - 1: Design of concrete structures – December 2004
[4] EN. Eurocode 8 - 1: Design of structures for earthquake resistance – December 2004 [5] CSI. SAP2000 V-9.0.3 – Berkeley (USA) - Computer and Structures Inc
[6] SEISMOSTRUCT - Nonlinear Finite Analysis Program – Seismo Group – Version 5.0.1 – 17/01/2010 [7] FINELG – Nonlinear Finite Analysis Program – University of Liege – Version 8.5 – 15/05/2002 [8] GOSCA – Generation of Spectrum Compatible – University of Liege – V. Denoel – 4/2001
[9] FEMA 356 – Prestandard and commentary for seismic rehabilitation of buildings. Washington DC; 2000 [10] T.M.Roberts&S.S.Ghomi – Hysteretic characteristics of unstiffened plate shear panels, T.W. Structures; 1990