Stochastic analysis of the recharge uncertainty of a regional aquifer in extreme arid conditions
4
0
0
Texte intégral
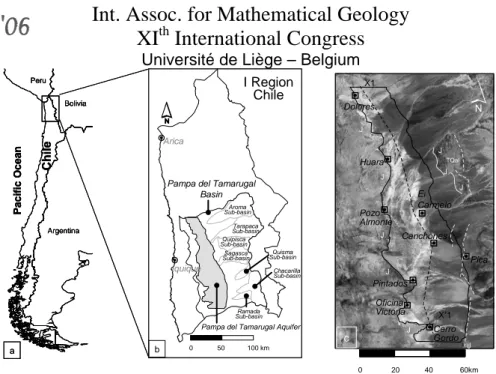
(2) Int. Assoc. for Mathematical Geology XIth International Congress Université de Liège – Belgium I Region Chile. Peru Bolivia. 2. X1 Dolores. Arica. Chile. Pacific Ocean. J J TQal. Huara Pampa del Tamarugal Basin Aroma Sub-basin Tarapaca Sub-basin Quipisca Sub-basin Sagasca Sub-basin. Argentina. J. J. El Carmelo. Pozo Almonte J. Canchones. Quisma Sub-basin. Iquique. J. Pica. Chacarilla Sub-basin. J. Pintados Oficina Victoria. Ramada Sub-basin. Pampa del Tamarugal Aquifer. b. a. 0m 0. c. 50000m 100000m 50 100 km. X’1 Cerro Gordo. J. J. 00 0. 20000 40000 60000 20 40 60km 20. 40. 60km. Fig. 1. Location of the study area. a) General location in Chile, b) Pampa del Tamarugal Basin and sub-basins delimitation (shaded area is PTA), c) Modelled domain.. 2. Study area The PTA is located in the Pampa del Tamarugal basin and it covers an area of ca. 5000 km² (Fig. 1b). Direct precipitation on the PTA is nil and thus no recharge through this process is expected. On the other hand, the eastern sub-basins receive precipitation produced at high altitudes and it is accepted that part of this water is recharging the aquifer through infiltration and lateral groundwater flows (Aravena, 1995). As described in Houston (2002), the basin is a complex asymmetric graben bounded in the west and in the east by N-S regional fault zones. JICA-DGA-PCI (1995) showed that the main aquifer system is composed of the upper units of Altos de Pica Formation (Q4 and Q3) with depths ranging from 50 m up to 300 m. 2.1. Water balance The water balance for the PTA is shown in Table 1. According to JICA-DGA-PCI (1995) the groundwater recharge coming from the eastern sub-basins for the period 1960-1993 is estimated to be 976 l/s. Tab. 1. Water balance (l/s) for years 1960, 1987, 1993 Flow Components Recharge from sub-basins Transpiration Tamarugo areas Evaporation from Salares Groundwater Outflow Pumping Discharge TOTAL. In 976. 976. 1960 Out 210 410-602 164-356 0 976. In 976. 976. 1987 Out 690 286 164-356 716 1856-2048. In 976. 976. 1993 Out 904 145 164-356 730 1943-2135. Transpiration from forested areas increases from 210 l/s in 1960 up to 904 l/s in 1993 due to reforestation strategies (FAO, 1989). Evaporation decreases from 542 l/s in 1960 up to 145 l/s in 1993 due to the steady decrease observed in the groundwater heads in the PTA (Rojas, 2005). The groundwater outflows are estimated between 164 l/s and 356 l/s (Rojas, 2005). Pumping discharges increases from nil values in 1960 up to 730 l/s in 1993 due to rises in the groundwater demand for public water supply and mining activities.. Liège – September, 3rd - 8th 2006. S10-14.
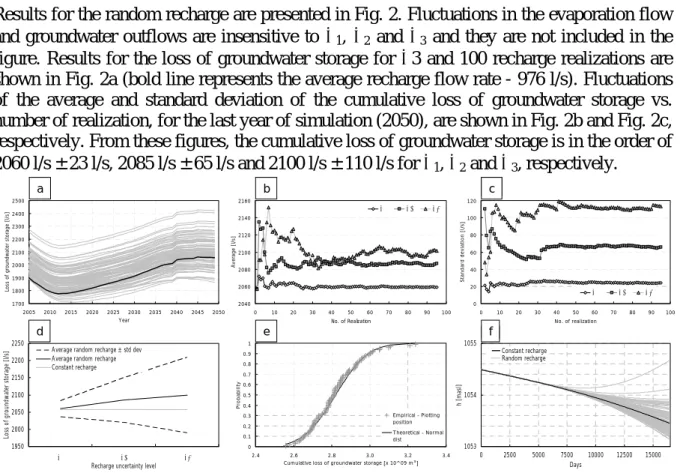
(3) Int. Assoc. for Mathematical Geology XIth International Congress Université de Liège – Belgium. 2.2. Groundwater flow model A groundwater flow model considering the modelled domain depicted in Fig. 1c was developed. The model combined upper units of Altos de Pica Formation in one hydrostratigraphic unit. In order to implement and solve numerically the groundwater flow equation subject to the respective boundary conditions, MODFLOW (McDonald and Harbaugh, 1988) was used. The groundwater model was calibrated for steady (1960) and transient (1983-2004) conditions. Subsequently, series of 100 purely random realizations of average recharge values were generated for three levels of uncertainty expressed as a percentage of the average recharge (R) values. Each of these recharge values was used in order to simulate a 45 years period (2005-2050). The level of uncertainty was set arbitrarily in σ1=0.05R, σ2=0.15R and σ3=0.35R. Random recharge flow rates were generated for each sub-basin using a random number generator honouring a log-normal distribution to avoid negative values. Spatio-temporal structure of correlation for the recharge values were not considered in the synthetic generation.. 3. Results Results for the random recharge are presented in Fig. 2. Fluctuations in the evaporation flow and groundwater outflows are insensitive to σ1, σ2 and σ3 and they are not included in the figure. Results for the loss of groundwater storage for σ3 and 100 recharge realizations are shown in Fig. 2a (bold line represents the average recharge flow rate - 976 l/s). Fluctuations of the average and standard deviation of the cumulative loss of groundwater storage vs. number of realization, for the last year of simulation (2050), are shown in Fig. 2b and Fig. 2c, respectively. From these figures, the cumulative loss of groundwater storage is in the order of 2060 l/s ± 23 l/s, 2085 l/s ± 65 l/s and 2100 l/s ± 110 l/s for σ1, σ2 and σ3, respectively. a. b 120. σ1. 2400. σ2. σ3 100 Standard deviation [l/s]. 2140. 2300 2200 2100 2000. 2120 2100 2080. 1900 2060. 1800 1700 2005. 2010. 2015. 2020. 2025. 2030. 2035. 2040. 2045. 2050. 10. 20. 30. 40. 50. 60. 70. 80. 90. 40. 100. σ1 0. 10. 20. 30. No. of Realization. e. 40 50 60 No. of realization. σ2 70. σ3 80. 90. 100. f. 1. Average random recharge ± std dev Average random recharge Constant recharge. 1055 Constant recharge Random recharge. 0.9 0.8 0.7 Probability. 2150 2100 2050. 0.6. h [masl]. 2200. 60. 0 0. d 2250. 80. 20. 2040 Year. Loss of groundwater storage [l/s]. c. 2160. Average [l/s]. Loss of groundwater storage [l/s]. 2500. 0.5 0.4 0.2. 2000. Theoretical - Normal dist. 0.1. 1950. 1053. 0. σ1. σ2 Recharge uncertainty level. σ3. 1054. Empirical - Plotting position. 0.3. 2.4. 2.6 2.8 3.0 3.2 Cumulative loss of groundwater storage [x 10^09 m³]. 3.4. 0. 2500. 5000. 7500. 10000. 12500. 15000. Days. Fig. 2. Results for the random recharge analysis: a) loss of groundwater storage for PTA vs. time, b) average loss of groundwater storage for year 2050 vs. number of recharge realization, c) standard deviation of the loss of groundwater storage for year 2050 vs. number of recharge realization, d) loss of groundwater storage vs. level of uncertainty in recharge values, e) probability distribution for the cumulative loss of groundwater storage (45 years), f) groundwater head fluctuation for an artificial piezometer located in Aroma creek (North).. Fig. 2d shows a comparison between the cumulative loss of storage for the average recharge case and the random recharge case. From this figure, it is possible to see that the cumulative loss of groundwater storage deviates significantly from the average recharge case when Liège – September, 3rd - 8th 2006. S10-14.
(4) Int. Assoc. for Mathematical Geology XIth International Congress Université de Liège – Belgium. increasing the uncertainty in the recharge values. In Fig. 2e the probability distribution of the cumulative loss of groundwater storage for σ3 is depicted. Based on the groundwater storage reserve estimated in JICA-DGA-PCI (1995), it is unlikely that the cumulative loss of storage for a 45 years simulation period will be larger than 12% of the known reserves. Fig. 2f shows the groundwater head variation in an artificial piezometer located in the north of the modelled domain for σ3. This area presents the largest variation in groundwater heads (1.7 m) and it is located in the confluence of the two most northern sub-basins, which jointly generate ca. 50 % of the total incoming groundwater recharges. Therefore, it is clear that the northern subbasins influence the groundwater heads in the north sector of the study area.. 4. Conclusions Using the projection of the current groundwater abstraction and including random recharge values in a simulation period of 45 years, evaporation flow rates from Salares and groundwater outflows are insensitive to all uncertainty levels in recharge (σ1, σ2 and σ3). This could be related to: a) the time span (45 years) used to evaluate the flow components which could suggest that the simulation period might be too short to observe more pronounced effects, or b) since evaporation and transpiration are strong compared to the recharge in the modelled domain, the insensitivity might also be due to the evaporation and transpiration overpowering the recharge effect. The cumulative loss of groundwater storage for supplying the system demand increases when the uncertainty in the recharge increases. Despite of this, the cumulative loss of groundwater storage represents less than 12% of the known groundwater total reserves for the most uncertain case (σ3). Uncertainties in the simulated groundwater heads due to uncertainties in average recharge values are more noticeable in the north area of the modelled domain. Although these fluctuations in groundwater head are minors, they certainly could explain observed anomalies in wells located in this area, where some local recharge events could be expected. REFERENCES Aravena, R., 1995. Isotope hydrology and geochemistry of northern Chile groundwaters. Bulletin de l’institute français d’études andines 24 (3) : 495-503. Dirección General de Aguas – Universidad de Chile - DGA-UChile (1988) Hydrogeological simulation model of the Pampa del Tamarugal [In Spanish]. Technical report. 98 pp. Food and Agriculture Organization – FAO (1989) Role of Forestry in combating desertification. FAO Conservation Guide 21. Houston J (2002) Groundwater recharge through an alluvial fan in the Atacama Desert, northern Chile: mechanisms, magnitudes and causes. Hydrological Processes 16 : 3019-3035. Japanese International Cooperation Agency JICA; Dirección General de Aguas DGA; Pacific Consultants International PCI – JICA-DGA-PCI (1995) The study on the development of Water Resources in northern Chile. Technical report. Supporting reports B and C. 259 pp. McDonald M, Harbaugh A (1988) A modular three-dimensional finite-difference groundwater flow model. USGS Technical Report on Modelling Techniques Book 6. 596 pp. Rojas R (2005) Groundwater flow model of Pampa del Tamarugal Aquifer – Northern Chile. MSc Thesis Water Resources Engineering. Katholieke Universiteit Leuven and Vrije Universiteit Brussel. 103 pp.. Liège – September, 3rd - 8th 2006. S10-14.
(5)
Figure
Documents relatifs
Vers un résumé d'Evaluation Gériatrique Standardisée pour les médecins généralistes et anesthésistes
Au cours de l’année 2012, dans les suites d’un travail de thèse et de mémoire en cours de rédaction (doctorant : Jérôme TISSERAND ; direction : Dr Aline WAGNER : chef
Using the principal lithologic name from the core description to assign five lithologies (sand, silt, clay, calcareous clay, and volcanic ash; see Lithostratigraphy ),
LES REPRESENTATIONS ICONOGRAPHIQUES DE SOCRATE Socrate, donc, n’était plus parmi les hommes ; mais les Athéniens se repentirent aussitôt, au point de fermer palestres et gymnases.
As detailed in Section 3, the methodological approach involves three steps: (i) quality-control and selection of suitable flow records available from 72 gauging stations along the
The distributed modeling of irrigated meadows together with the modeling of groundwater has been undertaken for quantifying the contribution of the irrigation to the recharge of
Unsaturated zone experiments are carried out at selected field sites in the Kingdom of Saudi Arabia, representing different potential groundwater recharge scenarios in arid
DC that have sampled intestinal bacteria (and induced intestinal mucosal immune responses) are rather poor at killing the sentinel bacteria, especially in comparison with
Recharge changes for future periods are mainly a function of the climate scenario, but more extreme weather conditions lead to model bias in the predictions and must be
![[PDF] Support de cours informatique de gestion pdf | Cours informatique](data:image/gif;base64,R0lGODlhAQABAIAAAP///wAAACH5BAEAAAAALAAAAAABAAEAAAICRAEAOw==)