Journal Name
Cite this: DOI: 10.1039/c0xx00000x
www.rsc.org/xxxxxx
Dynamic Article Links
►
ARTICLE TYPE
Atomistic modeling of site exchange defects in lithium iron phosphate
and iron phosphate
Christian Kuss,
aGuoxian Liang,
bSteen B. Schougaard*
aReceived (in XXX, XXX) Xth XXXXXXXXX 20XX, Accepted Xth XXXXXXXXX 20XX DOI: 10.1039/b000000x
5
A new set of potentials is presented that allows for modeling of the entire lithium insertion range of the lithium iron phosphate system (LixFePO4, 0 ≤ x ≤ 1). By comparing calculated values to experimental
crystallographic, spectroscopic and thermodynamic data, the potentials ability to reproduce experimental results consistently and reliably is demonstrated. Calculations of site exchange defect thermodynamics and diffusion barriers for lithium and iron inside the lithium diffusion path suggest that site exchange
10
defect related capacity loss may be justified exclusively by thermodynamic considerations. Moreover, a low activation barrier for iron transport in the lithium diffusion channel in FePO4 brings into question the
significance of the antisite iron ion as an obstacle to lithium diffusion.
Introduction
In recent years, interest in the global climate crisis has been rising.
15
This interest and the belief that the limits of global fossil fuel resources exploitation are imminent1 have boosted the search for
alternative energy sources and storage devices. Hence, lithium ion batteries are being developed on a massive scale for applications ranging from electric transportation to storage facilities buffering
20
the energy needs of whole communities.2 One very promising
positive electrode material for medium to large lithium ion batteries is lithium iron phosphate (LiFePO4),3 as it is produced
from low cost, non-toxic raw materials, is stable4 and achieves
relatively high charge storage capacities with the theoretical limit
25
of 170 mAh/g. 3
Many different synthesis routes have been developed to produce what is nominally olivine-LiFePO4,1-5 however, the material
exhibits significant performance differences depending on its preparation route.5 To achieve consistently the best possible
30
product, it is therefore essential to understand the mechanisms behind these performance fluctuations. To this end material modeling plays a crucial role as a compliment to nanoscale characterization techniques like TEM etc.6-9
Several modeling techniques have already been exploited to
35
investigate LiFePO4 batteries at different levels spanning from
atomistic to macroscopic scales. At the atomic scale, ab initio10-15,
as well as empirical16-18 techniques have been employed to study
LiFePO4. Investigation of the LixFePO4 system has been
conducted very thoroughly using the computationally expensive
40
first principles methods.10, 11, 15, 19 Yet, approaching some of the
system’s central issues, such as defect chemistry and interface dynamics,20 these techniques quickly reach the available resource
limits. Alternatively, using empirical techniques, as is the case in the present paper, makes it possible to investigate problems that
45
require a several orders of magnitudes larger number of atoms to
capture the central properties.
Most widely available empirical modeling software for ionic solids are based on calculations employing a set of interatomic empirical potentials. In the case of the LiFePO4 system a set of potential
50
parameters has previously been derived, however, for use exclusively with fully lithiated LiFePO4.16 Other studies use a more
general set of potentials, entailing a loss in specificity of the applied assumptions of the model.17 By means of atomistic
modeling, site exchange defects have been determined to exhibit a
55
low defect energy.16 Consequent investigation of antisite and site
exchange defects led to the direct observation and quantification of these defects and the study of their effect on the materials performance.8, 21, 22 Depending on the preparation route site
exchange defects can occur in concentrations up to 8%.21
60
To investigate the whole compositional range of the LixFePO4
system (0 ≤ x ≤ 1), a new set of potential parameters is presented here that covers the various iron oxidation states. Moreover, in a first application of this new set of potentials, we study the importance of thermodynamics in the lithium extraction process of
65
LiFePO4 with site exchange defects, as well as, lithium and iron
ion mobility in the lithium diffusion channel of these materials.
Methods
Model and interatomic potentials
The modeled systems were represented by a group of point ions,
70
signifying the ionic constituents of the real material and by interactions between these elements through empirical potential functions. The well-established General Utility Lattice Program (GULP) code by J.D. Gale was used for all presented calculations. It has been extensively reviewed elsewhere.23 The empirical
75
potential method works particularly well for purely ionic systems, but can also be employed successfully for mixed ionic and covalent substances such as LiFePO4.16, 18, 24 In this study, long range
interactions, were modeled by simple Coulomb interaction, whereas short range repulsive and van der Waals interactions took on the form of the Buckingham potential.25 These Buckingham
pair potentials were applied for Li−O, Fe(II)−O, Fe(III)−O, P−O and O−O interactions. A shell model, binding a charged massless
5
shell to the point ion of the core with a harmonic spring model,26
was employed for the polarizable oxygen ions.
As the potential parameters are dependent on the system being modeled, they have been fitted extensively to the experimentally found crystal structures of pure olivine LiFePO4 and pure
10
heterosite FePO4 (see reference 23 for a detailed account of the
fitting procedure). In an advanced stage of the fitting process, the strongest vibrational frequency from the heterosite FePO4 infrared
spectrum was included as an observable. The final optimized parameters are summarized in Table 1.
15
For the calculation of intermediate compositions LixFePO4,
primitive unit cells were created in which lithium defects were placed in different orderings. After geometry optimization the most stable configuration was chosen for further calculations. Intermediate oxidation states of iron, required for solid solution
20
calculations, were treated using a mean field approach. The iron sites were thereby assumed to be partially occupied by Fe(II) and Fe(III) at the same time, while their interactions were scaled by the appropriate factor. The vibrational energies and infrared activities of Gamma point phonon modes have been calculated from single
25
point vibrational calculations of the relaxed structures. Defect calculations
For site exchange defect calculations, 50 super cells of 48 formula units each, containing randomly distributed site exchange defects for 1/12 or 1/24 of all crystallographic lithium and iron sites
30
(corresponding to approximately 8% and 4% site exchange defects respectively) were used. Free energies of defects were obtained from single point vibrational calculations at the 0 K optimized structure with a Monkhorst-Pack grid of 2x2x2 k-points, where free energies were converged to 0.04 eV (at the chosen super cell
35
size). No statistically significant change in the defect energies were observed when reducing the super cell size. Cited statistical errors are based on a 95 % confidence interval for a two-tailed Student distribution.
Table 1. Potential parameters
40
Interaction
Buckingham potential parameters A / eV ρ / Å C / eV ∙ Å6 Li+−O2− 381.5244 0.30491 0 Fe2+−O2− 13207.008 0.22245 0 Fe3+−O2− 2111.9671 0.28941 0 P5+−O2− 1028.9741 0.33530 0 O2−−O2− 39.7594 0.47713 53.204 Species Core charge Shell charge kS / eV/Å2
Li+ +1 − − Fe2+ +2 − − Fe3+ +3 − − P5+ +4.9708 − − O2− +0.9015 −2.8942 67.3564 Diffusion calculations
The ion diffusion activation barriers were calculated using the Mott-Littleton approach27 as implemented in the GULP code23
with a region 1 size of 14 Å and a region 2 size of 24 Å. Diffusion
45
paths were obtained by displacing the moving ion along the b-axis and allowing relaxation in a and c crystallographic directions only. Diffusion coefficients have been estimated for room temperature using the Einstein-Smoluchovski equation. Perfectly anisotropic diffusion along the b-axis and an attempt frequency of 1.4 ∙ 1013
50
Hz was assumed. This frequency was derived from the phonon mode with strongest lithium movement along the b-axis in LiFePO4. As the oxidation state of antisite iron ions is not known,
the activation barrier for iron ion diffusion was calculated with the extreme values of the oxidation state, i.e. +2 and +3.
55
Figure 1. Experimental (solid squares, by Delacourt et al.28) and
calculated (open triangles) cell volume as a function of composition in the solid solution LixFePO4.
Results and Discussion
60
Potential validation
The crystal structure of both end members of the LixFePO4 system
is very well reproduced by the model (Table 2) with relative errors for crystal structure parameters within 0.5 %. The same general agreement can be found when comparing the calculated dielectric
65
constant of LiFePO4 to earlier results (electronic supplementary
information). Properties and crystal structures of intermediate compositions LixFePO4 have also been calculated. LixFePO4
equilibrates into a two phase system under ambient conditions. However, when heating the phase separated material, a solid
70
solution behavior can be observed.28 As shown in Figure 1 the
experimentally found unit cell volume compares well to the calculated ones. Since the interatomic potentials have been fitted to ambient condition structures while the experiment is conducted at 350°C the calculated unit cell is slightly smaller. Transferability
75
Table 2. Reproduction of experimental crystal structures
LiFePO4 Calculated Experimental29 Δ / %
a / Å 10.362 10.338 + 0.2 b / Å 5.983 6.011 − 0.5 c / Å 4.680 4.695 − 0.3 FePO4 a / Å 9.763 9.760 + 0.04 b / Å 5.740 5.752 − 0.2 c / Å 4.767 4.756 + 0.2 (2y ≤ 3-x ≤ 3y) is presented in the electronic supplementary information.
Crystal structures serve to evaluate a model’s ability to predict
5
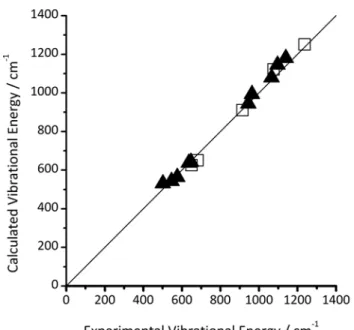
local minima in the potential energy surface. However, in order to calculate most properties accurately, the curvature of the potential energy surface needs to be reproduced as well. To this end, tests of the reproduction of vibrational energies using infrared spectroscopic results showed strong correlation between
10
calculation and experiment (Figure 2).
Figure 2. Correlation between calculated and experimental vibrational energies derived from infrared spectroscopy for LiFePO430 (solid
triangles) and for FePO431 (open squares). Black line: Perfect correlation. 15
Lithium diffusion in FePO4 and LiFePO4
Olivine LiFePO4, as well as, heterosite FePO4 crystalize in the Pnma space-group. Lithium and iron thereby occupy 4a and 4c
Wyckoff positions respectively. In the following, the abbreviation M1 for the crystallographic lithium site and M2 for the
20
crystallographic iron site will be used. The mechanism of lithium motion in the LixFePO4 system during battery operation is a subject
of intense research and discussion, as such it is not yet clear if lithium moves through a lithium rich phase, a lithium poor phase, an interphase or in a solid solution.6, 32, 33 However, it is generally
25
accepted that lithium moves preferably along the b crystallographic direction.16, 34, 35 We therefore apply the technique
employed by Islam et al. to compare the movement of lithium ions in FePO4 and LiFePO4 within our model.16 The activation barrier
for a lithium ion to move from one M1 site to
30
Figure 3. a) Histograms showing the distribution of free energies of defects in LiFePO4 (solid bars) and FePO4 (open bars) among 50 Super
Cells with 8% site exchange defect concentration. b) Correlation of free
35
energy of defects with average local charge in LiFePO4 (solid symbols)
and FePO4 (open symbols) at 8% defect concentration (squares) and 4%
defect concentration (circles). c) Illustration of average site exchange defect energies in LiFePO4 and FePO4 and the consequence for
electrochemical cycling.
40
the next along the b-axis was calculated to 0.415 eV in FePO4 and
0.420 eV in LiFePO4. Based on these values, the estimated lithium
diffusion coefficient is 5 ∙ 10-10 cm2/s in both FePO
4 and LiFePO4.
Moreover, investigating the diffusion path, little difference can be found between lithium diffusion in LiFePO4 and FePO4. It follows
45
positively charged iron ions. This is consistent with previously reported models.7, 16 It has been suggested before that electron
transport has a significant impact on ion diffusion barriers in the LixFePO4 system.7, 19 Nevertheless, the comparably good
agreement of our calculations, which does not invoke electronic
5
transport, with the experimental values of 10-11 - 10-17 cm2/s is
noteworthy.36
Thermodynamics of delithiation of site exchange defects Defects have frequently been used to explain the discrepancy between calculated and observed diffusion coefficients.7, 37
10
Particularly, site exchange defects are a frequent finding, whereby a lithium ion is found in a M2 site, while an iron ion is found in the M1 site.8, 21, 22 The concentration of these defects may reach levels
of more than 8%.21 At these concentrations, correlation between
defects can have a significant impact on defect energies. We
15
therefore investigated 50 super cells with 4 or 2 randomly distributed site exchange defects each (corresponding to approx. 8 % and 4 % defect concentration respectively). Figure 3a illustrates the significant differences in defect energy and in width of energy distribution for LiFePO4 and FePO4 at 8% defect concentration.
20
Free energies of defects in LiFePO4 average to 1.3 eV, compared
to 0.7 eV defect energy modeled by Fisher and Islam,13, 20 while an
average of 3.9 eV was found in FePO4. Furthermore, correlations
between the average defect energy and the position of the defects relative to each other were investigated. No statistically significant
25
correlation could be observed in LiFePO4 or FePO4 with respect to
average distance between point defects. However, the point defects are generally charged and as such the defect energy will likely depend on the local accumulation of charges. To assess this accumulation, a quantity was derived that we termed average
30
localized charge. This value is calculated through integration of all charges within the volume of one unit cell, which is transposed across the relaxed super cell in ¼ unit cell length steps to obtain an average charge (Figure S1). The average localized charge is therefore zero in a theoretically perfect crystal. In general we found
35
that super cells that exhibit a larger localized charge, also exhibit larger defect energy. In addition this effect is correlated to the material lithiation state. As a point defect in FePO4 (± 3e) is more
highly charged than in LiFePO4 (± 1e), generally, the average
localized charge also increases. Defects in FePO4 therefore have
40
more significant long range effects compared to LiFePO4. This
difference in range of interaction provides an explanation for the strong energy difference observed between site exchange defects in LiFePO4 and in FePO4 (Figure 3b). The increase of defect
charge during oxidation of iron and removal of lithium from the
45
structure leads to a strong increase in defect energy. Especially empty M2 sites are highly unstable. Transferring this to the electrochemical charging process, it is possible to calculate an additional potential necessary to fully oxidize LiFePO4 containing
site exchange defects.
50
From the reaction free energy of
[Li1−ε,Feε]M1[Fe1−ε,Liε]M2PO4 + [ ]M1[Fe]M2PO4 →
[Feε]M1[Fe1−ε]M2PO4 + [Li]M1[Fe]M2PO4 [1]
this additional potential is estimated to 2.6 eV ± 0.5 eV at 25 °C (Figure 3 c), i.e. the potential vs. Li/Li+ required to remove lithium
55
from the antisite defects is 6.0 V. Electrolyte stability dictates an
oxidation potential no larger than ~5V vs. Li/Li+ for most lithium
ion batteries.38 Consequently, in the absence of a concerted
exchange of the defect lithium ion by another positively charged ion, this lithium is inaccessible to electrochemical cycling (Figure
60
4).
Even before removing the antisite lithium, oxidation of iron and removal of lithium ions will increase defect charge. Considering the aforementioned dependence of the defect energy on defect charge, a slight increase in the lithiation and delithiation potential
65
relative to Li/Li+ is therefore expected in the presence of site
exchange defects.
Recent computational studies describe the kinetic hindrance of delithiation by the presence of iron in the lithium diffusion channel.7, 37 It was concluded that this hindrance is large and
70
decreases the diffusion rate by several orders of magnitude compared to the theoretical perfectly crystalline LiFePO4. Even the
slowest estimates by Malik et al., however, allow lithium transport through a 1 µm particle within approximately 15 minutes. Nevertheless, a capacity loss of the order of the site exchange
75
defect concentration has been observed experimentally in nano-sized particles after 30 minutes delithiation time.22 The present
study suggests that this capacity loss is thermodynamic, i.e. permanent.
Fe diffusion in LiFePO4 and FePO4
80
In the above mentioned computational studies iron was regarded as immobile in the M1 site. To the best of our knowledge this assumption has not yet been proven experimentally and can rapidly be tested using the new set of potentials. To this end, the mobility of iron ions in the M1 site along the b-axis in LiFePO4 and in
85
FePO4 has been examined. With a transport barrier of 1.2 eV, the
assumption holds true for LiFePO4. However, in FePO4, a low
diffusion barrier of only 0.45 eV to 0.50 eV is observed. Iron in the M1 site in FePO4 therefore exhibits a mobility that is comparable
to lithium. The migration path in both cases resembles closely the
90
path observed for the lithium ion, with a slightly larger deviation from the linear path. In turn this puts into question the ability of iron in the M1 site to block the diffusion of the lithium, as it can move to the particle surface where its behavior is difficult to predict, but could include, dissolution into the electrolyte,
95
inclusion in the carbon coating or displacement into a surface defect site. This would lead to an increase in capacity during the first discharge/charge cycles as has been observed by several groups.2, 39
Figure 4. The site exchange defect. Left: crystalline Pnma LiFePO4,
Right: Pnma LiFePO4 with site exchange. The lithium ion, which is
hindered from delithiation, is tinted red.
Conclusions
5
The presented set of potentials is a simple new tool to access accurate mechanical atomistic data across the complete composition range LixFePO4 (0 ≤ x ≤ 1). Its estimate of the lithium
diffusion barrier produces diffusion coefficients that are consistent with experimental values.
10
While probing the site exchange defect, a strong dependence of the defect energy on defect charge is observed. As the charge of the site exchange defect increases during delithitation, an increase in the systems energy has been predicted. This increase was quantified and is especially substantial when removing antisite
15
lithium and leaving an empty M2 site, making this lithium inaccessible to electrochemical cycling in common batteries. Together with calculations predicting high mobility of antisite iron in the iron phosphate lithium diffusion channel, these findings challenge the current view on the mechanism of battery
20
performance depression due to site exchange defects.
Acknowledgements
The authors acknowledge gratefully Compute Canada’s CLUMEQ for providing computational resources for this project and the National Science and Engineering Research Council of Canada
25
(NSERC), Grant no. CRD 385812-09 for financial support. We furthermore thank Dr. S. Islam for assistance and Dr. R. Cornut for helpful discussions.
Notes and references
a Department for Chemistry, Université du Québec à Montréal, 2101 rue
30
Jeanne-Mance, Montreal (QC) H1X 2J6, Canada
b Phostech Lithium Inc., 1475 rue Marie-Victorin, St.Bruno de Montarville (QC) J3V 6B7, Canada
† Electronic Supplementary Information (ESI) available: Calculated
35
mechanical properties, dielectric constants and heat capacities of LiFePO4
and FePO4, illustration of the average localized charge determination and
transferability of the interatomic potentials. See DOI: 10.1039/b000000x/ 1. T.-H. Cho and H.-T. Chung, J. Power Sources, 2004, 133, 272-276.
40
2. V. Palomares, A. Goñi, I. G. d. Muro, I. de Meatza, M. Bengoechea, O. Miguel and T. Rojo, J. Power Sources, 2007, 171, 879-885. 3. G. Arnold, J. Garche, R. Hemmer, S. Ströbele, C. Vogler and M.
Wohlfahrt-Mehrens, J. Power Sources, 2003, 119-121, 247-251. 4. S. Yang, P. Y. Zavalij and M. S. Whittingham, Electrochem.
45
Commun., 2001, 3, 505-508.
5. S. Franger, F. Le Cras, C. Bourbon and H. Rouault, J. Power Sources, 2003, 119-121, 252-257.
6. C. Delmas, M. Maccario, L. Croguennec, F. Le Cras and F. Weill, Nat. Mater., 2008, 7, 665-671.
50
7. G. K. P. Dathar, D. Sheppard, K. J. Stevenson and G. Henkelman, Chem. Mater., 2011, 23, 4032-4037.
8. S.-Y. Chung, S.-Y. Choi, T. Yamamoto and Y. Ikuhara, Phys. Rev. Lett., 2008, 100, 125502.
9. C. A. J. Fisher, V. M. Hart Prieto and M. S. Islam, Chem. Mater., 2008,
55
20, 5907-5915.
10. F. Zhou, T. Maxisch and G. Ceder, Phys. Rev. Lett., 2006, 97, 155704. 11. S. P. Ong, L. Wang, B. Kang and G. Ceder, Chem. Mater., 2008, 20,
1798-1807.
12. S. P. Ong, A. Jain, G. Hautier, B. Kang and G. Ceder, Electrochem.
60
Commun., 2010, 12, 427-430.
13. X. Hou, S. Hu, W. Li, L. Zhao, Q. Ru, H. Yu and Z. Huang, Chin. Sci. Bull., 2008, 53, 1763-1767.
14. Z. Wang, S. Sun, D. Xia, W. Chu, S. Zhang and Z. Wu, J. Phys. Chem. C, 2008, 112, 17450-17455.
65
15. C. Ouyang, S. Shi, Z. Wang, X. Huang and L. Chen, Phys. Rev. B, 2004, 69, 104303.
16. M. S. Islam, D. J. Driscoll, C. A. J. Fisher and P. R. Slater, Chem. Mater., 2005, 17, 5085-5092.
17. S. Adams and R. P. Rao, Solid State Ionics, 2011, 184, 57-61.
70
18. G. R. Gardiner and M. S. Islam, Chem. Mater., 2010, 22, 1242-1248. 19. S. P. Ong, V. L. Chevrier and G. Ceder, Phys. Rev. B, 2011, 83,
075112.
20. L.-X. Yuan, Z.-H. Wang, W.-X. Zhang, X.-L. Hu, J.-T. Chen, Y.-H. Huang and J. B. Goodenough, Energy & Environmental Science, 2011,
75
4, 269-284.
21. J. Chen and J. Graetz, ACS Appl. Mater. Interfaces, 2011, 3, 1380-1384.
22. S.-P. Badi, M. Wagemaker, B. L. Ellis, D. P. Singh, W. J. H. Borghols, W. H. Kan, D. H. Ryan, F. M. Mulder and L. F. Nazar, J. Mater.
80
Chem., 2011, 21, 10085-10093.
23. J. D. Gale and A. L. Rohl, Mol. Simul., 2003, 29, 291-341.
24. S. Girard, J. D. Gale, C. Mellot-Draznieks and G. Férey, Chem. Mater., 2001, 13, 1732-1738.
25. R. A. Buckingham, Proc. R. Soc. London, A, 1938, 168, 264-283.
85
26. B. G. Dick and A. W. Overhauser, Phys. Rev., 1958, 112, 90. 27. N. F. Mott and M. J. Littleton, Trans. Faraday Soc., 1938, 34, 485-499. 28. C. Delacourt, P. Poizot, J.-M. Tarascon and C. Masquelier, Nat.
Mater., 2005, 4, 254-260.
29. G. Rousse, J. Rodriguez-Carvajal, S. Patoux and C. Masquelier, Chem.
90
Mater., 2003, 15, 4082-4090.
30. C. M. Burba and R. Frech, J. Electrochem. Soc., 2004, 151, A1032-A1038.
31. N. D. Trinh, G. Liang, M. Gauthier and S. B. Schougaard, J. Power Sources, 2012, 200, 92-97.
95
32. R. Malik, F. Zhou and G. Ceder, Nat. Mater., 2011, 10, 587-590. 33. P. P. Prosini, J. Electrochem. Soc., 2005, 152, A1925-A1929. 34. J. Li, W. Yao, S. Martin and D. Vaknin, Solid State Ionics, 2008, 179,
2016-2019.
35. P. Zhang, Y. Wu, D. Zhang, Q. Xu, J. Liu, X. Ren, Z. Luo, M. Wang
100
and W. Hong, J. Phys. Chem. A, 2008, 112, 5406-5410.
36. M. Park, X. Zhang, M. Chung, G. B. Less and A. M. Sastry, J. Power Sources, 2010, 195, 7904-7929.
37. R. Malik, D. Burch, M. Bazant and G. Ceder, Nano Lett., 2010, 10, 4123-4127.
105
39. J. Morales, R. Trócoli, S. Franger and J. Santos-Peña, Electrochim. Acta, 2010, 55, 3075-3082.